

For Buyers
Latest Unemployment Report: Great News…for the Most Part

Whether you own a house already or you’re looking to buy one, you probably care about home prices. But it’s not always easy to figure out what’s really happening right now, especially if you look at the headlines.
One says home prices are falling. The next says they’re still climbing.
So, which one’s right? It comes down to where you live.
What’s Really Going on with Asking Prices
Part of the confusion out there may be based on what’s happening to asking prices and how the media is talking about it. They’re calling attention to how asking prices are falling, but don’t give the full context or say that seasonality is at play. So here it is.
Right now, there are more homes on the market than at any other time since November 2019. And with mortgage rates rising since the spring, those homes are taking a little longer to sell. One way to help a home sell quickly in that environment is to have a lower asking price.
According to HousingWire Data, the median asking price is down from $449k in early August to $435k just 2 months later (see graph below):
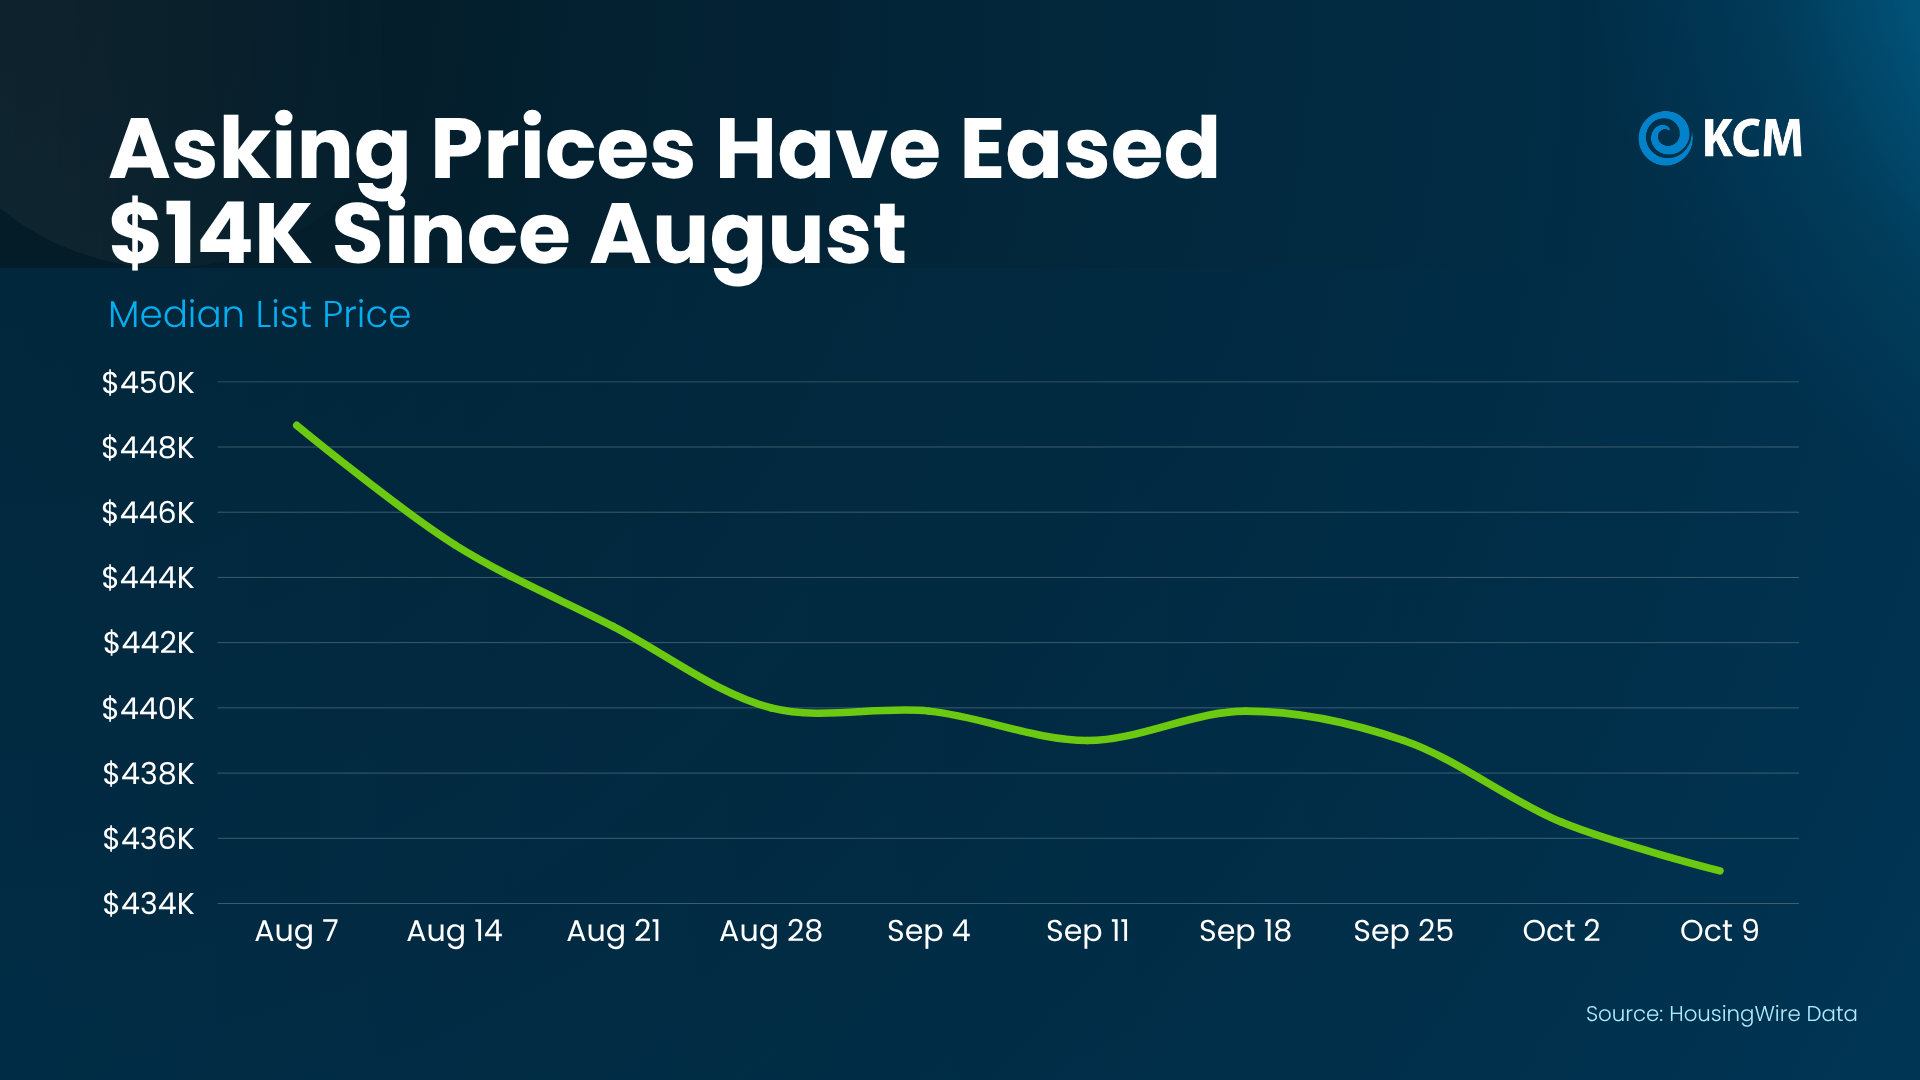
That’s a dip of about 3%, and a lot of it is normal for this time of year.
Asking prices cool off every fall once the busy summer season wraps up. With fewer buyers this time of year, sellers price a bit more competitively. Today’s rates play a role too, since sellers are pricing to match what buyers can afford right now. And that’s a good thing. Smart pricing helps homes sell.
Just keep in mind, that’s a national list price. It doesn’t show what homes near you are actually selling for. So before you react to a headline, ask a local agent what’s really happening in your area.
Where You Live Changes Everything
Realtor.com explains:
“While national headlines might suggest a buyer’s market is taking hold, the reality on the ground depends heavily on where and what you’re trying to buy. Local trends can diverge sharply from national averages, especially when you factor in price range, property type, and post-pandemic market dynamics.”
The latest numbers from S&P Cotality Case-Shiller Index show how true that is. Over the past year, sales prices in Chicago rose almost 7%. In Seattle, they dipped about 1.6%. That’s a gap of nearly 9 percentage points between two major cities (see graph below):
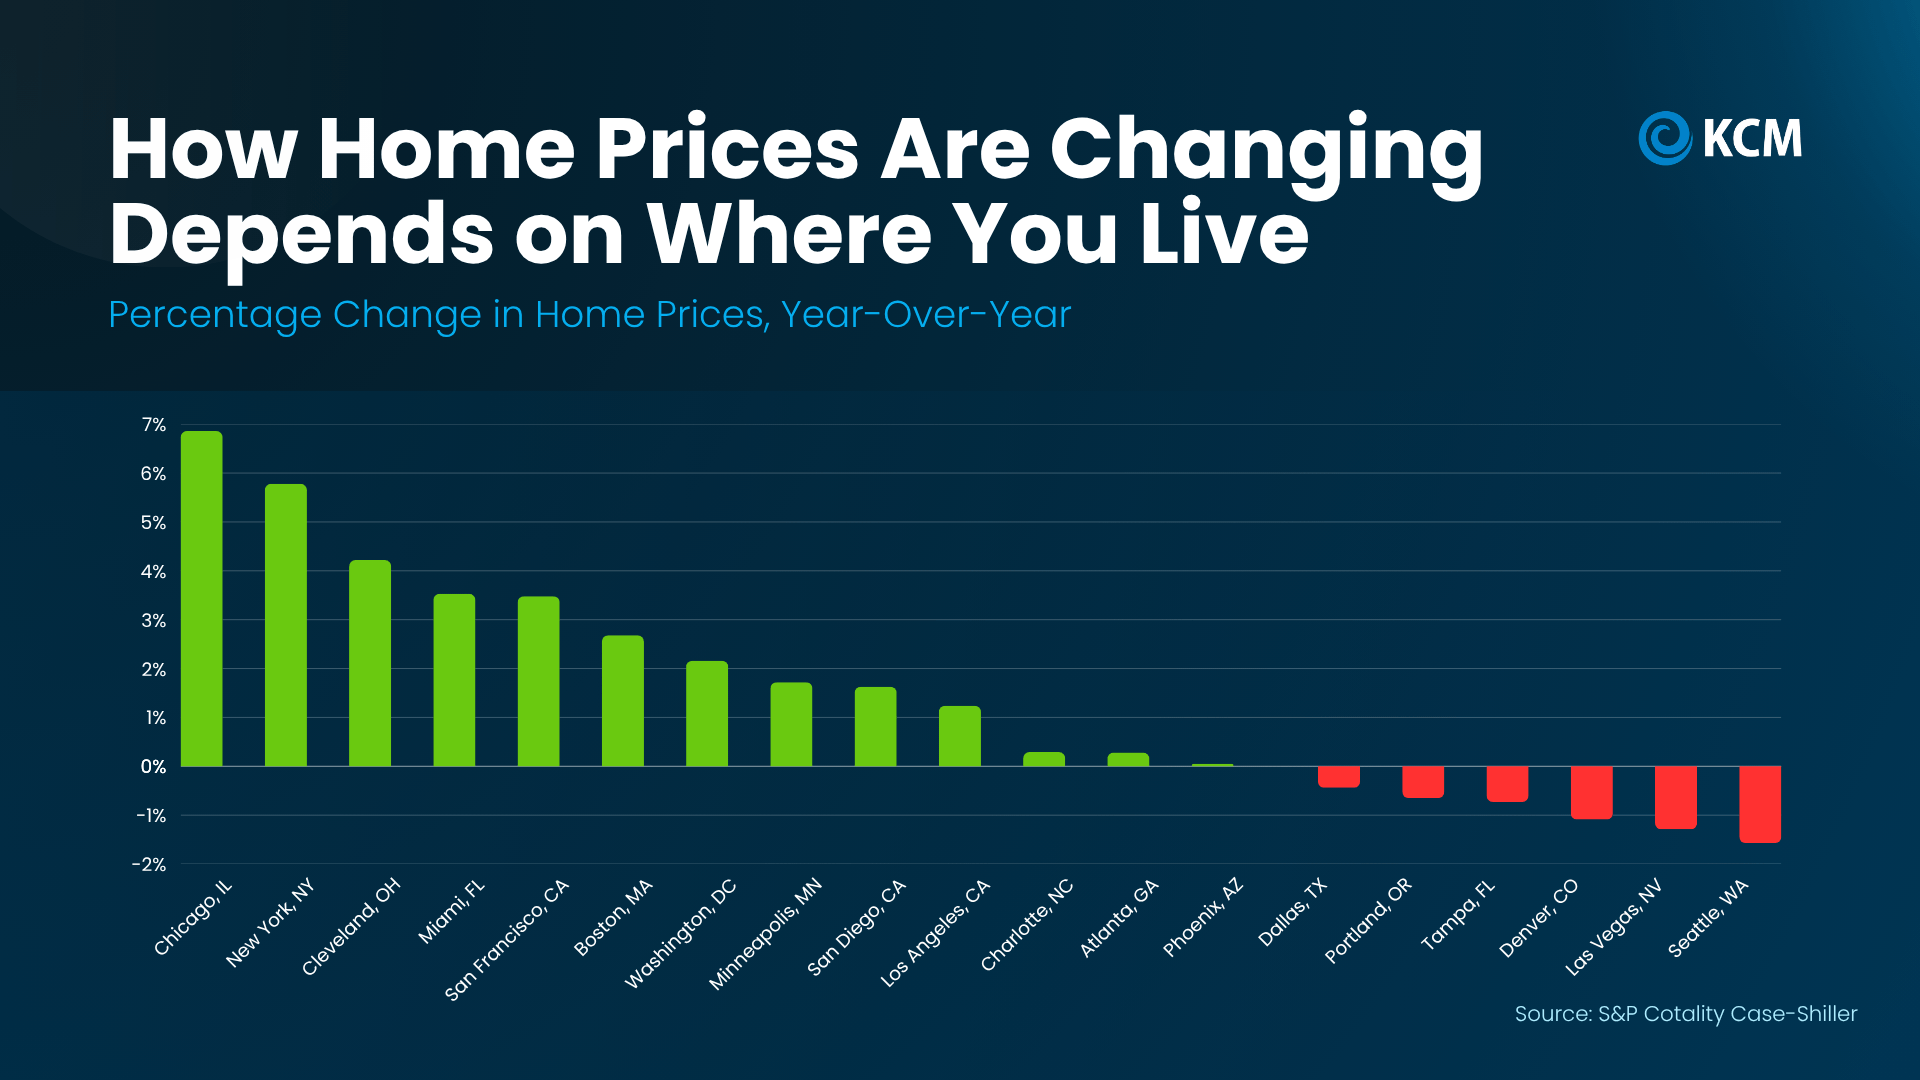
That gap changes your game plan. Selling in New York, where prices are up almost 6%? You may not need to cut your price. Buying in Denver or Las Vegas? You may have more room to negotiate.
Why You Don’t Need To Worry About a Crash
Just in case you’re seeing those slight declines in some markets and worried it means a bigger crash is coming, here’s what you need to remember. Even in the major metros where prices are down, the declines are 2% or less. That’s a long way from a crash like 2008. And if you look back at the graph above, there are more cities in the green than in the red.
And over time, home values have a strong track record. The Federal Housing Finance Agency (FHFA) says national prices have grown year-over-year every quarter since 2012. Go back further, and a $100k home bought in 1991 would be worth about $436k today, even with the 2008 crash factored in (see graph below):
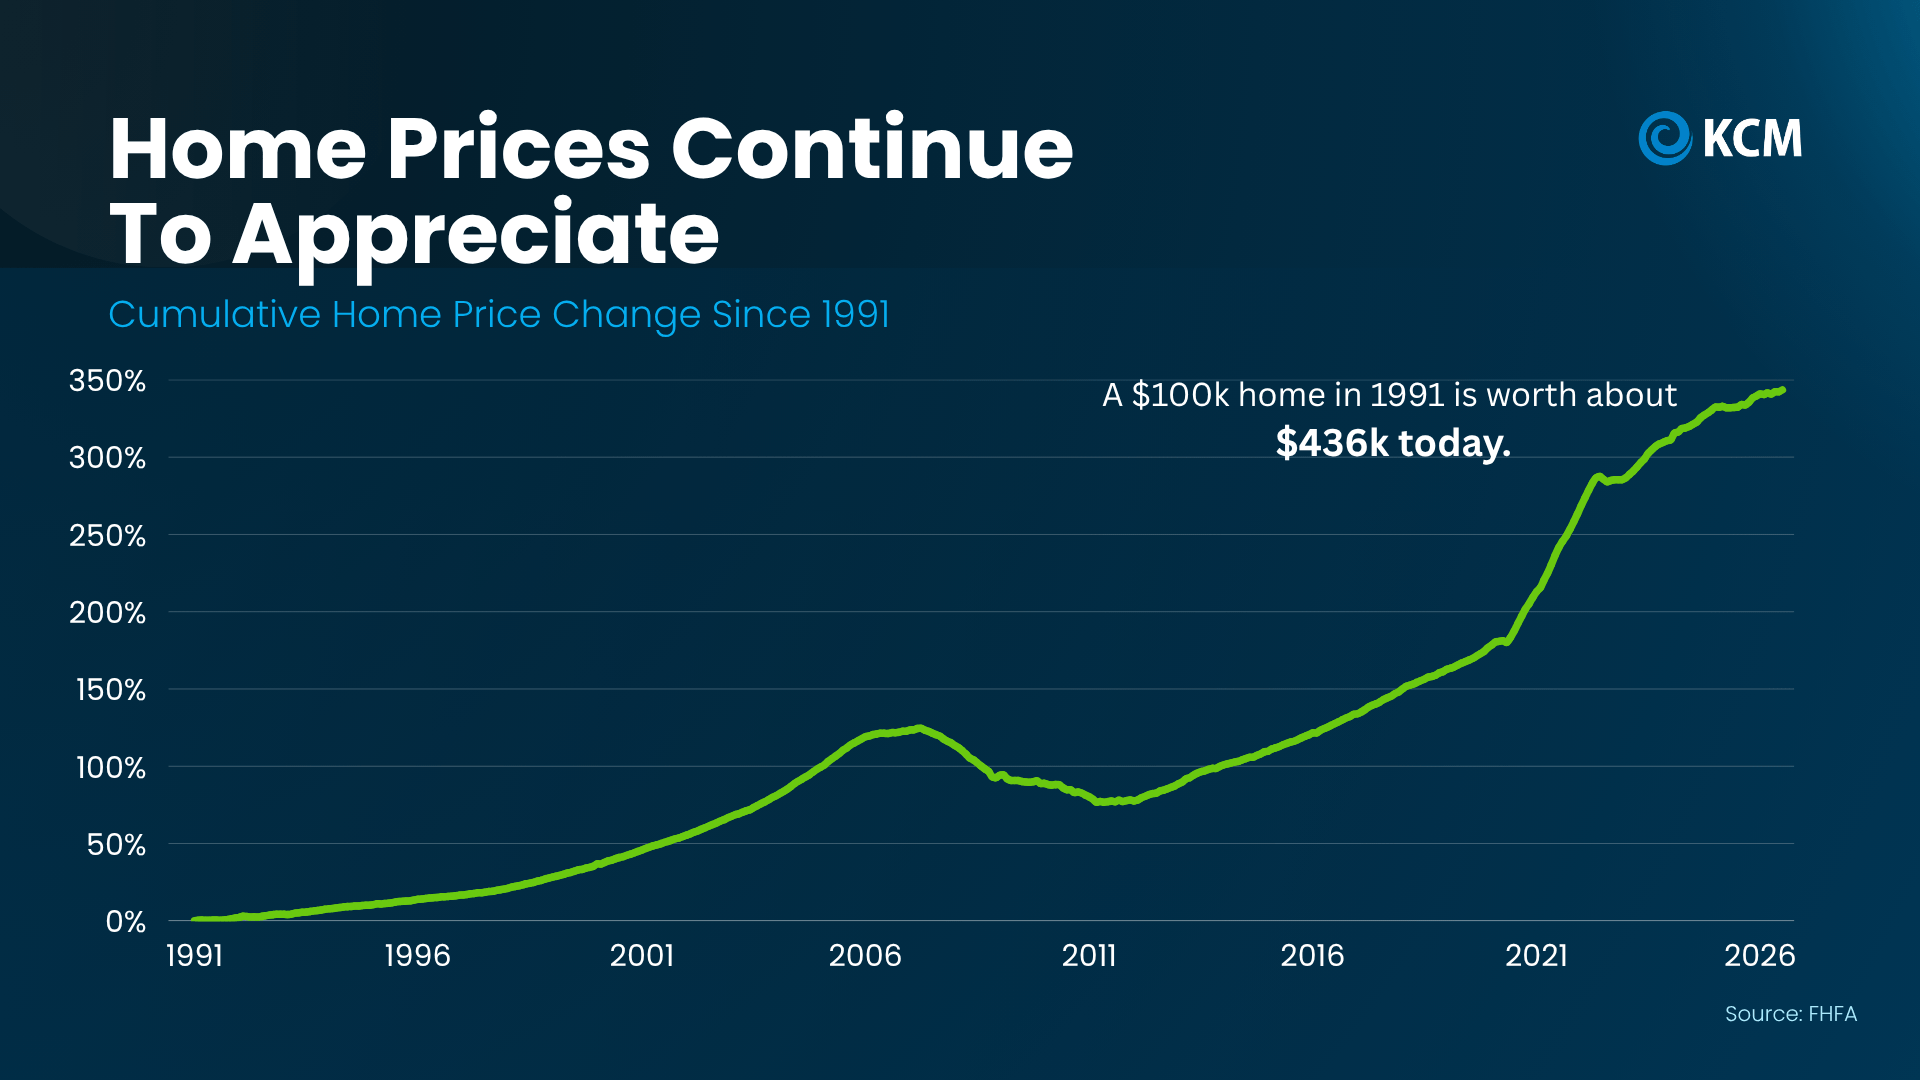
So, this short-term dip probably won’t stick around. The small declines we’re seeing now are in markets that overheated during the pandemic. As a whole, the market is headed back to normal – and normal means prices should rise over time.
Bottom Line
National headlines can’t tell you what your home is worth or how much room you have to negotiate. Local data can. If you’re thinking about buying or selling, connect with a local real estate agent to look at how prices are moving in your area, so you can set your price or make your offer with confidence.
When you picture buying your first home, chances are you’re imagining a traditional single-family house with its own yard, maybe a garage, and little extra room to grow. But with affordability still tight, getting everything on that list right away may come with a higher price tag than you’re comfortable with right now.
So, if you’re running the numbers and buying a house like that feels like a stretch, there may be another way in. A condo.
Because in a lot of markets, condos come with a significantly lower price tag. And that could make them a smart way to get your foot in the door.
Condos Can Cost Less Than You Think
According to a recent study by Zillow:
“Condos are the most commonly affordable home type in virtually every metro. At the starter level, the savings can be pretty significant. Nationally, starter condos average $197,468 — that’s about 6% less than the typical starter home.”
And depending on where you live, the difference can be much bigger.
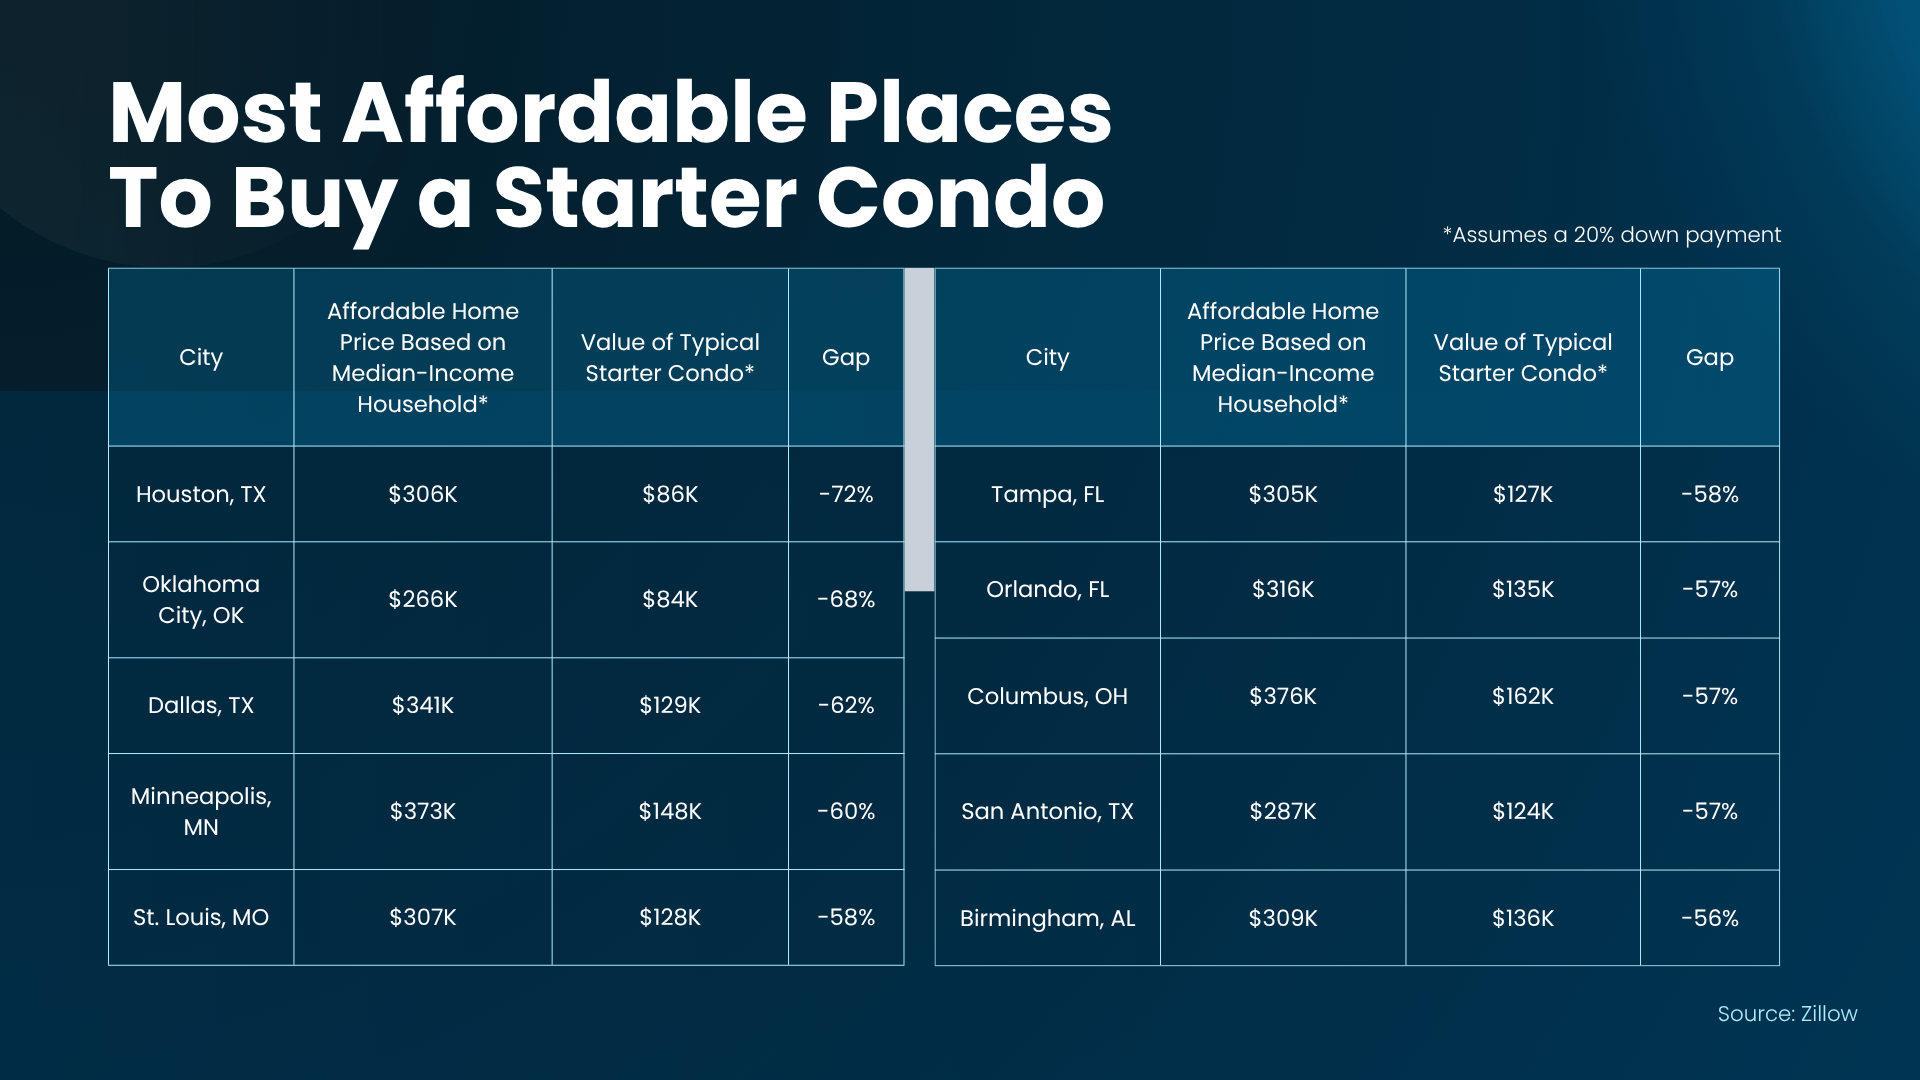
Zillow identified metro areas where typical starter condos are priced significantly below the estimated home price a median-income household could afford. Here are the top 10 according to that research (see chart below).
In Houston, the gap is at its widest. There, a typical starter condo was valued at about $85,600 – 72% below the price considered affordable based on the area’s median household income.
Of course, every market is different. But the bigger point is this: if you’ve only been searching for traditional single-family houses, you may be overlooking some of the more affordable options on the market.
And even if your city didn’t make this list, that’s okay. The trend holds true in many places across the country. Here’s why.
A Condo Could Give You a Different Way In
Part of the reason condos can cost less is pretty straightforward. They’re typically smaller. And less square footage can mean a lower purchase price.
So, if you can make do with a bit less space or you’re coming from a smaller apartment now, this can be a great way in. Plus, on the upside, you won’t have to buy a ton of furniture to fill out a bigger house. You can get a potentially lower price up front and spend less once you move in because you’ll need less new stuff to fill that empty space.
And more buyers are making that trade off on space to offset the current affordability challenges. Ali Wolf, Chief Economist for New Home Source, explains:
“In addition to favoring smaller floor plans, more consumers are showing a willingness to live in an attached home. This shift is not driven by a preference for shared walls, but by a pursuit of value.”
That’s really the heart of it. Looking at condos isn’t necessarily about wanting less. It’s about finding another way to make your move happen with the budget you have.
Don’t Rule Out an Option That Could Work
If you’ve been struggling to find a house you like at a price you can comfortably afford, talk to your agent about adding condos to your search.
You may find something in a neighborhood you thought was outside your budget. You could get access to amenities you wouldn’t otherwise have. And you may be able to become a homeowner sooner rather than waiting for the numbers on a single-family house to work.
While there are trade-offs like shared walls, less outdoor space, and an HOA fee to factor into your monthly budget, maybe that’s worth it if you finally get your own set of keys.
Plus, a lot of the times, a condo community comes with great amenities like pools, gyms, and the condo association handles at least some of the maintenance. Which is closer to what you’re used to from your apartment – it could make the transition to homeowner not just more affordable, but that much easier too.
Bottom Line
The first home you buy doesn’t have to be a single-family house. If affordability has been holding you back, talk to a local agent about expanding your search and see whether a condo could fit the price point you’re looking for.
Mortgage rates being back above 7% isn’t exactly the news most people wanted. But it’s changing the market in ways that matter whether you’re buying or selling.
The number of homes for sale is growing faster than it was this time last year. And interestingly, the main reason isn’t a flood of new listings. It’s because homes aren’t selling as quickly.
Here’s why – and what that means if you’re thinking about buying or selling.
Inventory Growth Is Picking Up Steam
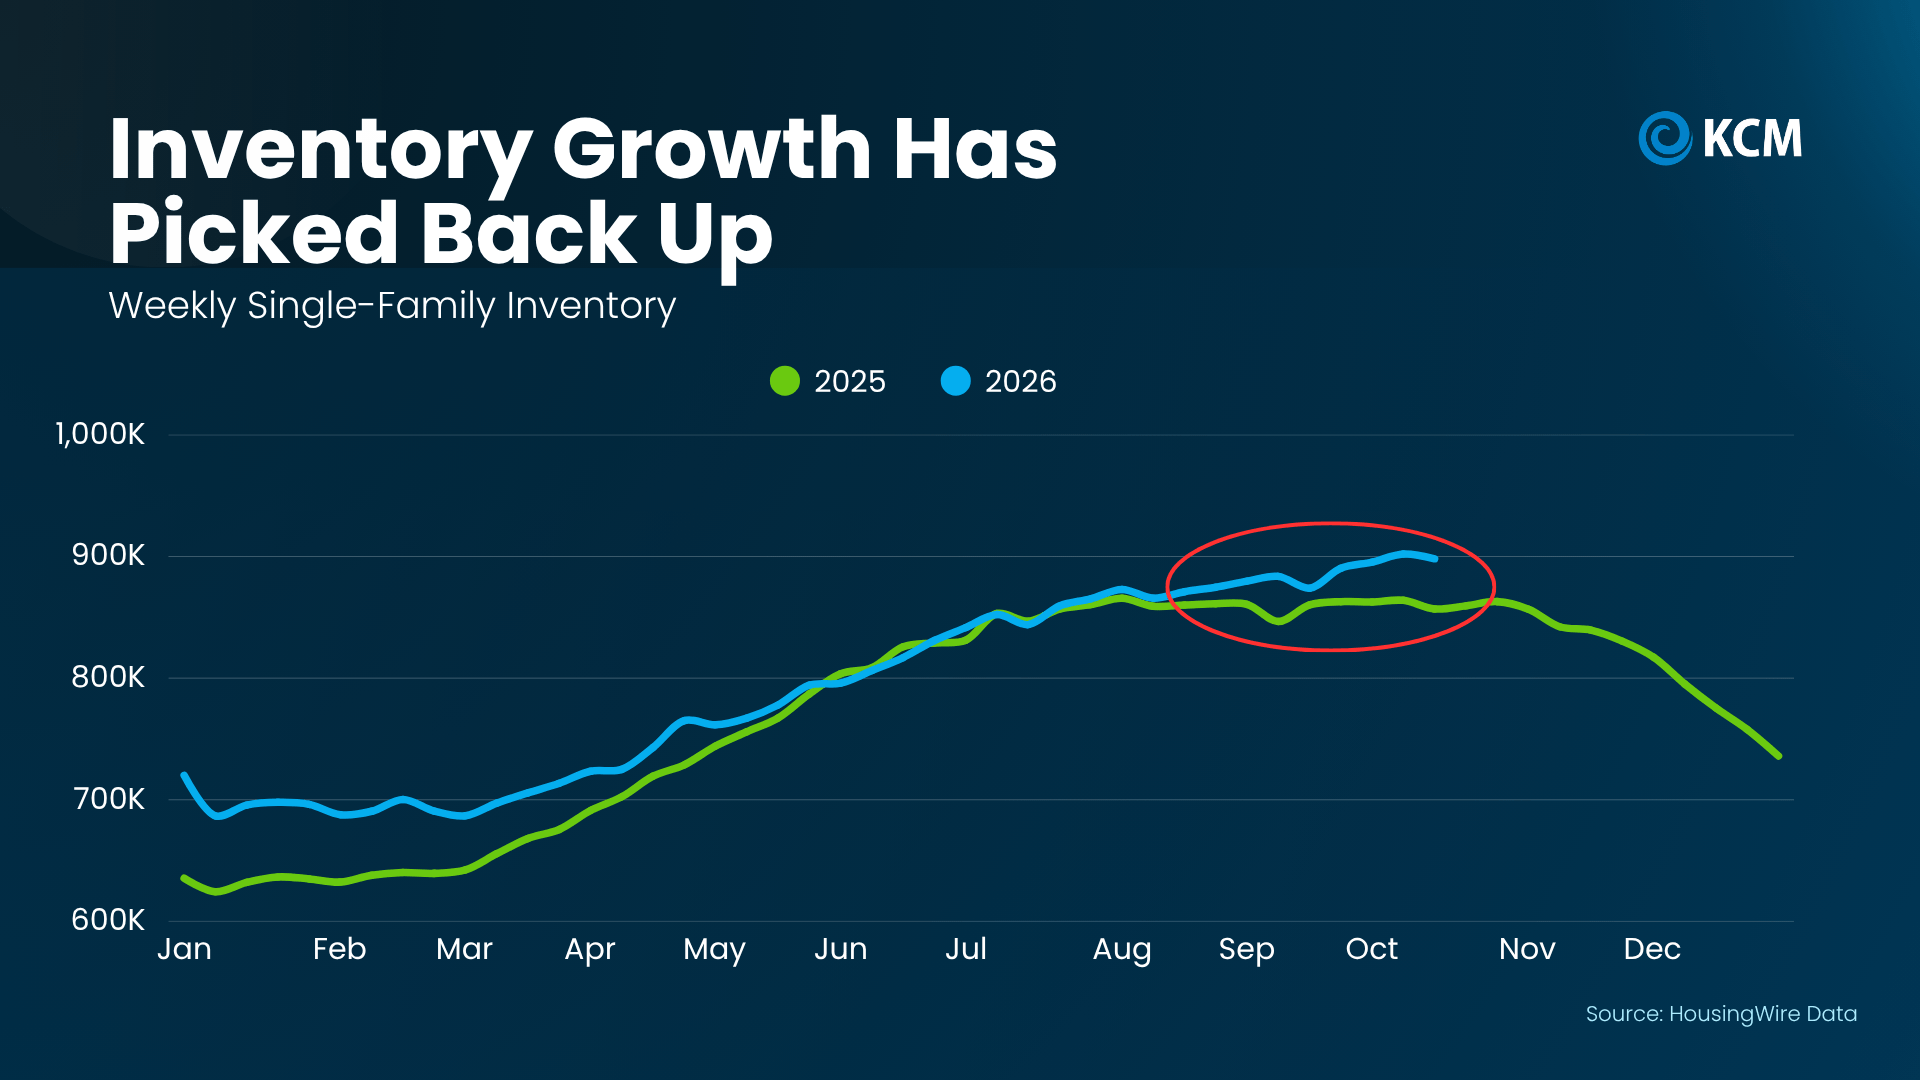
According to HousingWire Data, after inventory growth slowed down for most of the past year, it’s accelerated again in recent weeks. You can see that in the graph below. Just look at the blue line:
And what’s behind this shift might surprise you.
When rates rise, some buyers hit pause. That means fewer homes sell each week. And as those unsold homes stay on the market alongside new listings, the number available starts to grow (see the blue line in the graph below).
Here’s another way to look at it to make it even more obvious. The graph below shows the relationship between rates and inventory. Again, this year is the blue line. Last year? That’s the green.
With rates inching up this year, you can see inventory has grown by about 25k. But when rates went down this time last year, buyers jumped back in, and inventory actually dropped by about 9k.
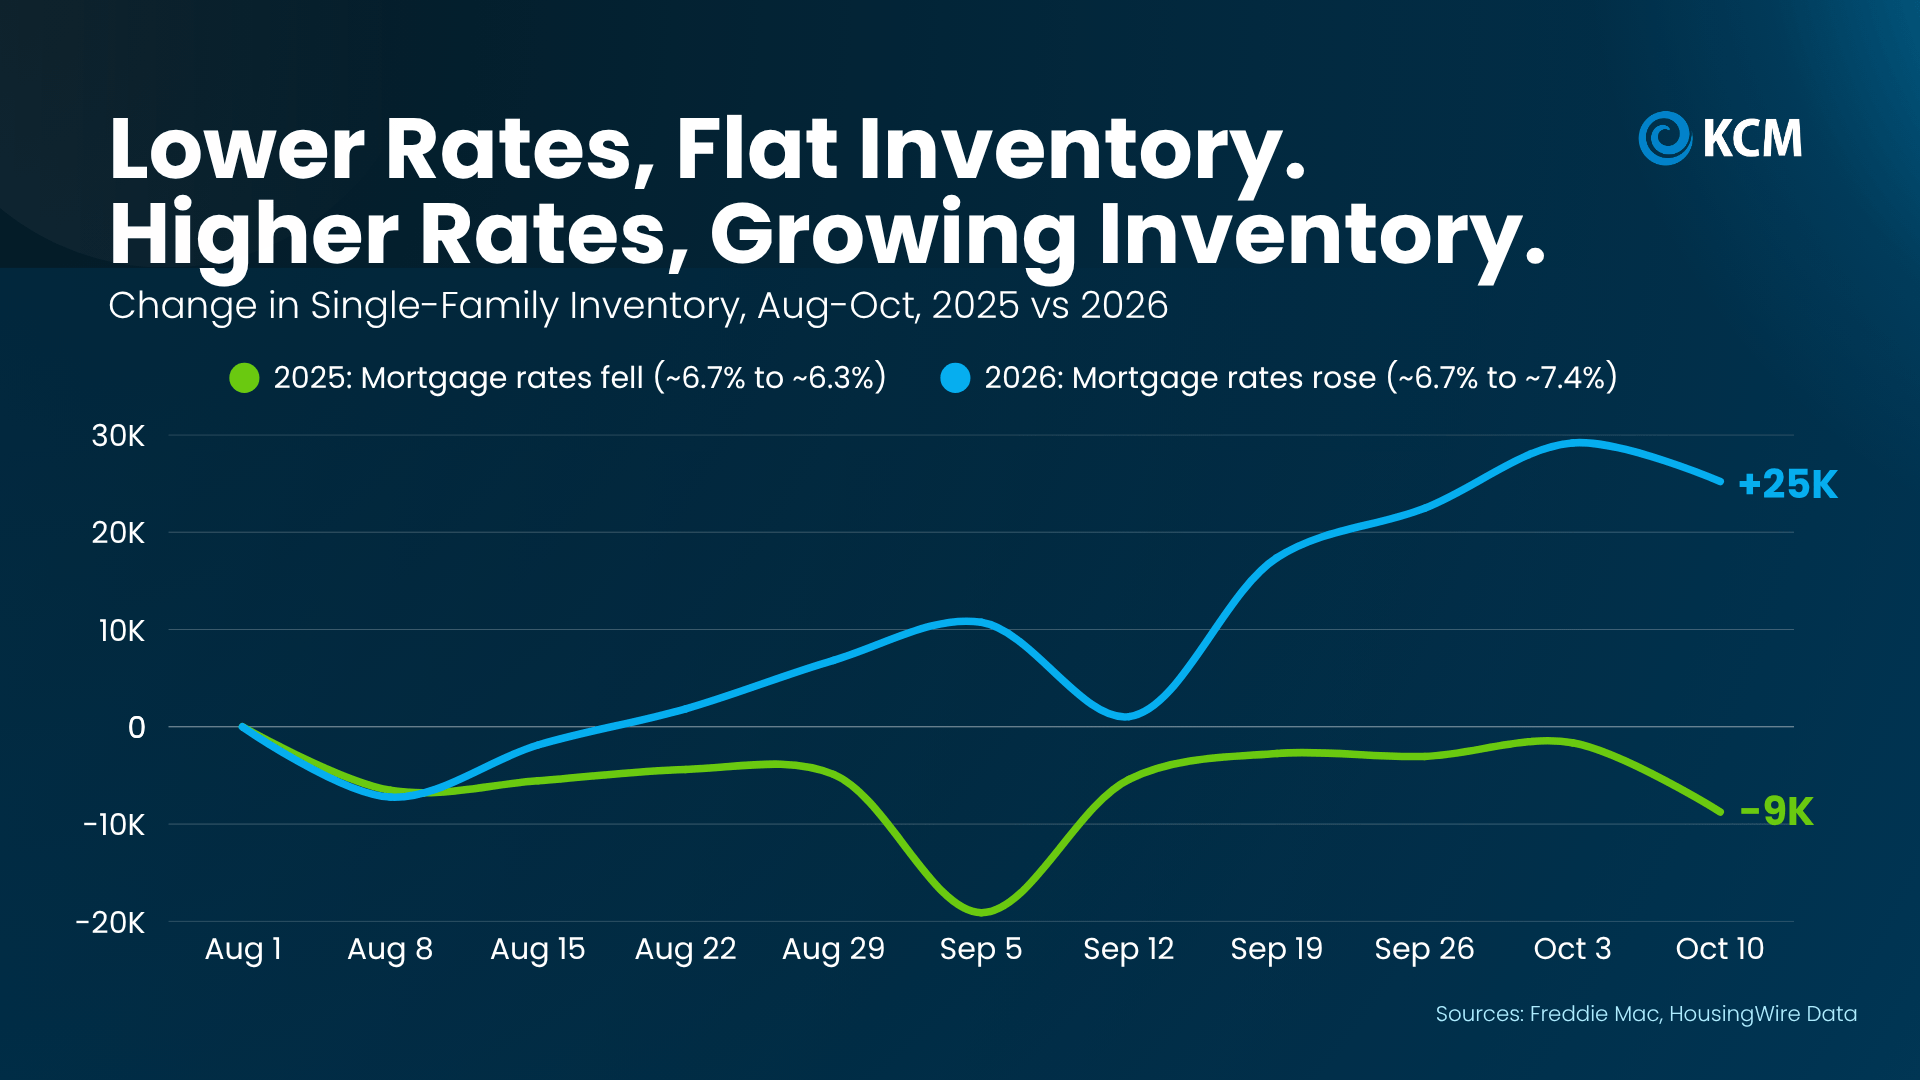
Logan Mohtashami, Lead Analyst at HousingWire, explains how that’s flipped from 2025 to 2026:
“With mortgage rates over 7%, demand tends to soften and inventory rises . . .”
Homes Are Spending More Time on the Market
Here’s another metric that shows the impact rates are having: time on market. Data from Realtor.com shows the typical home spent 61 days on the market this September. Back in September 2021, it was just 41 days (see graph below):
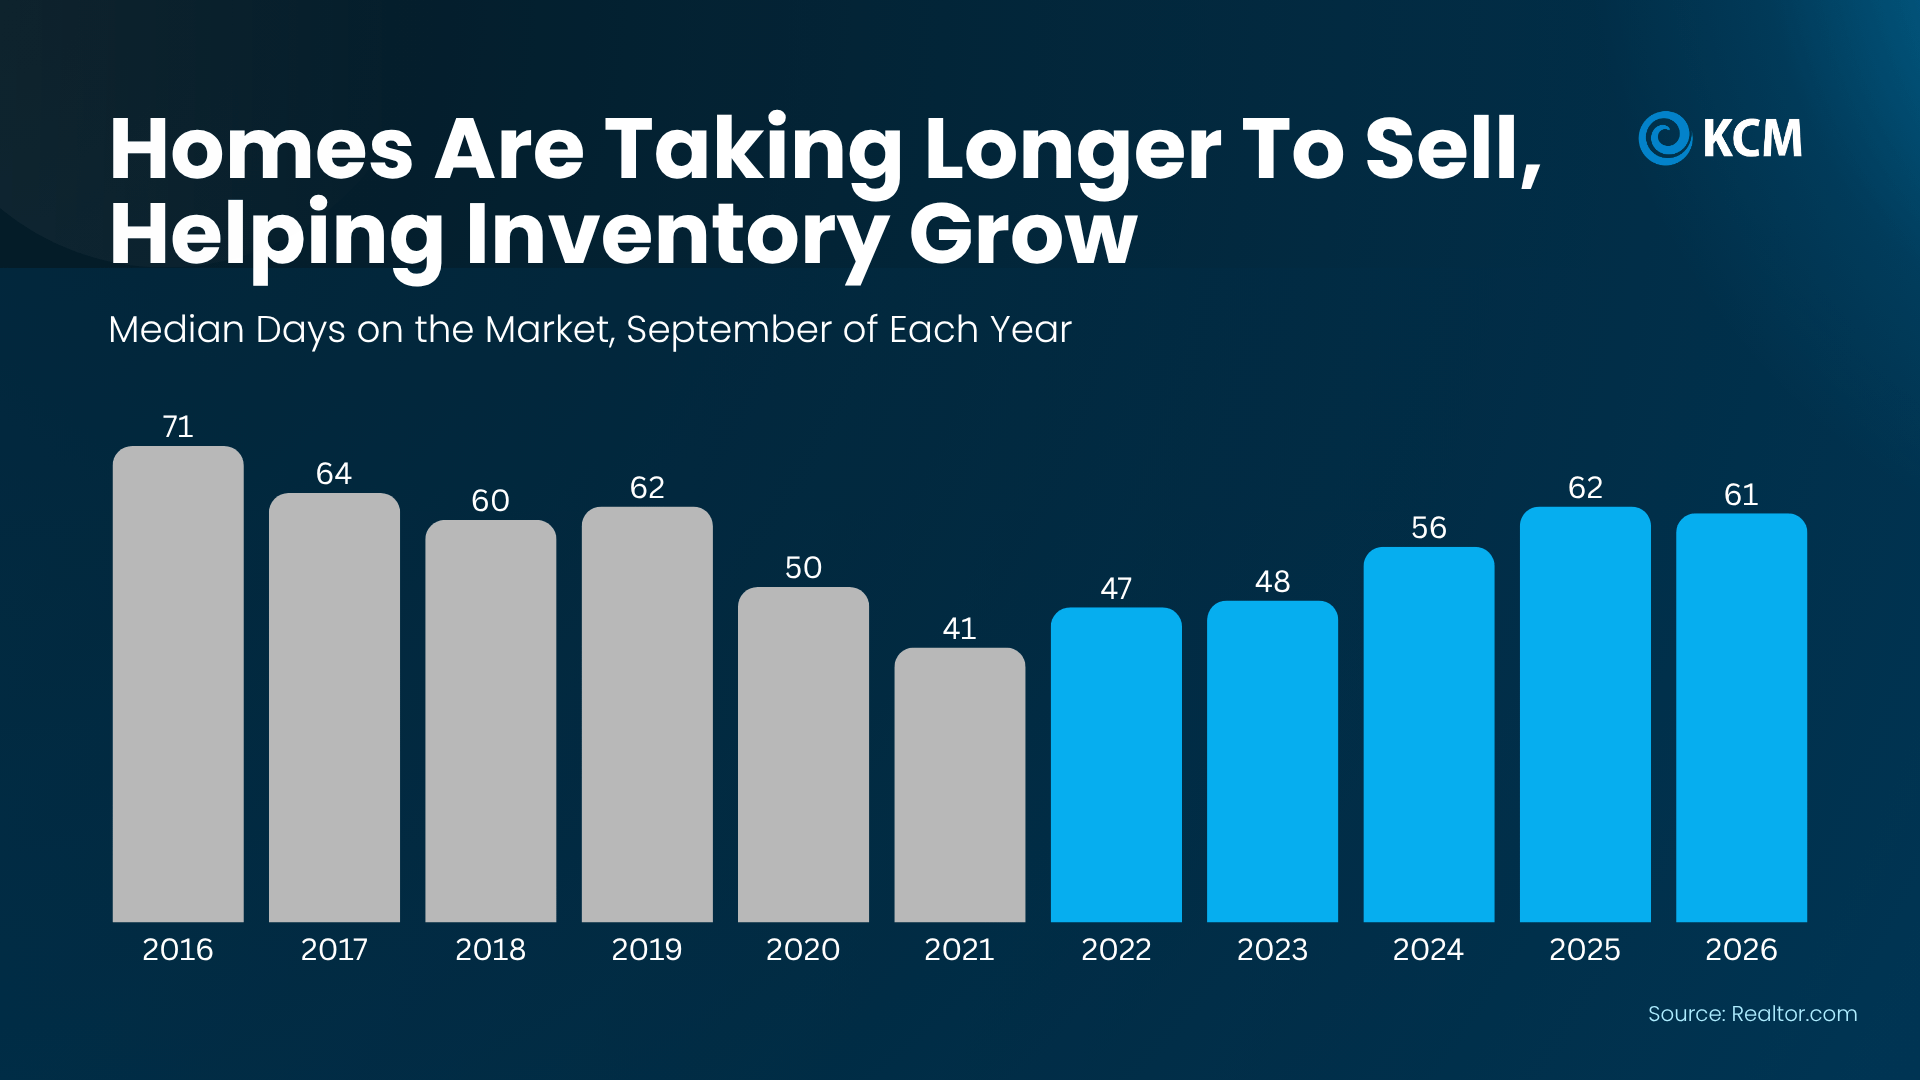
Here’s what that tells us. In 2021, when rates were low, more buyers were active, and homes sold fast. But now that rates are a bit higher, not as many buyers are interested, so it takes a bit longer to close a deal.
How To Make This Market Work for You
So, what does all of this mean for your plans? That depends on which side of the move you’re on:
If you’re buying, more homes for sale means more choices and less pressure to rush. And more room to negotiate too. A house that’s been sitting for a while could have a seller who’s more willing to talk – not just about price, but repairs, closing costs, or even helping buy down your mortgage rate.
That doesn’t mean every seller will play ball. But compared to the frenzy of a few years ago, buyers have more leverage now.
If you’re selling, the right strategy can make all the difference. Buyers have more homes to choose from, so making yours stand out is especially important. That starts with pricing it right from day one, making a great first impression, and working with your agent to highlight what makes your house worth choosing. Buyers are still buying and homes are still selling. The key is making sure yours is positioned to attract the right buyer.
The market hasn’t stopped. It’s just moving at a different pace. And whether you’re buying or selling, your strategy needs to move with it.
Bottom Line
In many places right now, inventory is growing and homes are taking a bit longer to sell. And that’s information that should shape the strategy you use going in.
Whether you’re buying or selling, connect with a local real estate agent to look at how long homes are taking to sell in your neighborhood, so your offer, or your price, fits today’s market.

To Sell or Rent? How To Choose the Best Path for Your House.

Confused by Home Price Headlines? Here’s Why.

Want a More Affordable Home? Don’t Overlook Condos.



-

 Buying Tips3 weeks ago
Hoping for (or Dreading) a Housing Crash? The Experts Just Weighed In.
-

 Agent Value4 weeks ago
There Are 4 Types of Housing Markets Right Now. Which 1 Are You In?
-

 For Sellers3 weeks ago
What Higher Mortgage Rates Mean for Home Sellers
-

 Affordability4 weeks ago
Why So Many Sellers Are Cutting Their Price Right Now
-

 Affordability3 weeks ago
The Mortgage Rate You See Online Isn’t Necessarily the One You’d Get.
-

 Affordability2 weeks ago
Myth vs. Reality: Does the Fed Control Mortgage Rates?
-

 Affordability2 weeks ago
Two Moves That Can Get You Into Your First Home Sooner
-

 Downsize2 weeks ago
Renovate or Relocate? What To Know Before You Decide To Age in Place
You must be logged in to post a comment Login