


Buying Tips
Home Price Growth Slowed Down. That May Be Changing.

After more than a year of headlines talking about how home prices are going to crash, the latest data shows that price growth may be starting to pick back up again. And depending on whether you’re buying or selling, that shift means something different for you.
The Numbers May Be Starting To Turn
For the past couple of years, home price growth has been moderating – cooling from around 7% in mid-2024, according to Redfin (see graph below). But look at the right side of that graph. The pace of that growth appears to have hit its low point and started to turn.
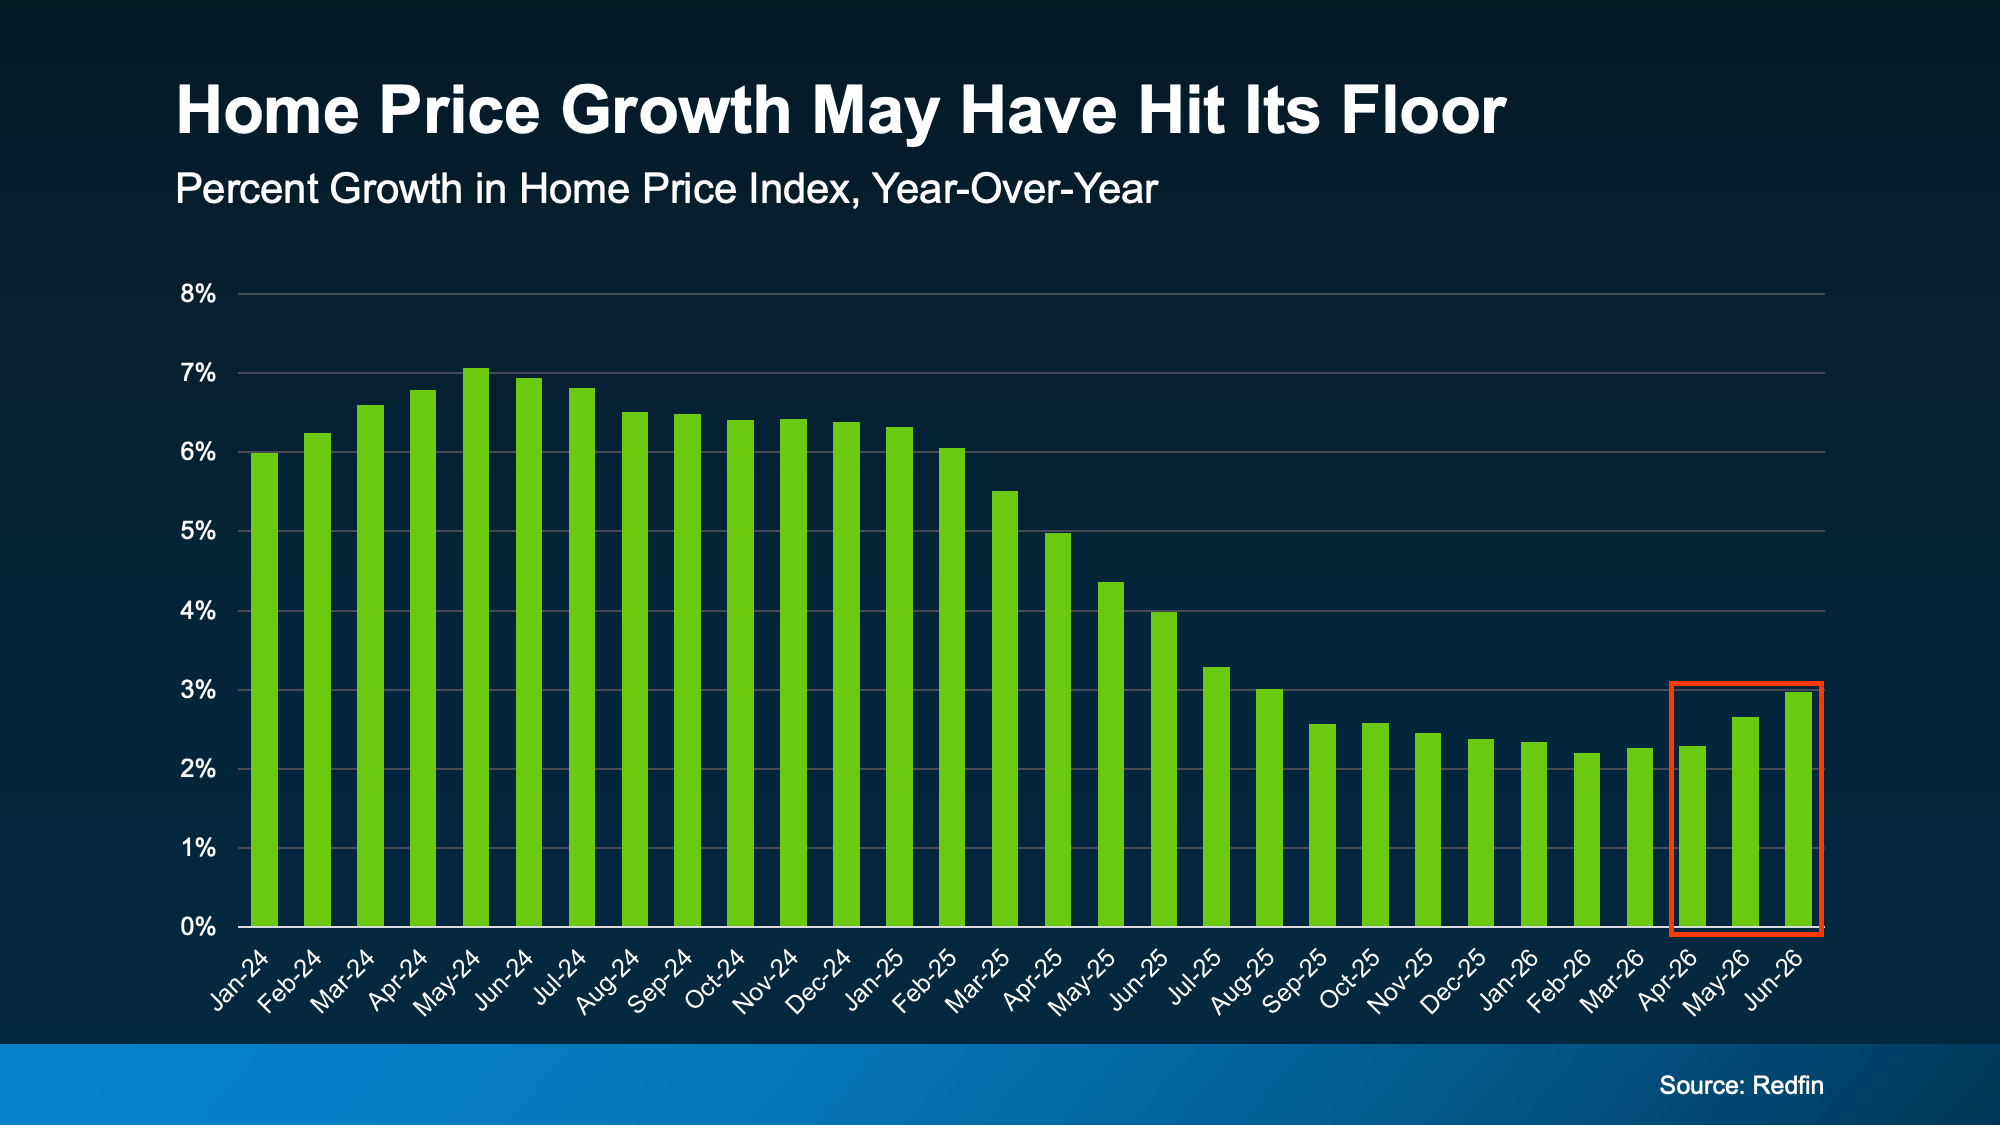
While a couple months of data doesn’t necessarily mean this will be a lasting trend, there are some other signs that this could continue.
For example, fewer markets are seeing prices decline. According to ResiClub and Zillow, about 36% of the 300 largest housing markets had falling prices as of the middle of last year. Since the start of this year, that share has been shrinking. Now? Only 23% are experiencing those mild dips (see graph below):
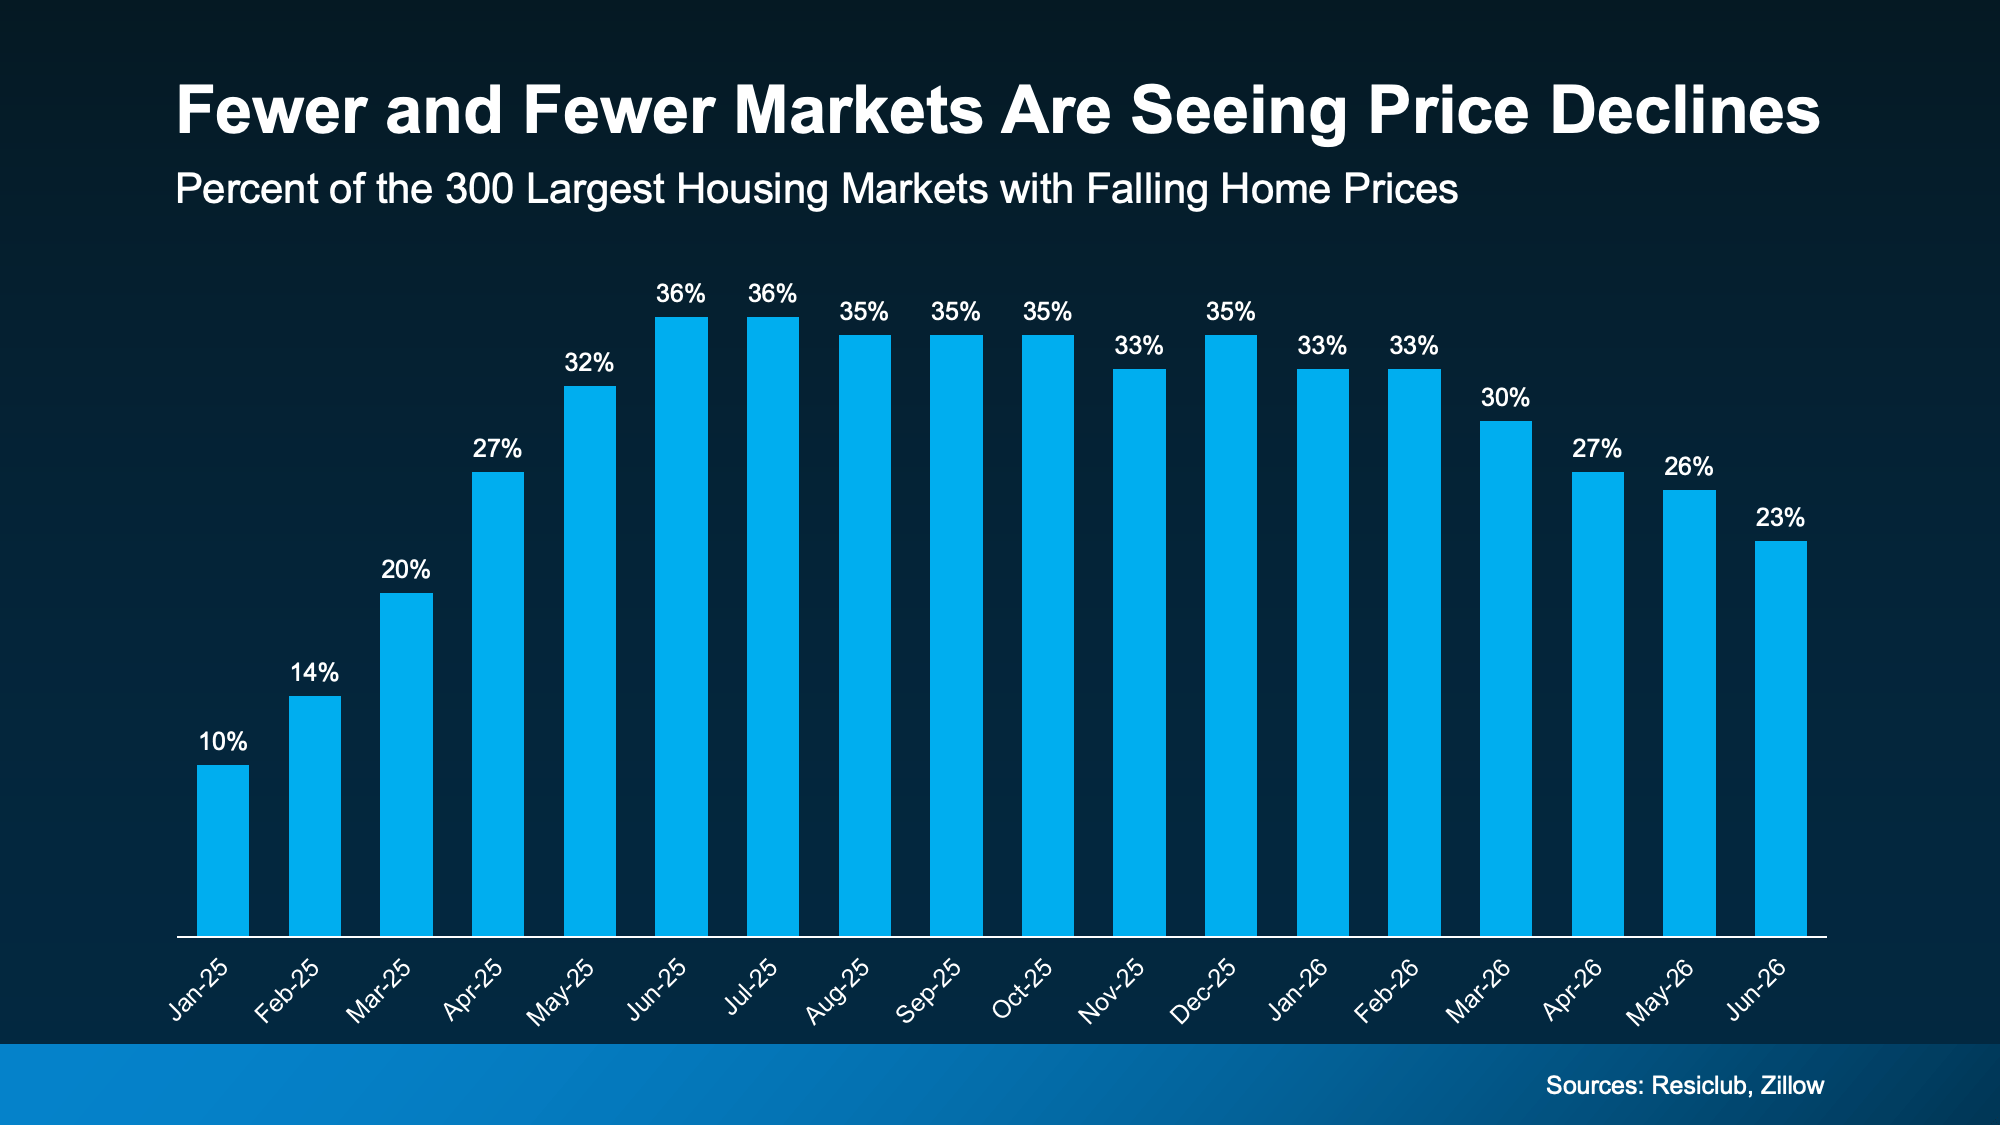
When fewer markets see prices falling, that means more markets are seeing prices rise again.
And forecasts suggest this shift has room to run. On average, experts project home prices will rise about 2.3% nationally this year. And for that to happen, price growth would have to pick up a bit in the second half of 2026.
But Remember, Real Estate Is Local
While it looks like national prices may be starting to pick back up a tiny bit, that doesn’t mean that’s what’s happening in your neighborhood.
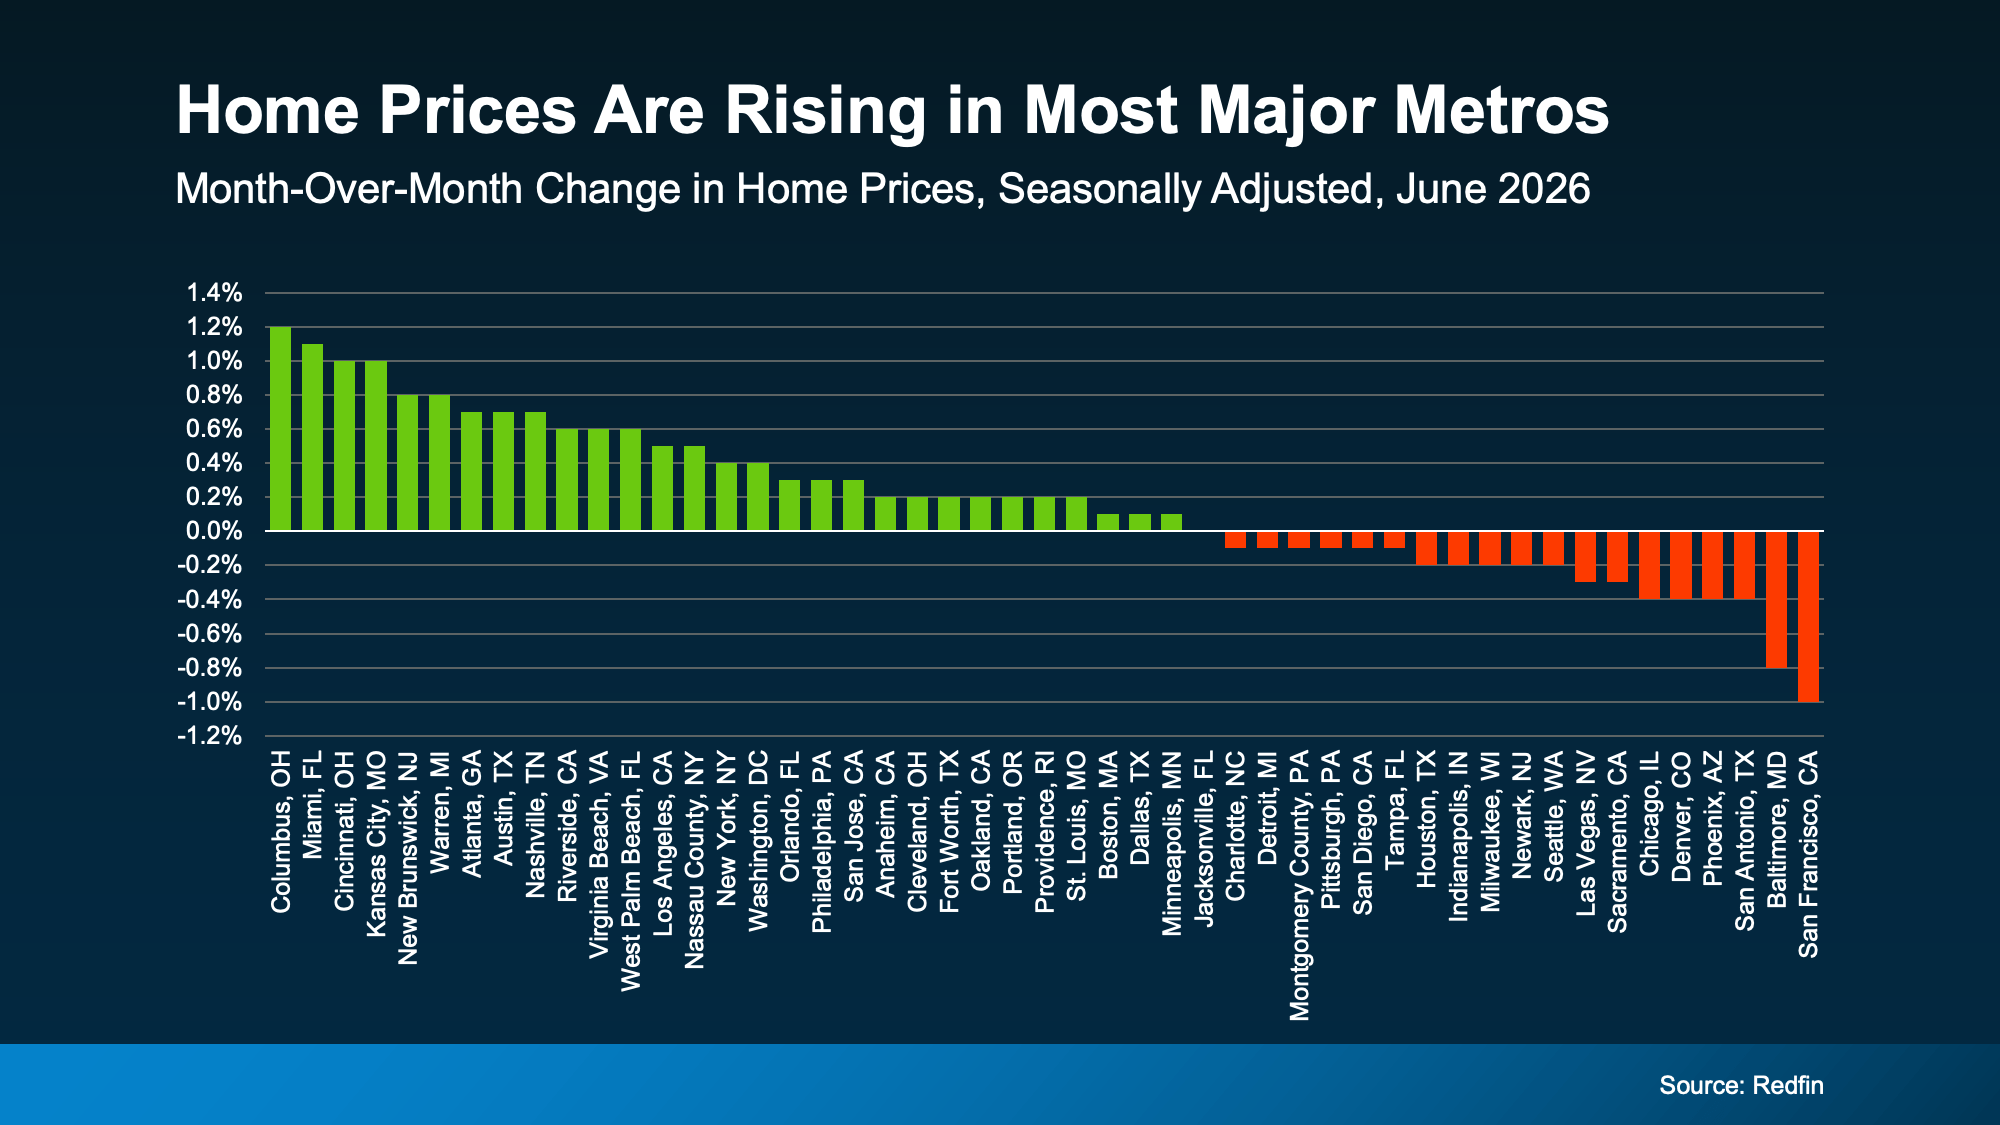
National home prices are really just an average of hundreds of local markets. Some are climbing faster. Others are still cooling. But one reason the national average may be looking up is because a growing number of metros may actually be net positive for prices this year.
Not long ago, the major metros were split about 50/50 – half seeing prices rise and half seeing them fall. Now, that balance looks like it’s starting to tip in a more positive direction. Just last month, more than half of the major metros saw prices go up, according to Redfin (see graph below):
As Selma Hepp, Chief Economist at Cotality, explains:
“. . . local markets continue to tell very different stories. Annual home price growth has changed little since the start of the year, but some markets, especially those supported by strong job and income growth in the West and more affordable Midwest markets, have seen notable acceleration in price gains.”
What This Means for You
Home price headlines can be confusing because they don’t always tell the full picture. Lean on an agent to understand what’s happening in your local market and what the early signs say for where prices may go from here.
That’s the best way to stay one step ahead of the market.
If you’re buying: slower price growth has worked in your favor. You’ve had more room to negotiate and a budget you could plan around. If price growth is picking up in your area, buying now may mean paying less than you would later this year.
If you own a home: you’ve been gaining equity all along, even while growth moderated. If growth keeps picking up, those gains could speed up, too. Lawrence Yun, Chief Economist at the National Association of Realtors (NAR), projects the typical homeowner will gain roughly $16,000 in housing wealth this year. And if you’re thinking about selling, this shift is a good early sign for you. Just remember, the market is still pretty balanced and buyer-friendly in a lot of areas right now.
Home price growth slowed way down, and now it’s showing early signs of picking back up. Whether you’re buying or selling, let’s connect so you can see exactly what prices are doing in our local market and what that means for your plans.
Bottom Line
Home price growth slowed way down, and now it’s showing early signs of picking back up. Whether you’re buying or selling, connect with a local real estate agent so you can see exactly what prices are doing in your local market and what that means for your plans.
For a lot of first-time buyers, owning a home can feel perpetually a few years out of reach. Saving for a down payment takes time, and each year you spend renting can make owning feel further off.
But buying your first home doesn’t have to happen to feel like a far away goal. Two choices you control can bring your first home years closer, even with affordability as tight as it is right now.
How Long Buying Really Takes
First, one quick definition. “Breaking even” is the point where owning has cost you about the same as renting would have over the same period. And after that point, owning starts to cost less than renting. Kara Ng, Senior Economist at Zillow, puts it this way:
“Buyers should think about not just when they can afford to buy, but how long they’d need to stay before owning makes more financial sense than renting.“
So how long does reaching that point usually take? And what are the shortcuts? Let’s do the math.
According to Zillow, it usually takes about 8.5 years to save for a 20% down payment, then roughly 6.2 more years before owning costs the same as renting. Together, that’s just under 15 years. But that math relies on two assumptions: that you’re buying a mid-priced home, and that you’re putting 20% down.
Change either one and your timeline gets shorter. Change both and it can shrink fast. It also varies widely by market, since local prices and rents are different depending on where you live.
A Starter Home Can Get You There Twice as Fast
A starter home usually means a home in the lower third of local prices. They’re often condos, townhomes, or single-family homes a little smaller or older than others in the area.
Choosing one over a mid-priced home can cut your wait down by a lot. And while that might sound obvious, you may not realize just how much it shortens your timeline. Because if you’re buying a more affordable home, you don’t have to save up as much or as long.
Zillow found that nationwide, a starter home takes half the time – about 7.2 years – to save for and come out ahead on, compared with renting (see graph below):
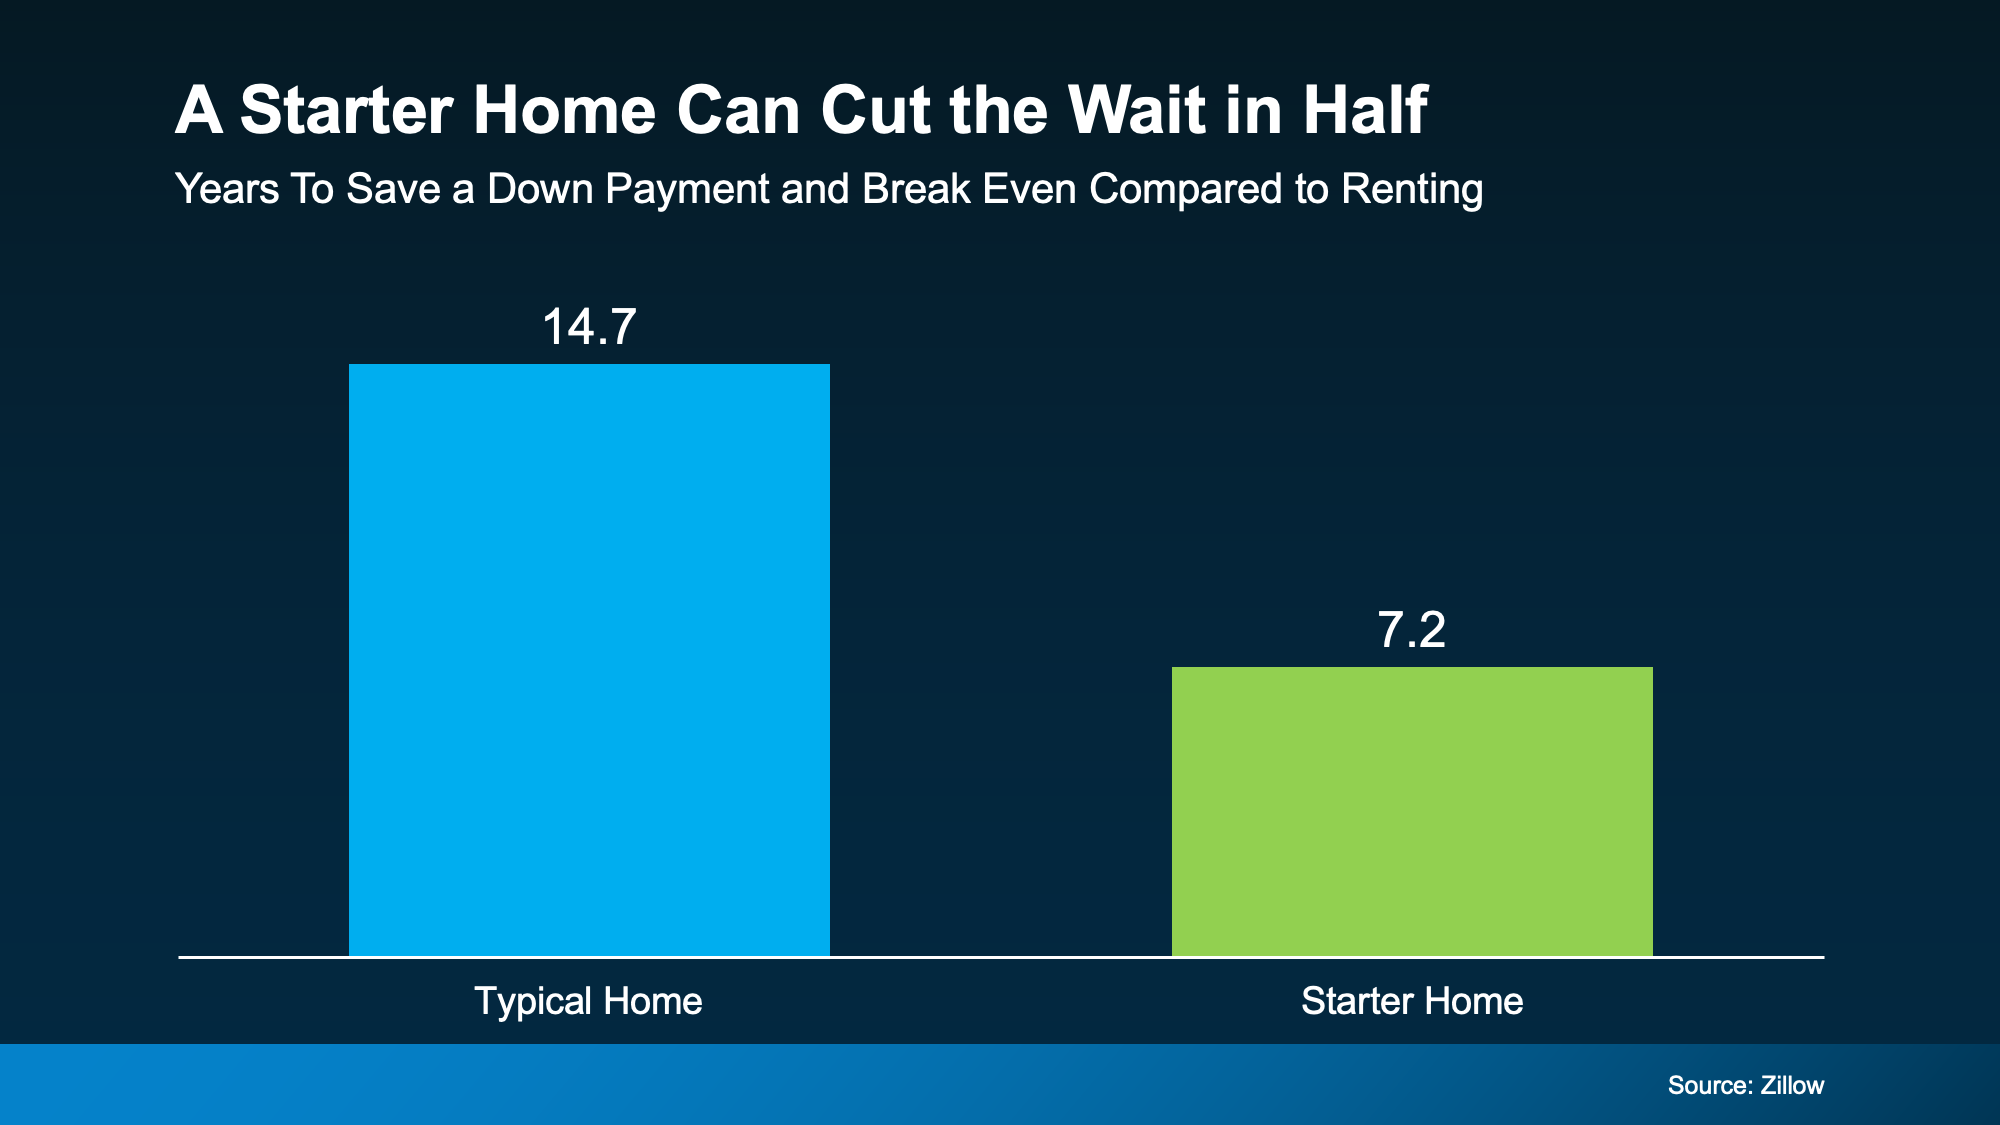
That works out to about 4.6 years to save and 2.6 years to break even. It won’t erase every affordability challenge, but it can take years off the wait. And if you’ve already been saving for a while, it could get you closer to making it a reality.
You Usually Don’t Need To Put 20% Down
You, like many first-time homebuyers, might assume you need a 20% down payment to even consider buying. But a lot of the time, you don’t.
Most first-time buyers don’t put down anywhere near that. The National Association of Realtors shows the median down payment for first-time buyers is 10% (see graph below):
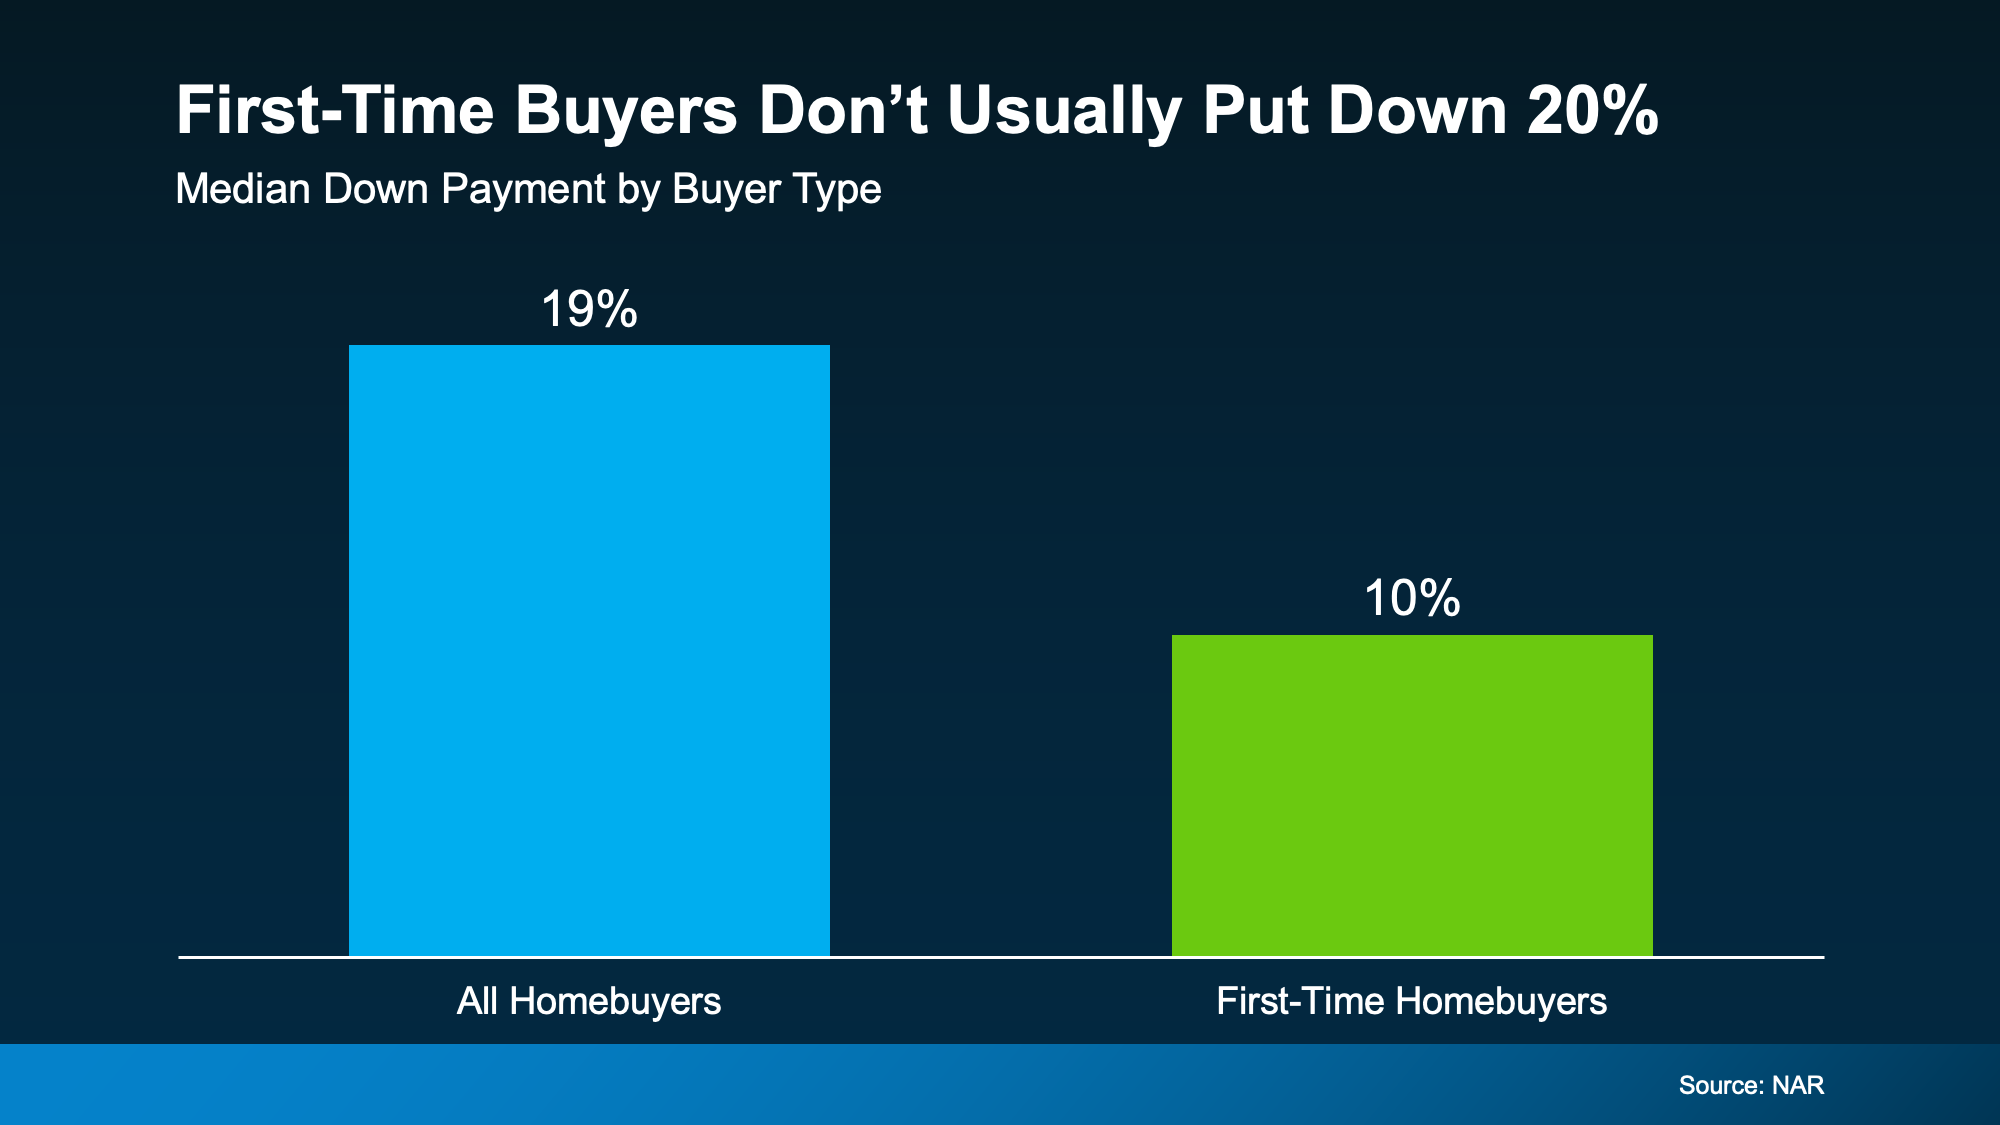
And the minimums go lower still. Some buyers put down as little as 3% on a conventional loan or 3.5% on an FHA loan, and eligible veterans or buyers in certain rural areas can put down nothing at all.
There’s help with the upfront costs of buying, too. Down Payment Resource counts 2,746 assistance programs nationwide, and some are even stackable:
“Some homebuyers can layer multiple sources of assistance to reduce their upfront costs. Layering means combining more than one eligible source of funding as part of your home purchase.”
Put those together – a lower price point, a smaller down payment, and help covering it – and the years you thought you needed start to come down.
Bottom Line
Your first home may not be as far off as it feels. When the numbers make sense for you, buying a starter home and putting down less than 20% can get you there years sooner.
Want to see which starter homes in your area could fit your budget? A local real estate agent can show you.

Half the buyers out there are scared home prices are about to crash. The other half are hoping they will.
A recent survey from Clever found 58% of Gen Z buyers are actually rooting for a crash, just so homeownership feels within reach.
So, what do the forecasts actually say?
Every quarter, Fannie Mae surveys more than 100 housing experts on where prices are headed. The newest results are in. And spoiler alert: they’re not calling for a crash – not even the pessimists.
What the Newest Numbers Actually Say
The panel’s latest forecast has prices climbing every single year through at least 2030.
The panel’s average forecast is that prices will rise by 14.7% in the next 5 years. And here’s where it gets really interesting. If you split these experts into optimists and pessimists, even the pessimists still expect prices to increase about 6.6% by the end of 2030 (see graph below):
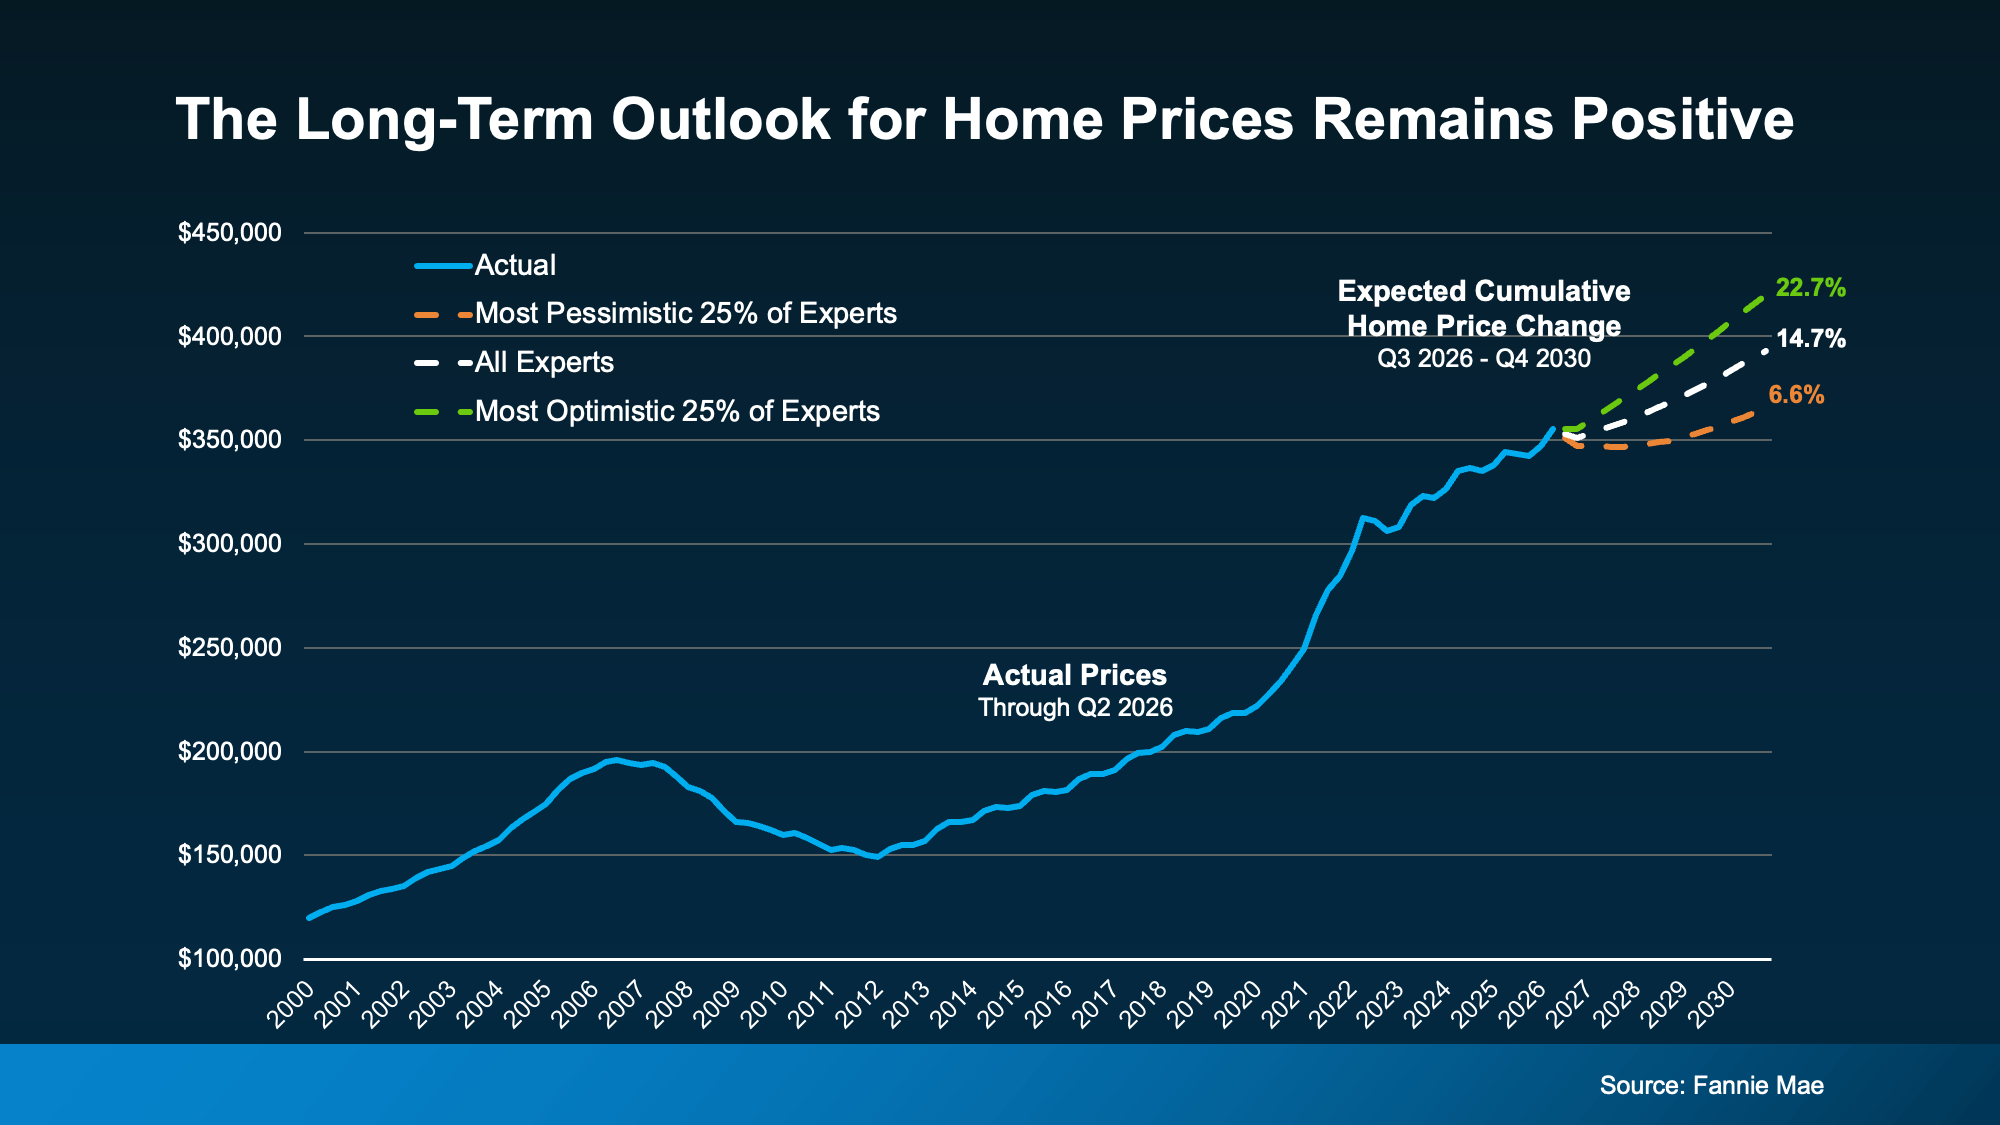
The takeaway? If you’ve been waiting for prices to fall, you may be waiting a while.
One thing to keep in mind though – these are national numbers. Prices in your area could run a little hotter or a little cooler than this, so it helps to know what’s happening locally, too. But the big picture is prices aren’t crashing. Historically prices usually rise.
How This Quarter Compares to the Past
Here’s something you probably don’t realize. This survey runs 4 times every year, so you can track the panel’s mood over time.
A year ago, the panel expected home prices to grow 2.1% this year. Now they’re forecasting 2.5%. That means the near-term outlook actually got more optimistic. But that’s only part of the story. The years after that shifted, too (see graph below):
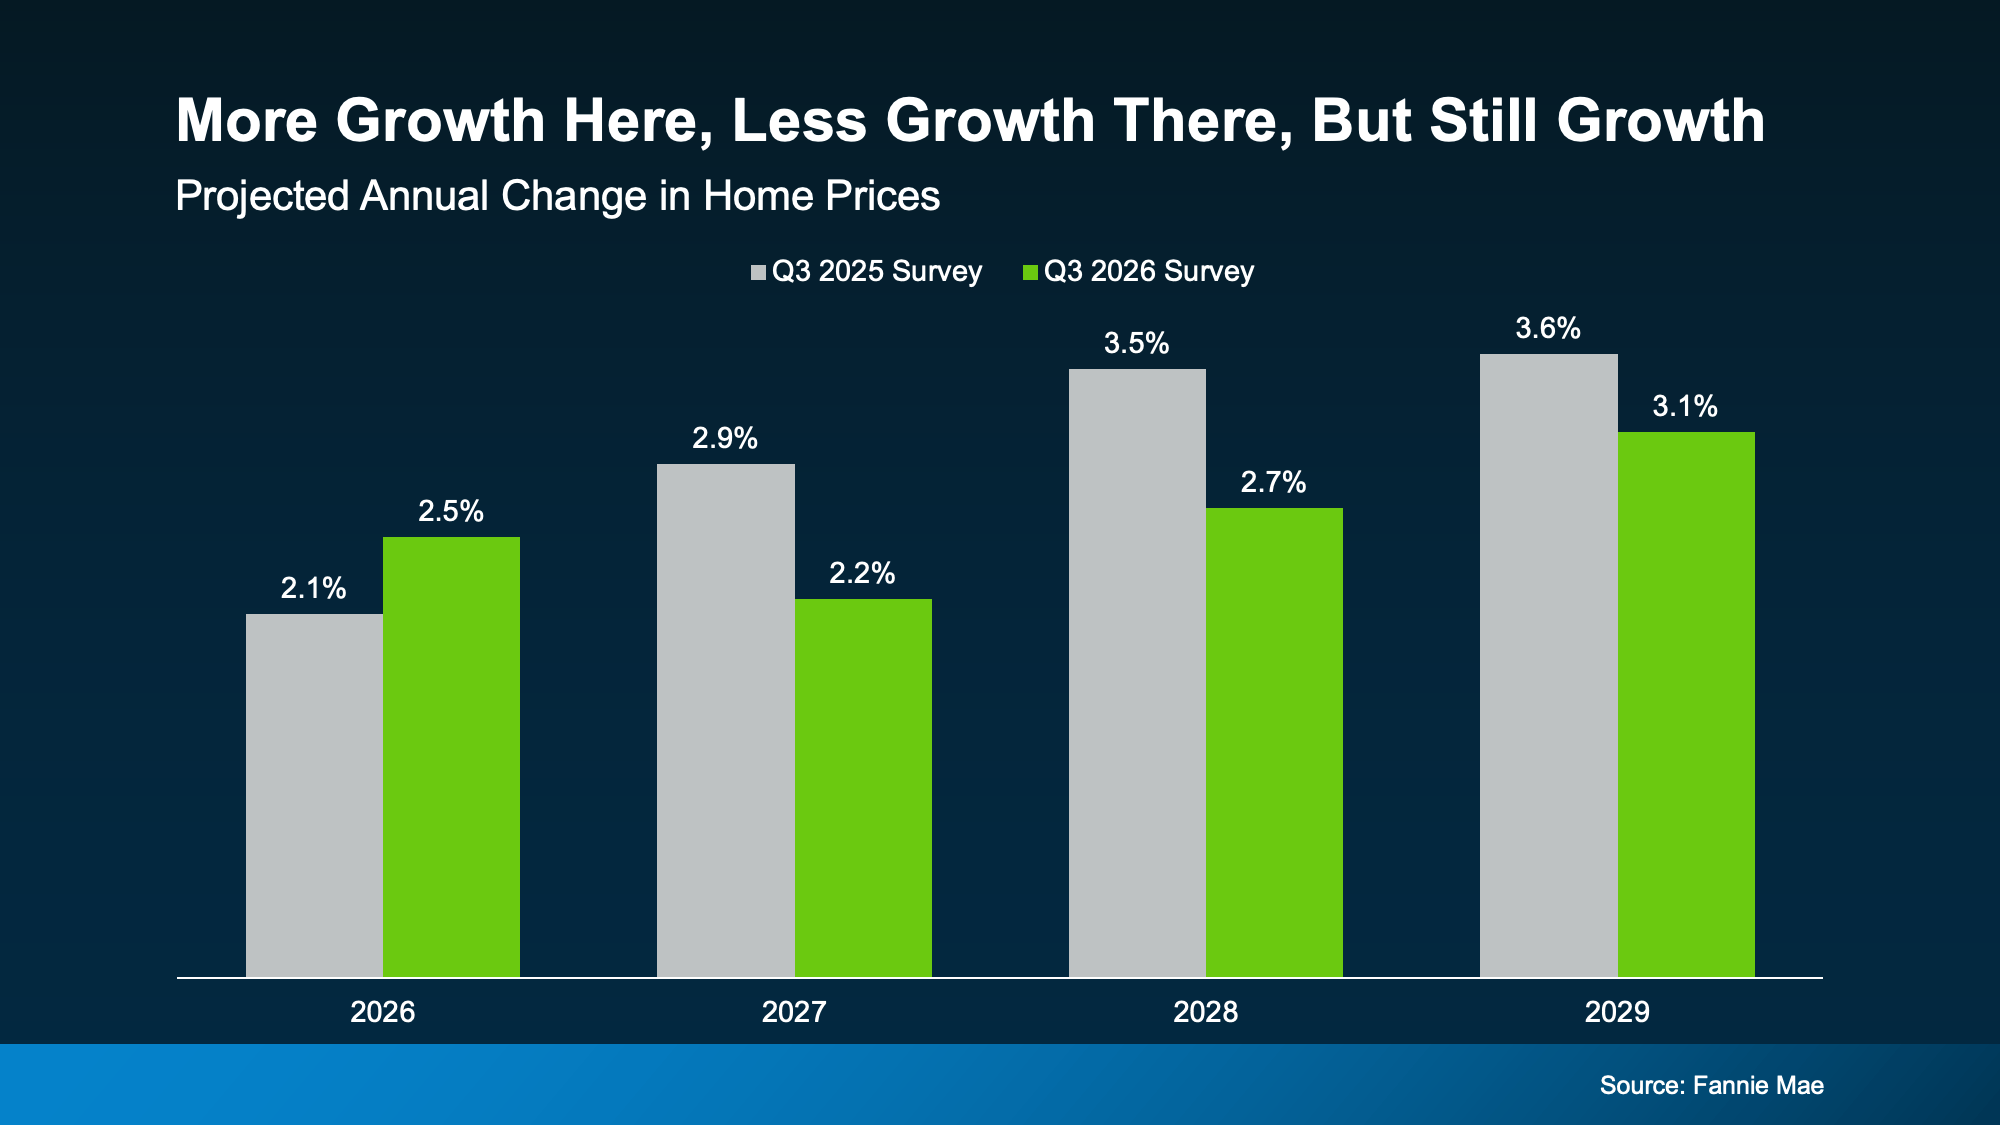
Zoom out to 2027 through 2029 and the mood has cooled a bit. Each of those years is now expected to see a little less growth than the panel thought a year ago. That’s likely a reflection of where we are right now with everything that’s impacting the housing market.
But again, the overall takeaway here is every bar shows an increase in prices – the size of that increase has just moderated due to some of the factors at play.
A slower climb isn’t a bad thing, though. It’s a sign the market is settling into a more normal pace after a few wild years.
A little more growth here, a little less growth there. What hasn’t budged once is the idea that home prices will keep growing.
What It Means for Your Next Move
Now, percentages are great, but you probably care more about the actual dollars and cents of your move, so let’s graph that out, too.
Run the numbers on a $400,000 home bought in January, and the panel’s latest forecast puts you up about $58,000 in equity in 5 years just from price growth (see graph below):
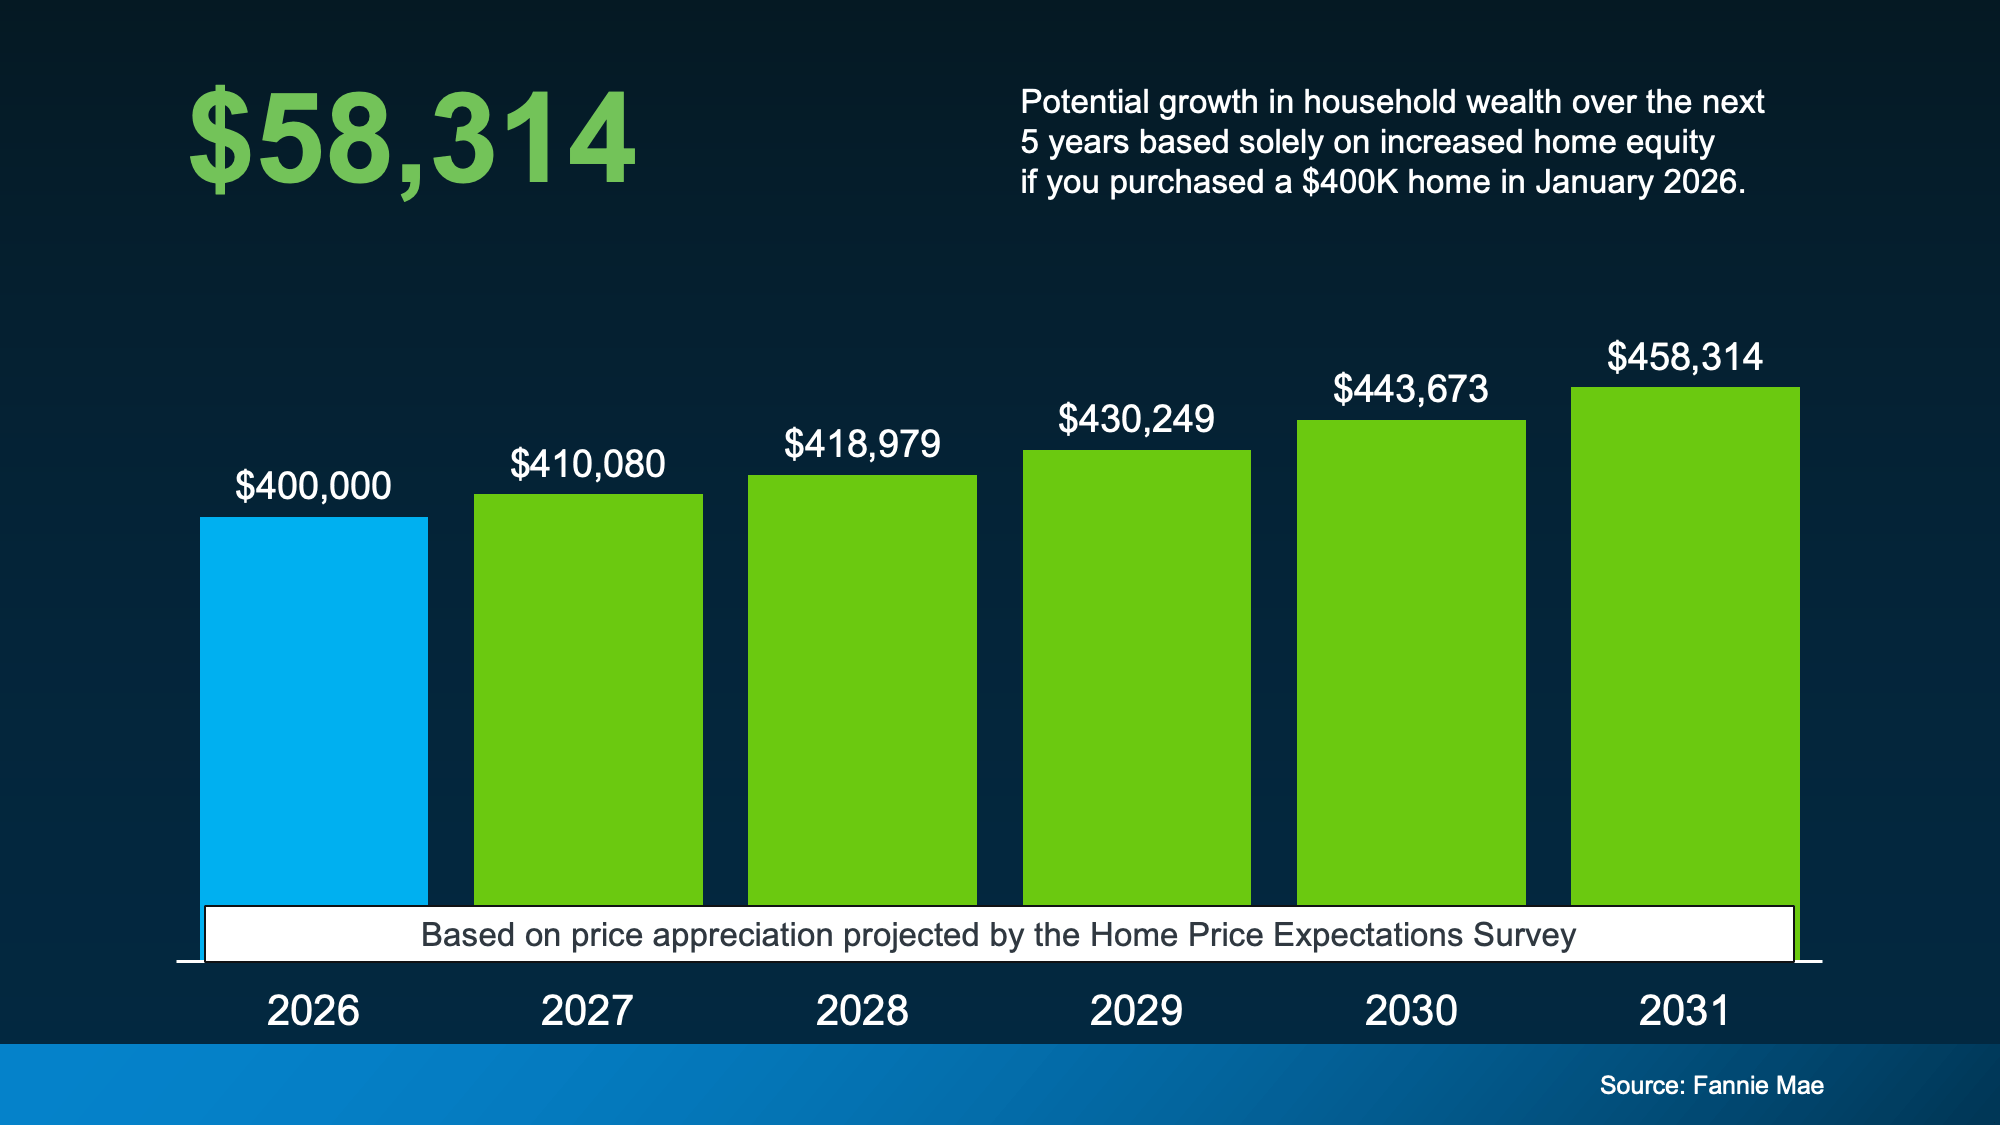
That’s real wealth you could be building while others sit on the sidelines, waiting for a crash the experts don’t see coming. And with prices expected to keep rising, waiting could mean paying more for the same home later.
Bottom Line
Whether you’re bracing for a crash or hoping for one, the verdict is the same – prices are still expected to rise, not fall. Talk with a local real estate agent about what that means for your market and your plans.

You may have seen the headlines saying mortgage rates have climbed to the highest point since January 2025. And if that’s left you reluctant to buy a home, here’s what you need to remember…
That’s not necessarily the number you’d get.
It’s a common misconception that the rate you see in the headlines is the same one you’d get when you buy. The truth is, mortgage rates shift often, and the rate you actually end up with can vary a lot from what you may see or hear about.
What Determines Your Real Rate?
Advertised rates and “real rates” aren’t always the same. That’s because real rates are based on your specific situation, which includes your overall finances and goals. The rates you see in the headlines can’t possibly reflect that.
That’s why only a lender can tell you what your real rate will be. To figure out your unique number, they’ll look at:
-
Your credit score: Your credit score includes your payment history (if you’ve made late payments – and how often), credit utilization (are your accounts maxed out, or do you have available credit?), and the length of your credit history (how long have your accounts been open?). For example, someone with an exceptional credit score may qualify for a better rate.
-
Your debt-to-income ratio (DTI): This is calculated by dividing your monthly debt payments by your monthly income before taxes to come up with a percentage. The higher your DTI, the higher your rate could be.
-
The down payment size and Loan-to-Value (LTV): Your down payment is the percentage of the home’s price you will put down. The LTV is the percentage of a home’s sales price that equals your mortgage.
-
The type and term of loan program options: Your loan officer will walk you through different loan options based on what you qualify for. Mortgage rates can vary between different loan products and programs.
Even after you find a home you love, other things can have an impact too. For example:
-
A mortgage rate buydown: This helps you get a lower mortgage rate, and by extension, a lower monthly payment, by paying an upfront cost. Sometimes a seller, builder, or another party may even offer to cover that cost themselves as an incentive for you to buy.
-
Seller concessions: Sellers are allowed to pay buyer closing costs according to most loan program guidelines. Seller-paid closing costs can add up to thousands of dollars, which can free up some cash for you to increase your down payment, pay down debt, or make other financial adjustments to try to get a better rate.
There’s a lot that can ultimately have an impact on your actual rate.
Your First Step? Getting Pre-Approved.
If you want to know if your number could be higher or lower than the headlines on social, you need to talk to an expert. A simple conversation with a loan officer can help you determine when you’ll be ready to buy, how much you can borrow, and of course, what your real rate will be.
Your lender may recommend a pre-qualification and pre-approval:
-
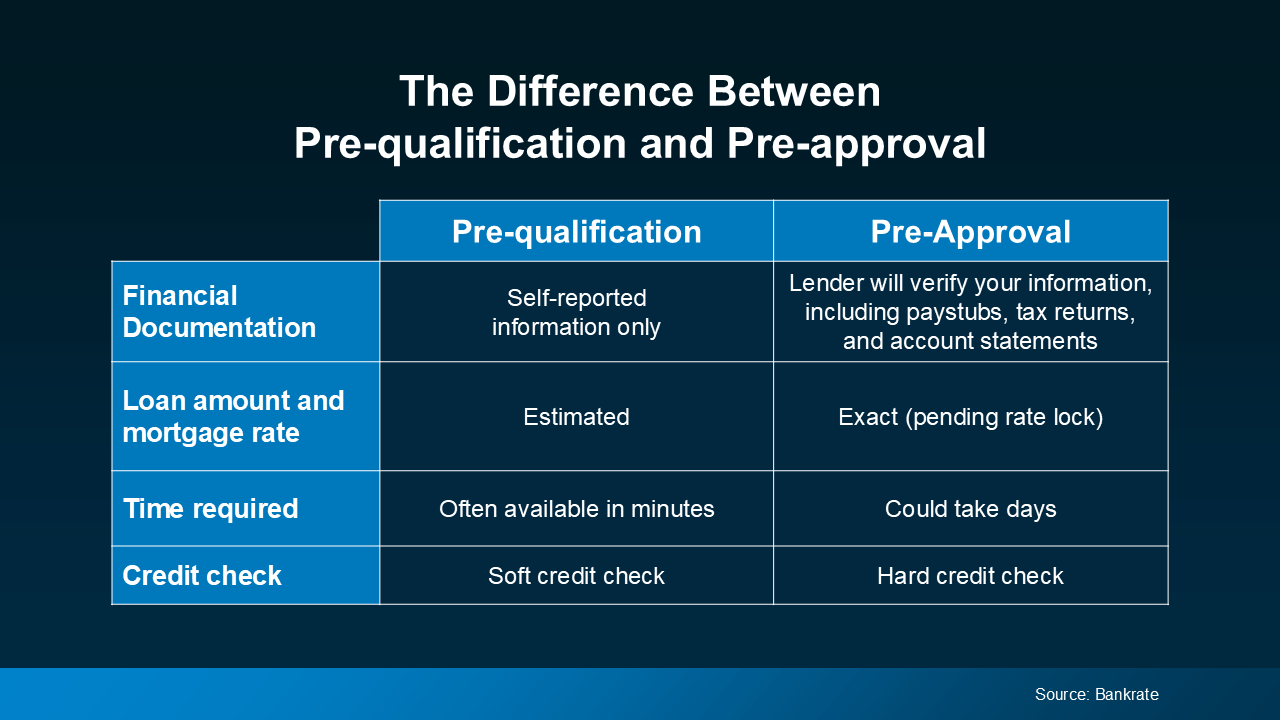
Pre-qualification is a general estimate of what you might be able to borrow based on self-reported information.
-
On the flip side, pre-approval is actually a conditional commitment from a lender based on verified information.
Just know that, of the two, the pre-approval process gives you a more accurate picture of your options than pre-qualification. Bankrate gives a quick comparison so you can see why:
How To Get Ready for the Conversation
Ask your lender what documents you’ll need to gather for that conversation. And keep these questions in your pocket too. They’re good things to go over when you talk:
-
What will I gain or lose by waiting to buy a home for 3, 6, or 12 months?
-
Will I get any tax advantages by buying a home – and what are they?
-
What’s the benefit of buying a home and starting to build equity now versus waiting? And how does that impact my finances in the long run?
-
How will rate changes in either direction affect me?
Once you find out your rate, maybe you can buy now. Or maybe you still need to wait. But at least you’d know your options and can make an informed decision.
Bottom Line
Headlines and social media make today’s rates sound high. But you have to remember, the rate you’re seeing online and your actual rate could be different. The only way to know what your rate could be is to talk to a trusted lender.
With the right help, you can find out what your real rate is – and where it can take you.

Two Moves That Can Get You Into Your First Home Sooner

What Higher Mortgage Rates Mean for Home Sellers

Hoping for (or Dreading) a Housing Crash? The Experts Just Weighed In.



-

 Affordability4 weeks ago
Remote Work Could Be Your Affordability Answer
-
 For Buyers4 weeks ago
Data Centers Are Moving Closer to Homes. What Does That Mean for You?
-
 Agent Value4 weeks ago
The Housing Market Split in 2. Which Side Is Your House On?
-

 For Sellers3 weeks ago
Selling This Fall? You Want To Get These 4 Things Right.
-

 Agent Value3 weeks ago
Selling This Fall? You Haven’t Missed Your Window
-

 Affordability2 weeks ago
3 Things You Can Actually Control About Your Mortgage Rate Right Now
-
 Affordability3 weeks ago
The Best Time To Buy a Home in 2026 Is Almost Here
-
 Agent Value2 weeks ago
There Are 4 Types of Housing Markets Right Now. Which 1 Are You In?
You must be logged in to post a comment Login