
For Sellers
What’s Your House Worth Now? The Answer May Surprise You

Let’s talk about something you might not check nearly as often as your bank account – and that’s how much your home is worth. But when it comes to your financial situation, it’s an important thing to remember. When’s the last time you had a professional show you the value of your home?
Think about it. For most people, your house is probably the biggest asset you have. And if you’ve owned your home for a few years (or longer), chances are it’s been quietly building wealth for you in the background. And honestly? You might be surprised by just how much.
What Is Home Equity?
This wealth you may not even realize you have comes in the form of home equity. Home equity is the difference between what your house is worth and what you still owe on your mortgage. It grows over time as home values rise and as you pay down your mortgage each month. Here’s an example to help you really understand how this works.
Let’s say your house is now worth $500,000, and you have $200,000 left to pay off on your loan. That means you have $300,000 in equity. And most homeowners are sitting on some pretty significant equity right now.
According to Cotality (formerly CoreLogic), the average homeowner with a mortgage has about $311,000 in equity.
Why You Probably Have More Than You Think
Here are the two main reasons homeowners like you have record amounts of equity right now:
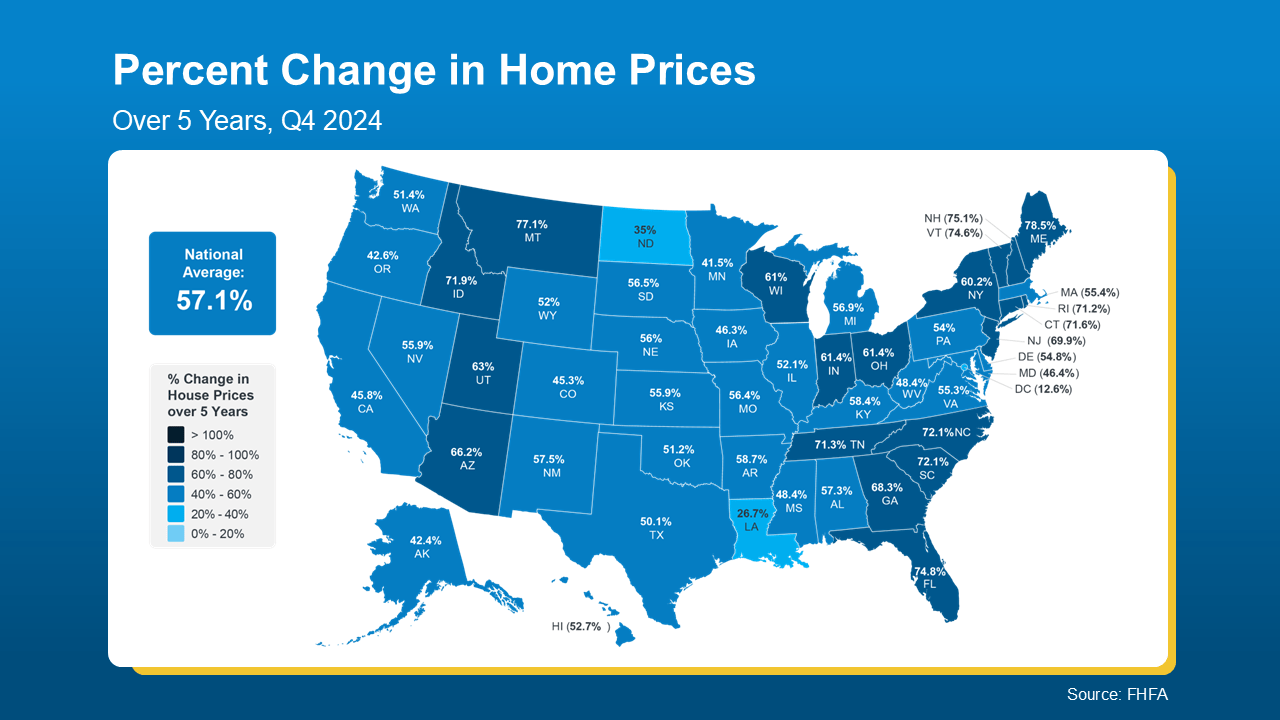
1. Significant Home Price Growth. According to the Federal Housing Finance Agency (FHFA), home prices have jumped by more than 57% nationwide over the last five years (see map below):
And if you purchased your home a few years ago (or more), this means your house is likely worth much more now than when you first bought it, thanks to how much prices have climbed lately.
2. People Are Living in Their Homes Longer. Data from the National Association of Realtors (NAR), shows the average homeowner stays in their home for about 10 years now (see graph below):
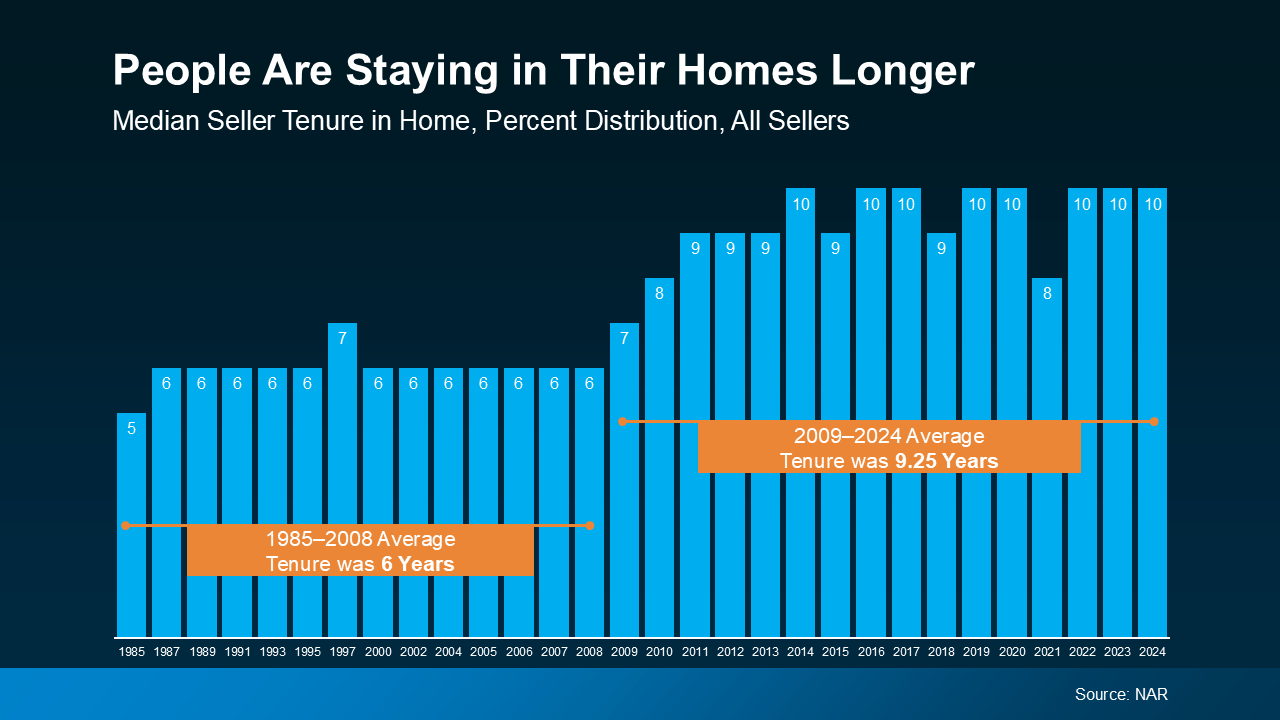 That’s longer than it used to be. And over that decade? You’ve built equity just by making your mortgage payments and riding the wave of rising home values.
So, if you’re one of those people who’s been in their home for that long, here’s how much the behind-the-scenes price growth has helped you out. According to NAR:
“Over the past decade, the typical homeowner has accumulated $201,600 in wealth solely from price appreciation.”
What Could You Actually Do with That Equity?
Remember, your house might be your biggest financial asset – and, if you’re smart about how you leverage your equity, it could open up some exciting opportunities for your future.
- Use it to help buy your next home. Your equity could help you cover the down payment on your next home. In some cases, it might even mean you can buy your next house in all cash.
- Renovate your current house to better suit your life now. And, if you’re strategic about your projects, they could add even more value to your home if you do sell later on.
- Start the business you’ve always dreamed of. Your equity could be exactly what you need for startup costs, equipment, or marketing. And that could help increase your earning potential, so you’re getting yet another financial boost.
Bottom Line
Chances are, your house is worth a lot more than you realize. Whether you’re thinking about selling, upgrading, or simply want to understand your options, your equity isn’t just a number. It’s a tool.
If you sold your house and had significant equity to work with, what would you do with it? Connect with an agent to figure out how to turn your home’s value into your next big move.
Mortgage rates being back above 7% isn’t exactly the news most people wanted. But it’s changing the market in ways that matter whether you’re buying or selling.
The number of homes for sale is growing faster than it was this time last year. And interestingly, the main reason isn’t a flood of new listings. It’s because homes aren’t selling as quickly.
Here’s why – and what that means if you’re thinking about buying or selling.
Inventory Growth Is Picking Up Steam
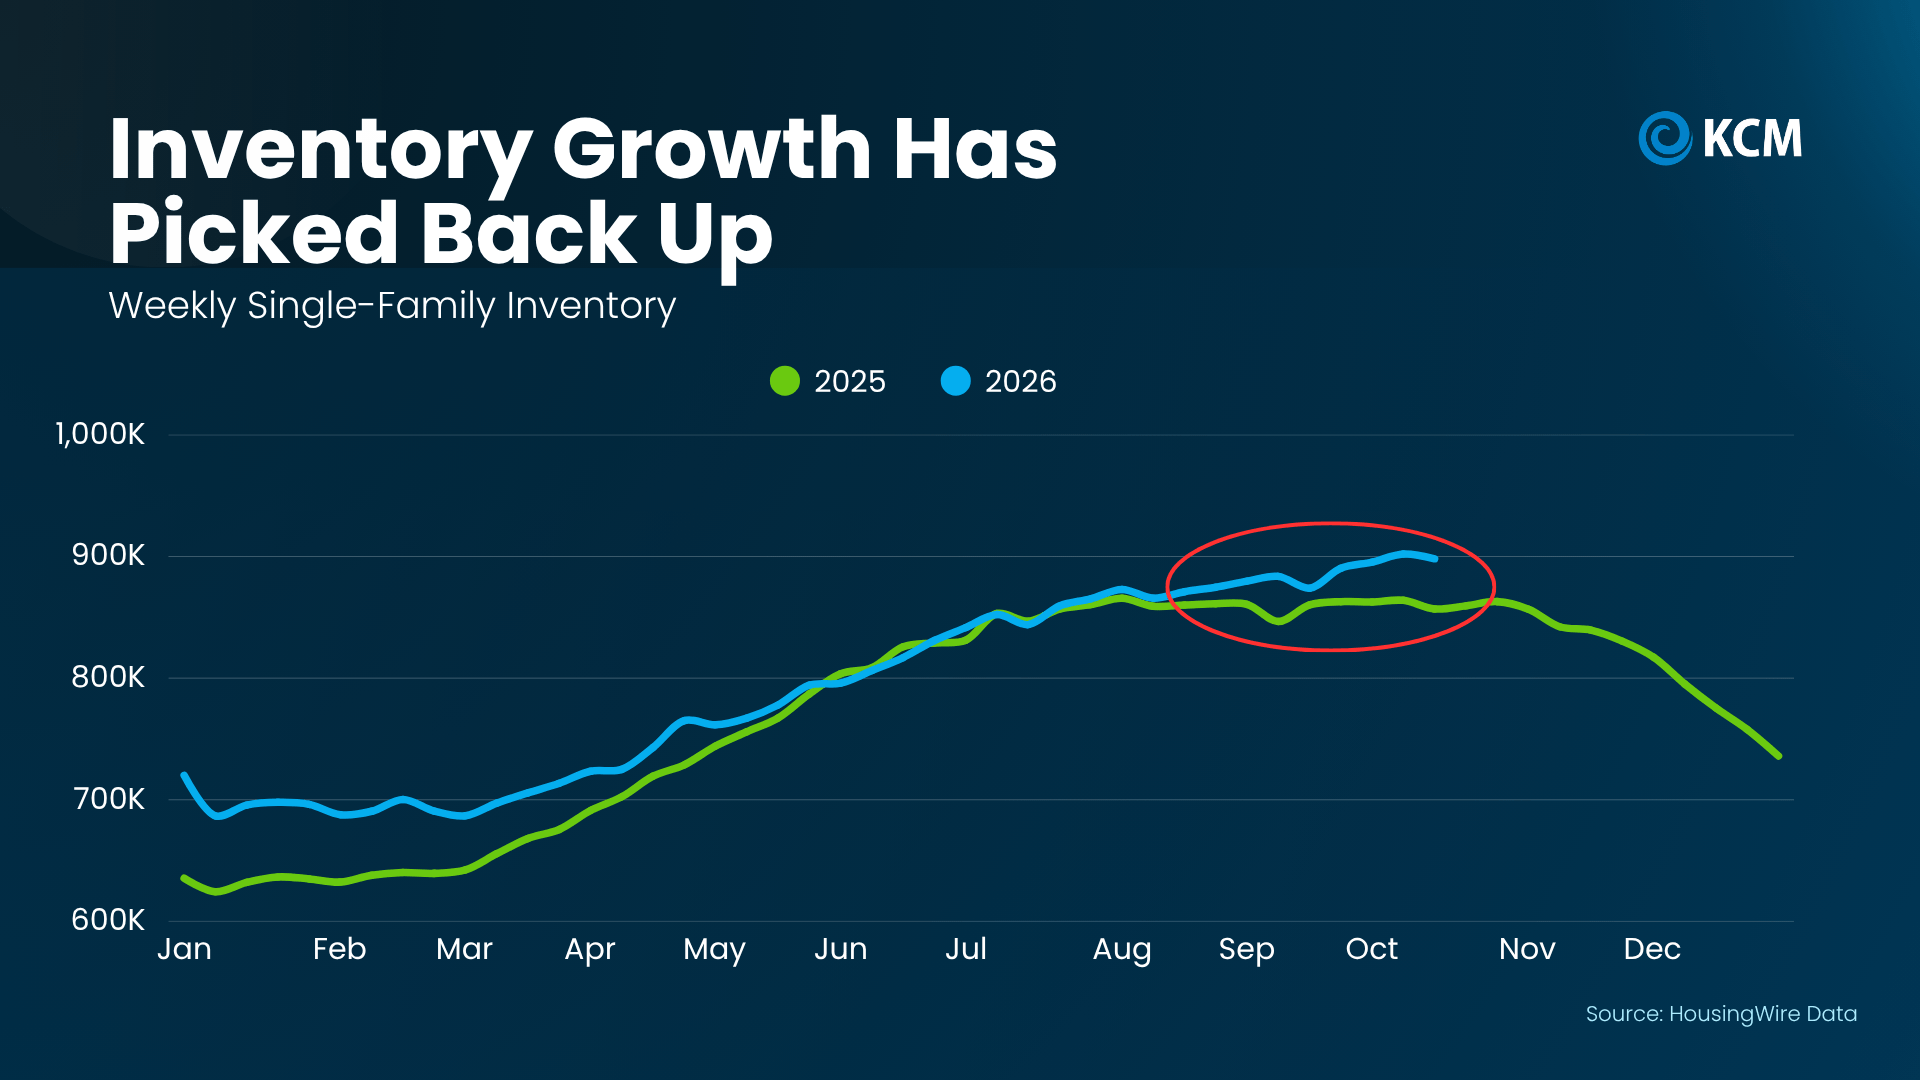
According to HousingWire Data, after inventory growth slowed down for most of the past year, it’s accelerated again in recent weeks. You can see that in the graph below. Just look at the blue line:
And what’s behind this shift might surprise you.
When rates rise, some buyers hit pause. That means fewer homes sell each week. And as those unsold homes stay on the market alongside new listings, the number available starts to grow (see the blue line in the graph below).
Here’s another way to look at it to make it even more obvious. The graph below shows the relationship between rates and inventory. Again, this year is the blue line. Last year? That’s the green.
With rates inching up this year, you can see inventory has grown by about 25k. But when rates went down this time last year, buyers jumped back in, and inventory actually dropped by about 9k.
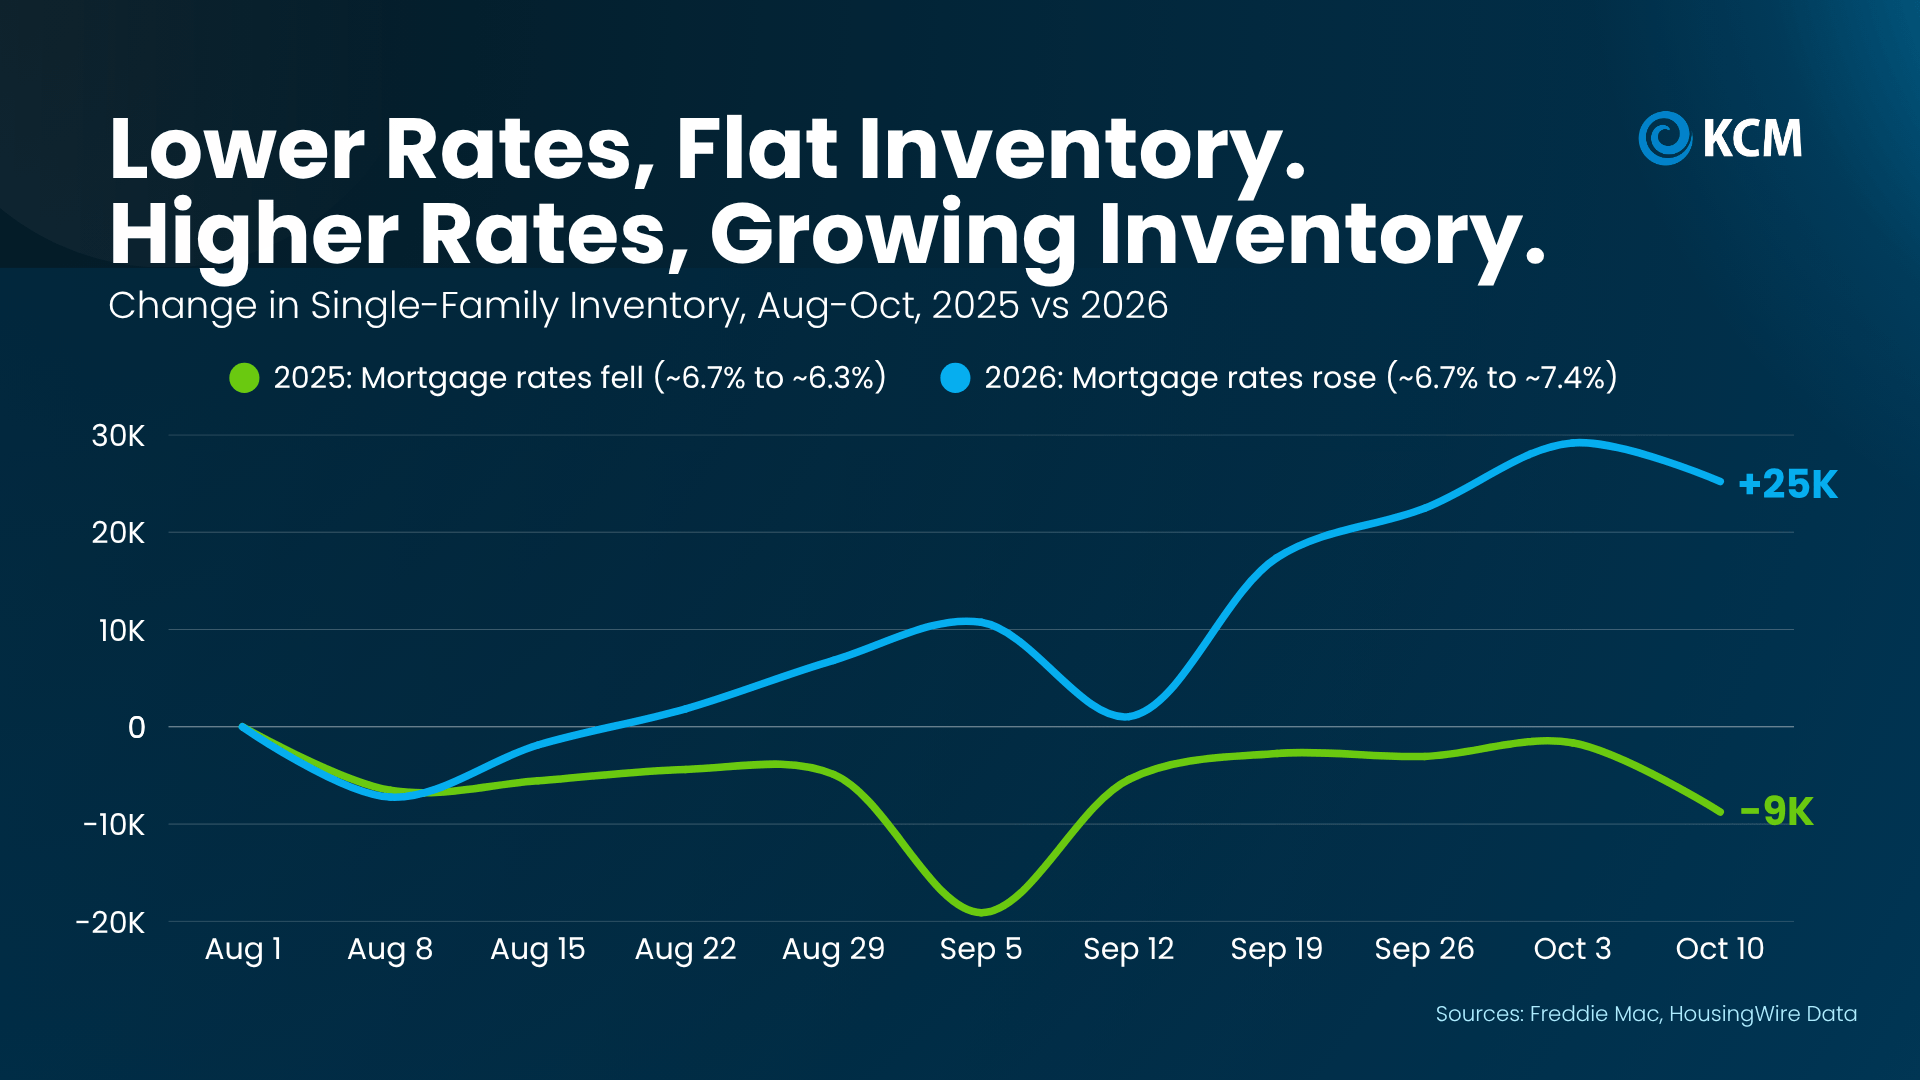
Logan Mohtashami, Lead Analyst at HousingWire, explains how that’s flipped from 2025 to 2026:
“With mortgage rates over 7%, demand tends to soften and inventory rises . . .”
Homes Are Spending More Time on the Market
Here’s another metric that shows the impact rates are having: time on market. Data from Realtor.com shows the typical home spent 61 days on the market this September. Back in September 2021, it was just 41 days (see graph below):
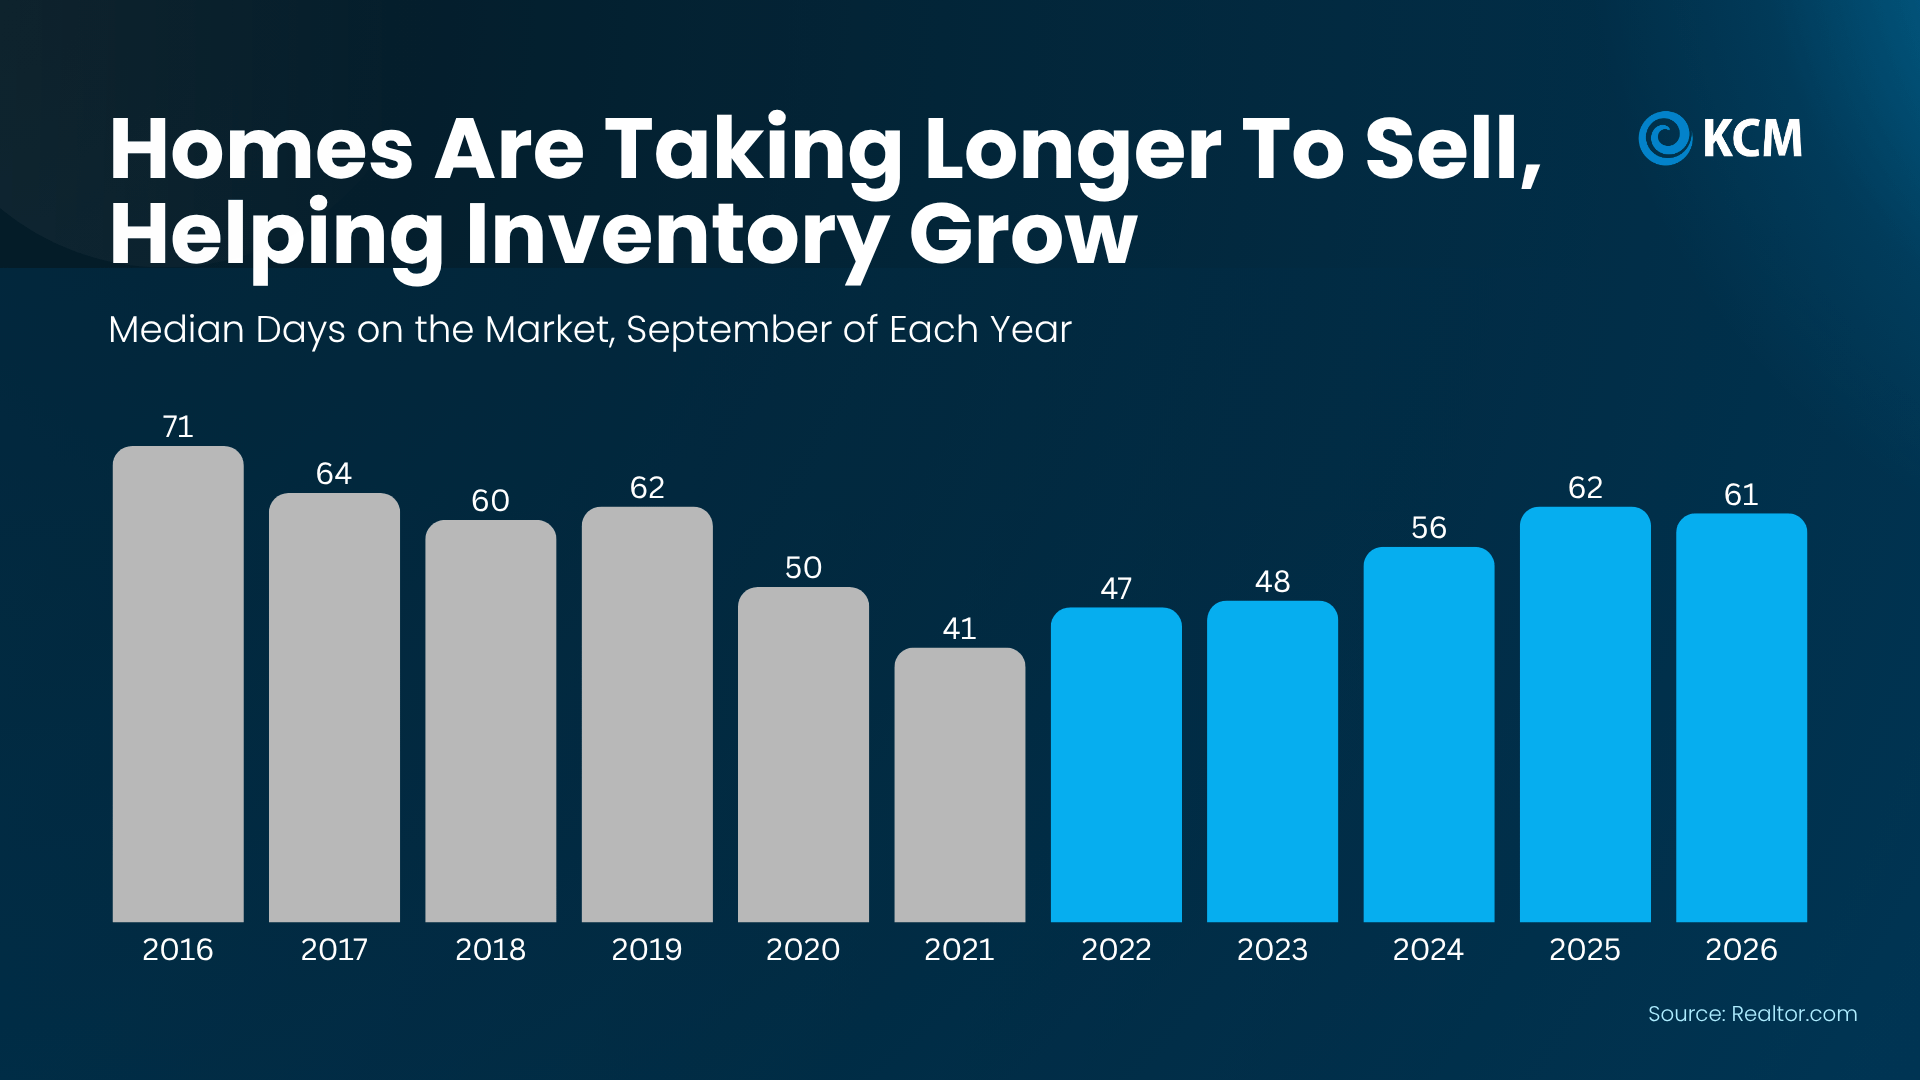
Here’s what that tells us. In 2021, when rates were low, more buyers were active, and homes sold fast. But now that rates are a bit higher, not as many buyers are interested, so it takes a bit longer to close a deal.
How To Make This Market Work for You
So, what does all of this mean for your plans? That depends on which side of the move you’re on:
If you’re buying, more homes for sale means more choices and less pressure to rush. And more room to negotiate too. A house that’s been sitting for a while could have a seller who’s more willing to talk – not just about price, but repairs, closing costs, or even helping buy down your mortgage rate.
That doesn’t mean every seller will play ball. But compared to the frenzy of a few years ago, buyers have more leverage now.
If you’re selling, the right strategy can make all the difference. Buyers have more homes to choose from, so making yours stand out is especially important. That starts with pricing it right from day one, making a great first impression, and working with your agent to highlight what makes your house worth choosing. Buyers are still buying and homes are still selling. The key is making sure yours is positioned to attract the right buyer.
The market hasn’t stopped. It’s just moving at a different pace. And whether you’re buying or selling, your strategy needs to move with it.
Bottom Line
In many places right now, inventory is growing and homes are taking a bit longer to sell. And that’s information that should shape the strategy you use going in.
Whether you’re buying or selling, connect with a local real estate agent to look at how long homes are taking to sell in your neighborhood, so your offer, or your price, fits today’s market.

You’ve spent years making your house feel like home, celebrating milestones, making each room your own, and turning neighbors into friends. As you look ahead to the next chapter of your life, it’s natural to wonder if this is still the place you want to spend it.
Whether you’re leaning toward staying in your house as you get older or moving to a 55+ community, the goal is the same: a home that fits the life you want, with more time for the people and things you love. So, here’s what to consider before you decide.
What It Can Take To Stay Put
Wanting to stay in a house you love and are familiar with makes sense. But most houses need at least some updates to make aging in place easier.
In fact, the Joint Center for Housing Studies of Harvard University (JCHS) finds that fewer than 4% of homes have the basics, like single-floor living, no-step entries, and wide hallways and doorways (see graph below):
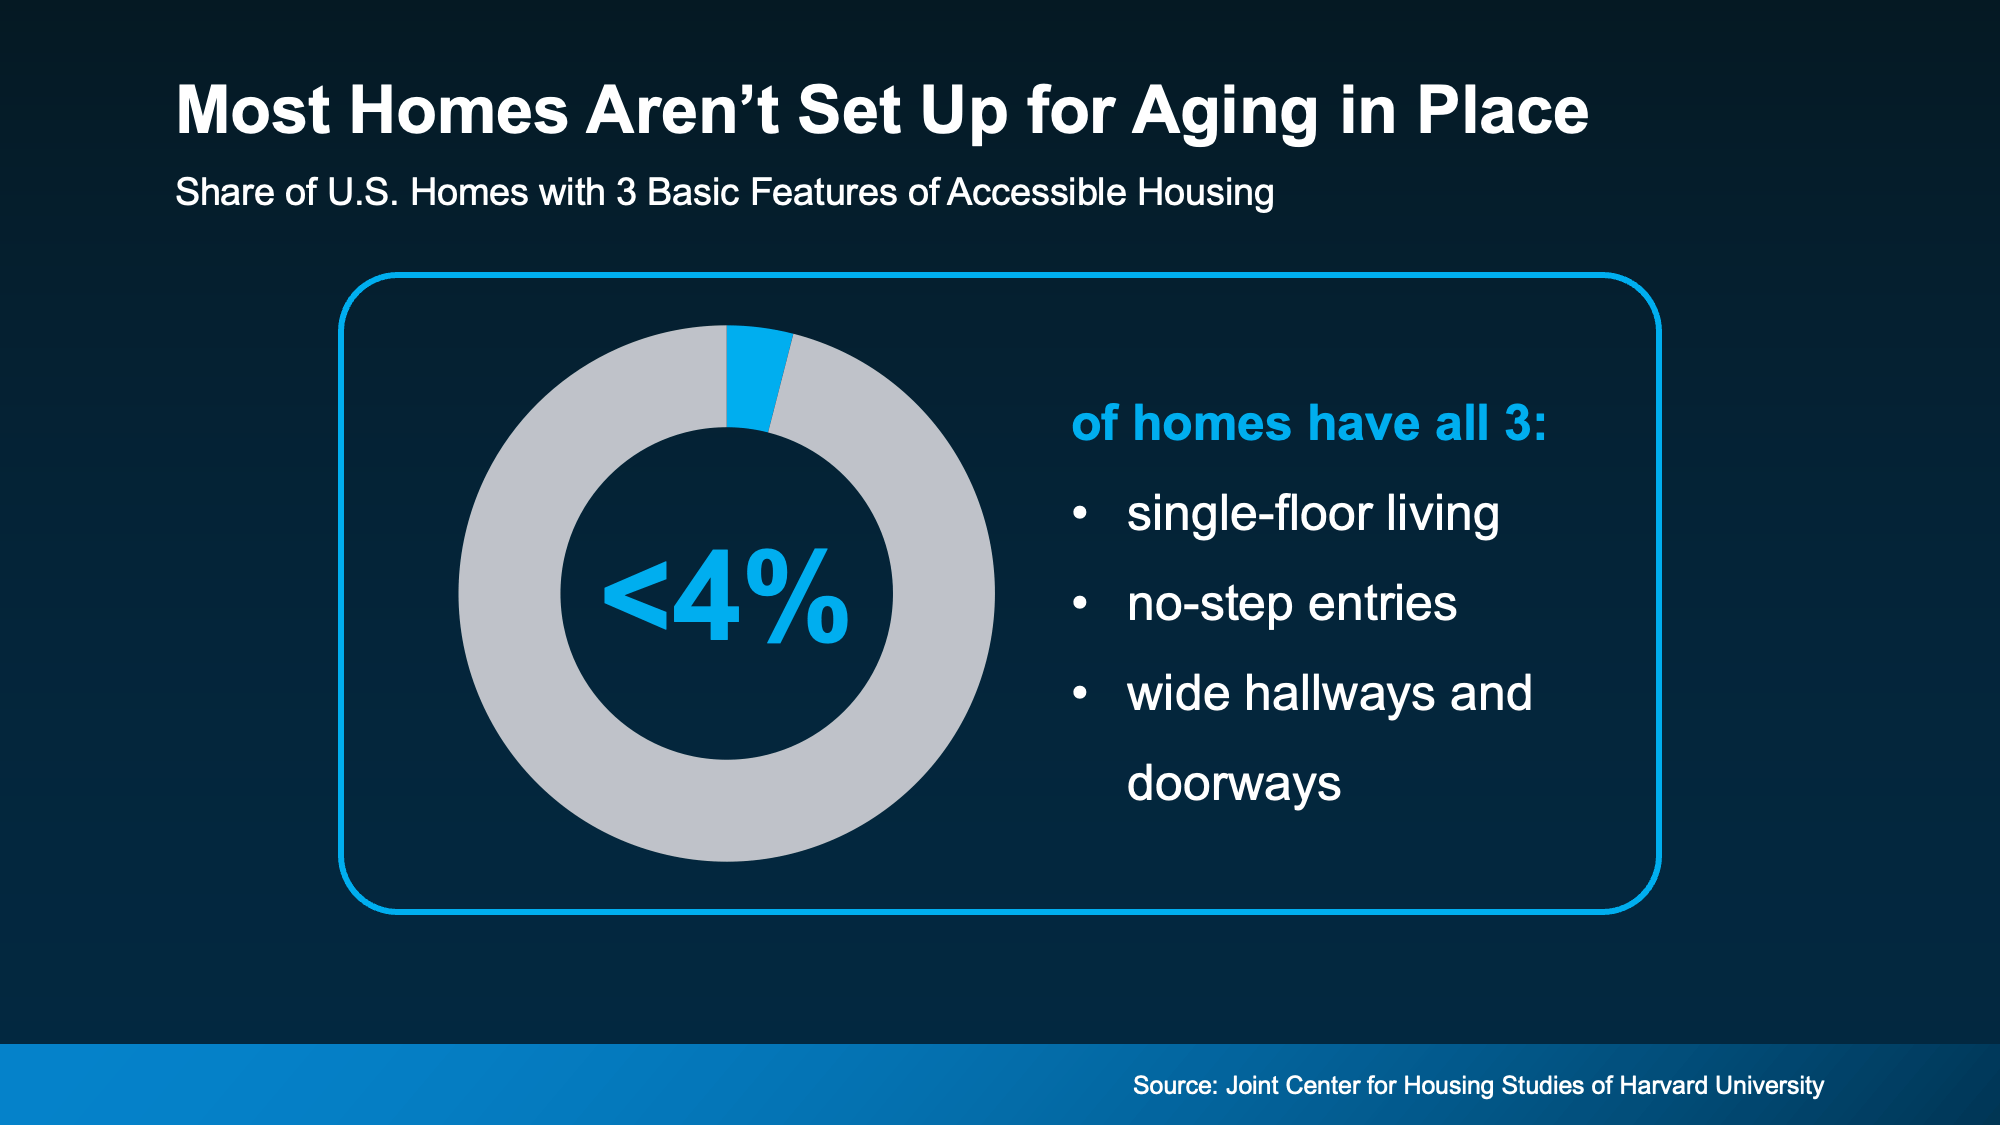
That means for most homeowners, staying put means doing a remodel.
The National Association of Home Builders (NAHB) reports more than half of remodelers (56%) take on this kind of work. Some of the most common projects are installing grab bars, curb-less showers (walk-in showers with no ledge to step over), and wider doorways.
Now, that’s not to say you can’t go this route. You most certainly can. But if this is how you’re leaning just know you’d be living with contractor noise and dust until the work gets done. Some people don’t want to live in a construction zone. Not to mention, having to manage the contractors and schedules, etc.
Your Equity Could Pay for Your Next Move
If that sounds like something you’d rather avoid, here’s the good news. The money for your next home may already be sitting in your current one. It’s called equity, which is the difference between what your house is worth and what you still owe on it. After years of mortgage payments and rising home values, it adds up. Jess Catorc, Co-Founder of Carry, explains:
“The way home equity builds and is used changes a lot depending on your stage of life. . . . For older homeowners, decades of mortgage payments and home-value growth can turn equity into a financial cushion.“
When you sell, that cushion can go toward a home that’s ready for this stage of life. No demo required. You just get the keys and it’s all there, ready for you. That means less time on projects and more time for living. And one option you may consider if you’re entertaining a move is a 55+ plus community.
Why 55+ Communities Are Worth a Look
From the homes to the shared spaces to the activity calendar, these communities are planned around this stage of life. And that means everything you need is already rolled into one place. Rocket Mortgage lists some of the biggest perks (see visual below):
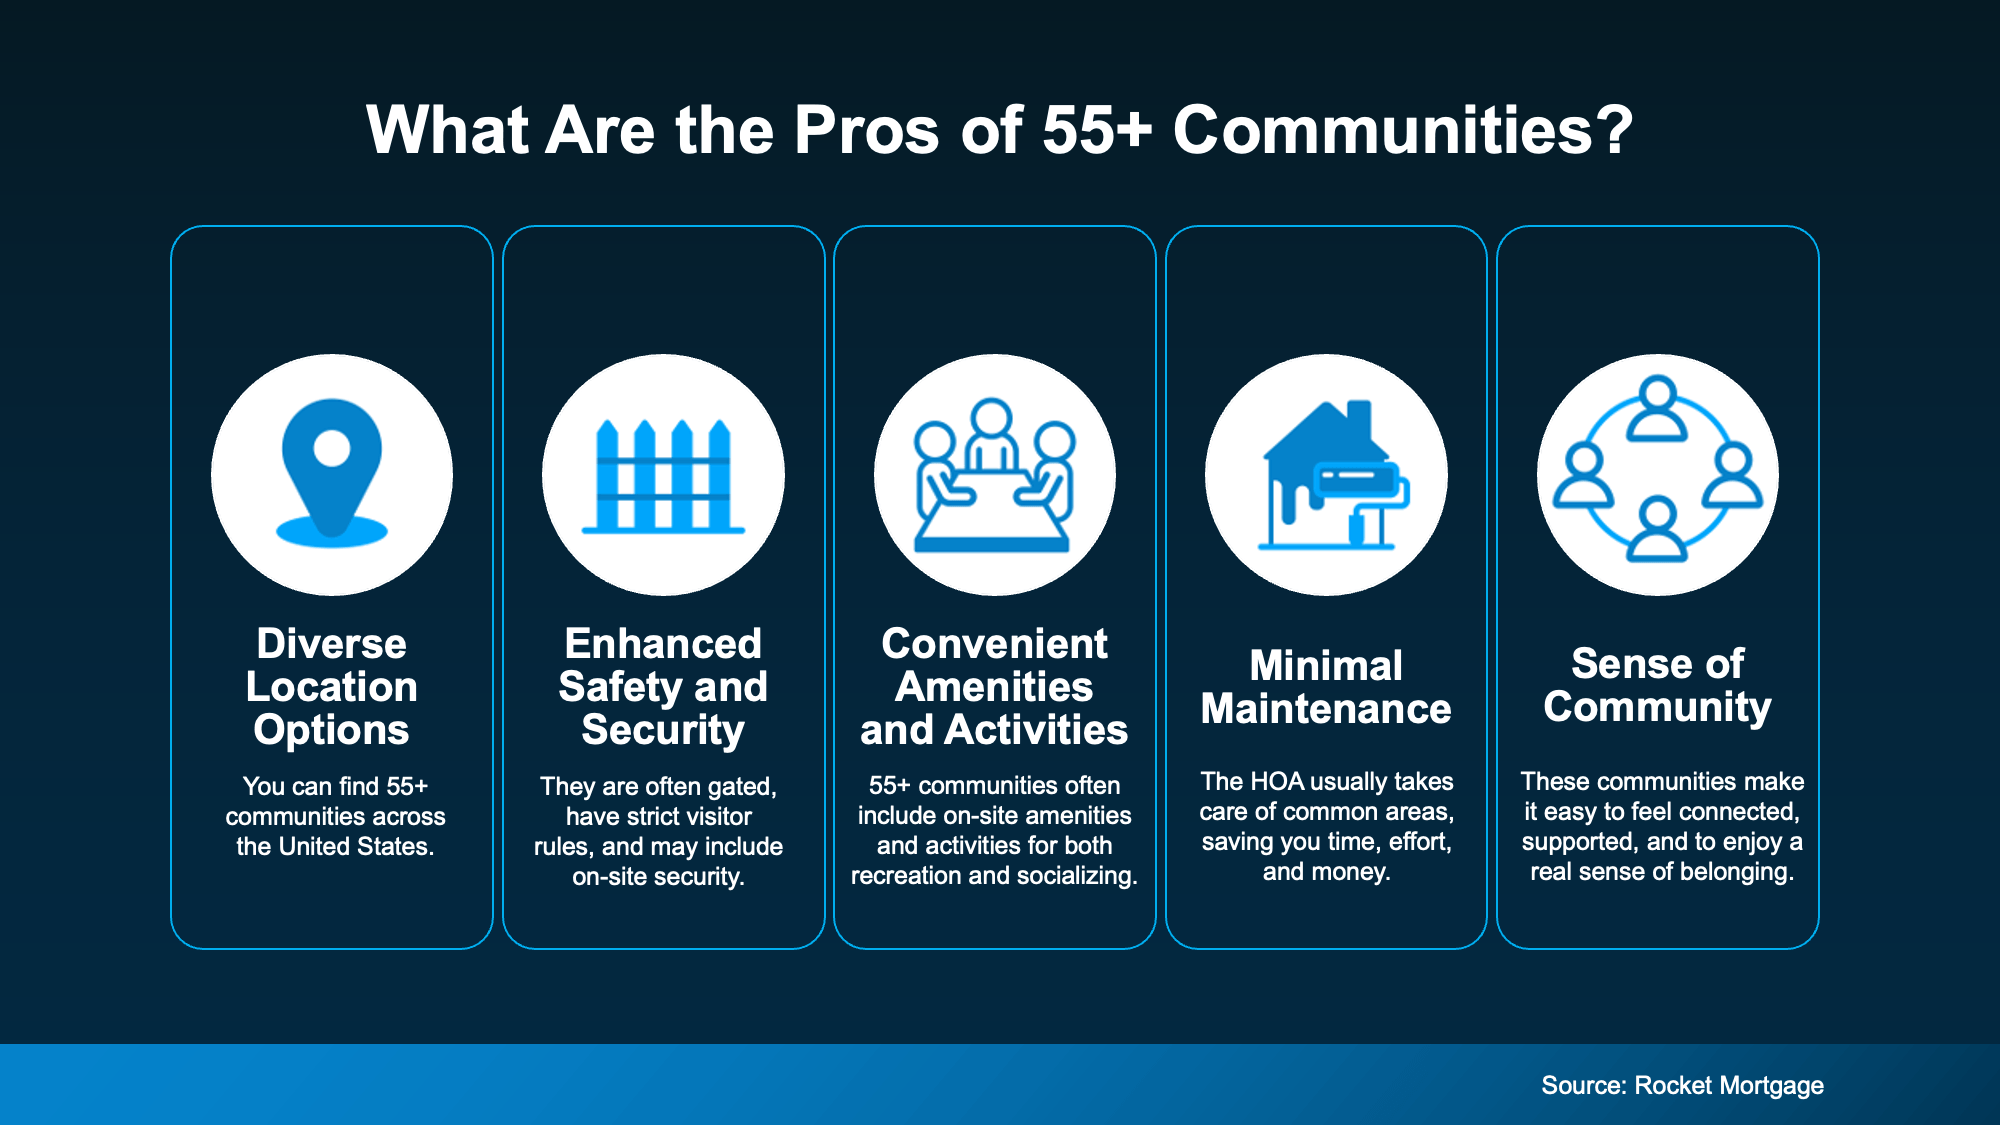
Instead of spending time and money to make your house easier to live in, you’d move into a community that’s designed with that in mind from the jump. That frees you up for the good stuff, like a morning walk with a neighbor, a game night down the street, or finally trying the hobby you’ve been putting off.
Bottom Line
Staying and moving can both be good choices. What matters most is finding the place where you’ll feel comfortable and at home for years to come.
A local real estate agent can help you weigh the two by showing you what your house could sell for and what 55+ communities in your area have to offer, so you can decide what feels right for you.

You’ve probably heard the Federal Reserve (the Fed) is raising rates again. And if you’re planning to buy or sell a house, you may be wondering what that means for you.
With all the headlines, it’s easy to think the Fed sets mortgage rates. That’s actually a common myth. But the Fed’s decisions can still have an impact on them.
So, where does that leave you? The next few months could get a little bumpy. But the Fed is playing the long game. And with the right plan, you can still make a move that works. Let’s break it down.
Why the Fed Is Raising Rates
It all comes back to inflation. With prices rising fast, everything is getting more expensive – and that leaves buyers with less spending power and makes homes cost more to build.
So, the Fed raises its key short-term rate (the Federal Funds Rate) to slow down inflation. And that’s where a lot of people get tripped up.
-
MYTH: The Fed controls mortgage rates.
-
REALITY: The Fed has an impact on mortgage rates, but it’s only one piece of the puzzle.
As NerdWallet explains:
“The Federal Reserve influences mortgage rates, but doesn’t set them. . . Mortgage rates are influenced by many elements, including the inflation rate, the pace of job creation, and whether the economy is growing or shrinking. The Federal Reserve’s monetary policy is a factor, too . . .”
Here’s the simplest way to explain how it all fits together. Mortgage rates tend to follow something called the 10-year treasury yield. That’s the return investors get for lending money to the government for 10 years. And that yield moves up and down based on what investors expect from inflation and the economy.
Right now, one of the biggest things moving that yield is the conflict in Iran. It’s pushed oil prices higher, which has investors worried about inflation. That’s why any news about the conflict can move mortgage rates. If there’s resolution in Iran, that could take some pressure off inflation and mortgage rates. But the timing is hard to predict.
What the Fed does can move that yield, too. When they hike the Federal Funds Rate to fight inflation, investors pay attention. That can push the 10-year yield up, and mortgage rates usually follow. But once inflation cools, the yield has room to come back down, and mortgage rates can, too. That gives buyers some of their purchasing power back (see graphic below):
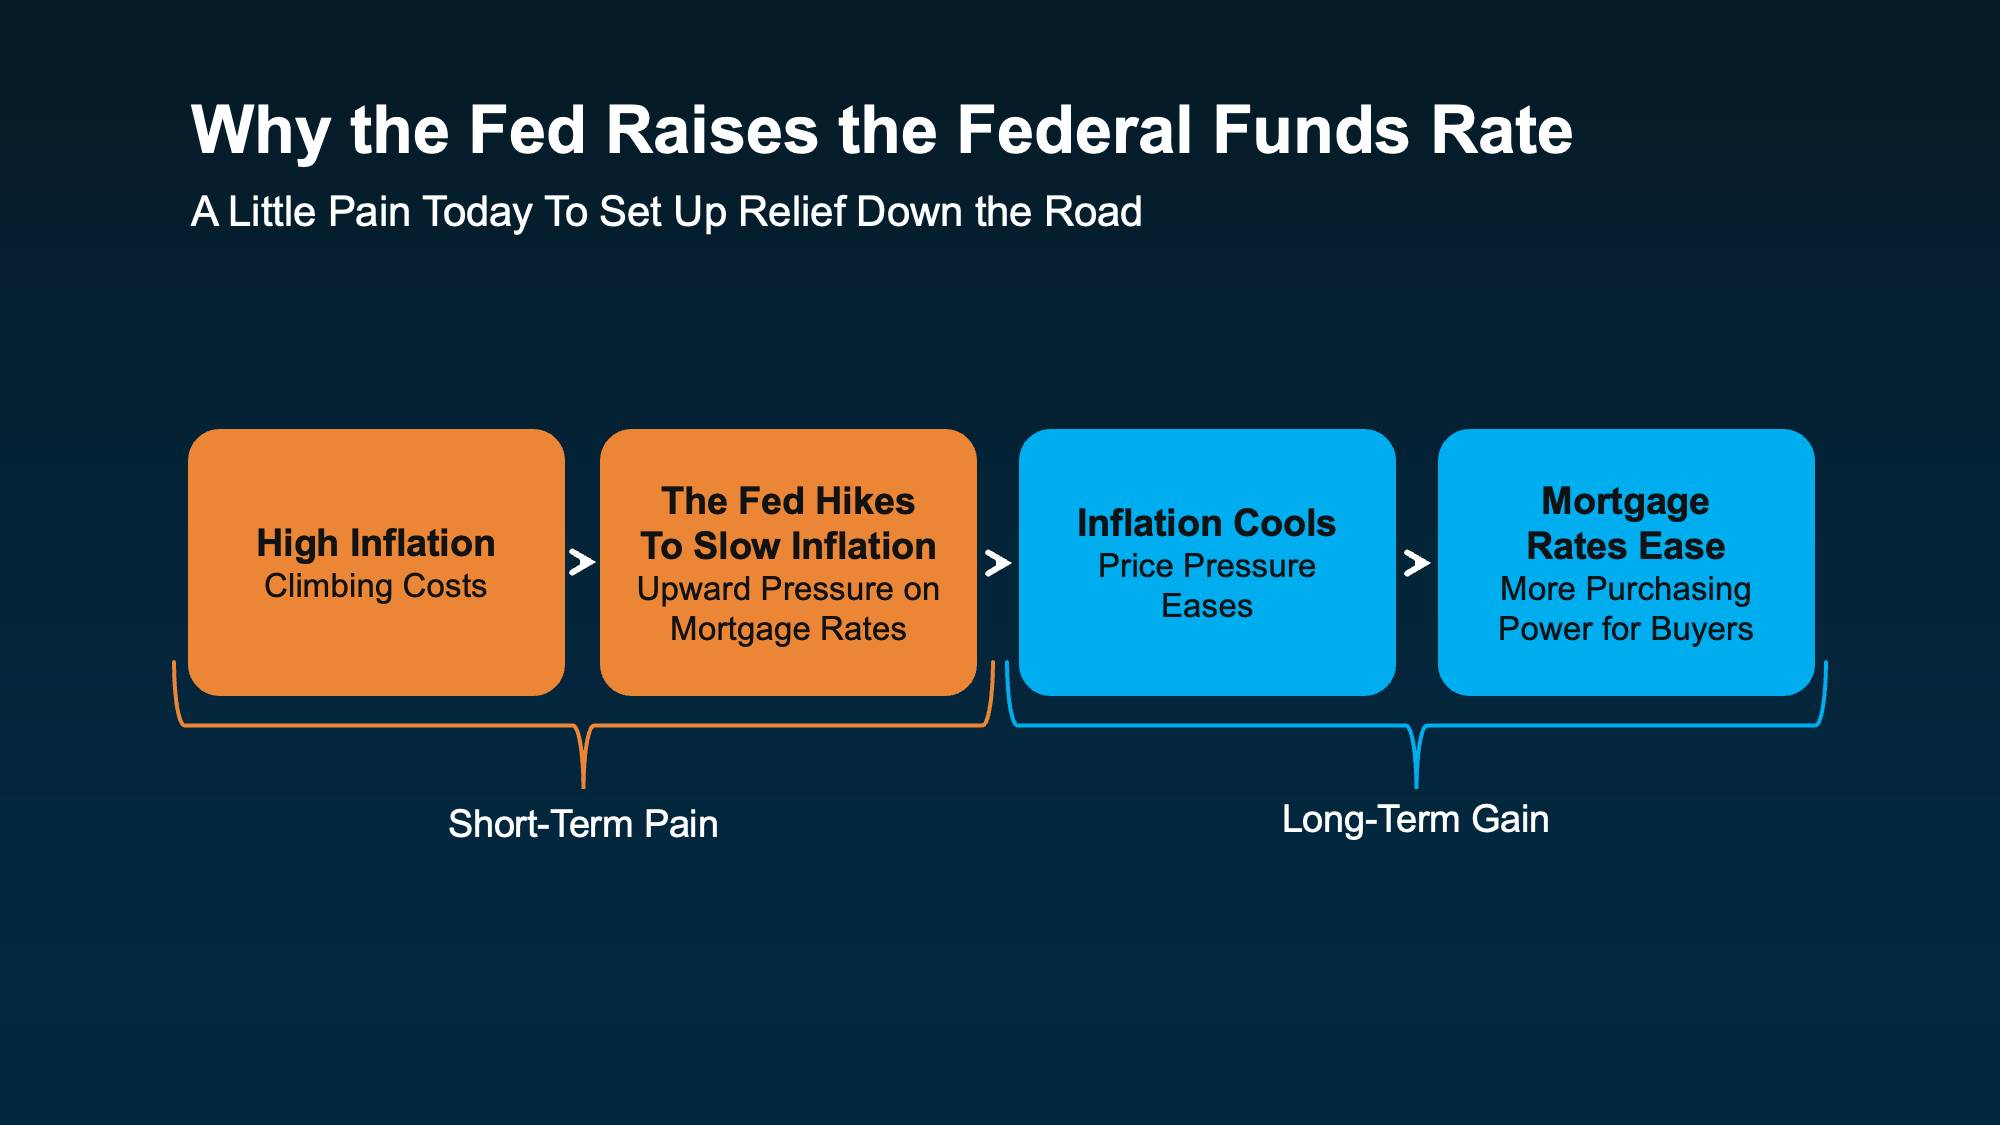
Think of it as a little pain today to set up some relief down the road. But how long could that short-term pain last? A lot depends on what the Fed does next.
There’s a Strong Possibility the Fed Will Hike Again This Year
According to CME FedWatch, there’s over an 80% chance the Fed hikes their federal funds rate at least once more before the end of 2026 (see graph below):

Remember, the Fed doesn’t set mortgage rates. But another hike will likely keep upward pressure on them in the short term. So, should you wait it out? Sam Williamson, Senior Economist at First American, says this:
“Over time, firmer Fed action could help steady the bond market and open the door to lower mortgage rates, but only if investors become more confident that inflation is coming under control.“
And there are some early signs that’s starting to happen. Inflation cooled faster than experts expected in August:
-
PCE inflation dropped to 3.4%, down from 3.7% in July.
-
Core PCE (the Fed’s preferred measure which leaves out food and energy prices) fell to 3%, down from 3.3%.
That’s a step in the right direction, and it’s part of why the odds of a hike at the Fed’s October meeting have come down recently. But inflation’s still above the Fed’s 2% target, and it’s been that way for about 5 years. So, lower rates could still take a while. Your best bet is a plan that works at today’s rates.
How To Make Your Move Work Right Now
While this rate hike cycle isn’t the headline you want to see, it doesn’t mean you have to wait. There are still ways to move, even now.
-
If you’re buying: Get pre-approved so you know your real budget. Ask your lender about your options to get the best rate possible. And once you’re under contract, lock your rate so a jump before closing doesn’t raise your payment.
-
If you’re selling: Decide what matters most to you – a quick sale or top dollar. Each one can call for a different plan. Price for today’s buyers, whose budgets are smaller with higher rates. And think about offering a rate buydown or other concession. They can do more for a buyer’s budget than a price cut.
Bottom Line
The Fed doesn’t set mortgage rates, but its hikes can keep them higher for a while. The goal is to bring inflation, and eventually rates, down over time. With more hikes likely this year, waiting may not pay off. So, connect with a local real estate agent to map out a plan that works at today’s rates.

Why There are More Homes for Sale Right Now (and What It Means for You)

Why Most People Are Still Glad They Bought a Home

Renovate or Relocate? What To Know Before You Decide To Age in Place



-

 For Sellers4 weeks ago
Selling This Fall? You Want To Get These 4 Things Right.
-

 Affordability3 weeks ago
3 Things You Can Actually Control About Your Mortgage Rate Right Now
-

 Affordability4 weeks ago
The Best Time To Buy a Home in 2026 Is Almost Here
-

 Buying Tips2 weeks ago
Hoping for (or Dreading) a Housing Crash? The Experts Just Weighed In.
-

 Agent Value3 weeks ago
There Are 4 Types of Housing Markets Right Now. Which 1 Are You In?
-

 For Sellers2 weeks ago
What Higher Mortgage Rates Mean for Home Sellers
-

 Affordability3 weeks ago
Why So Many Sellers Are Cutting Their Price Right Now
-

 Affordability2 weeks ago
The Mortgage Rate You See Online Isn’t Necessarily the One You’d Get.
You must be logged in to post a comment Login