

For Buyers
Why Rising Foreclosure Headlines Aren’t a Red Flag for Today’s Housing Market

If you’ve seen headlines saying foreclosure activity has been climbing for 10 straight months, it’s easy to assume that’s a sign of trouble for the housing market. But when you look at the full picture, a few simple truths become clear:
- Today’s foreclosure numbers are in line with what’s considered normal
- High home equity is keeping most homeowners in a strong financial position
- None of the data points to a big wave of distressed sales that’ll crash the market
Foreclosure Filings Are Up 32%, But That Doesn’t Mean the Market’s in Trouble
If you peel the layers all the way back, what everyone is actually worried about is that we’re headed for a repeat of what happened in 2008. Back then, riskier lending practices and an oversupply of homes for sale brought home prices down and led to a significant increase in foreclosures. A lot of people felt the impact. But this isn’t the same situation.
Yes, ATTOM data shows foreclosure filings are up 32% year-over-year. And that increase is going to sound dramatic. But context matters, and it doesn’t mean we’re headed for another crash. And the numbers prove it. Take a look at where we were during the last crash (the red in the graph below). And where we are now (the blue):
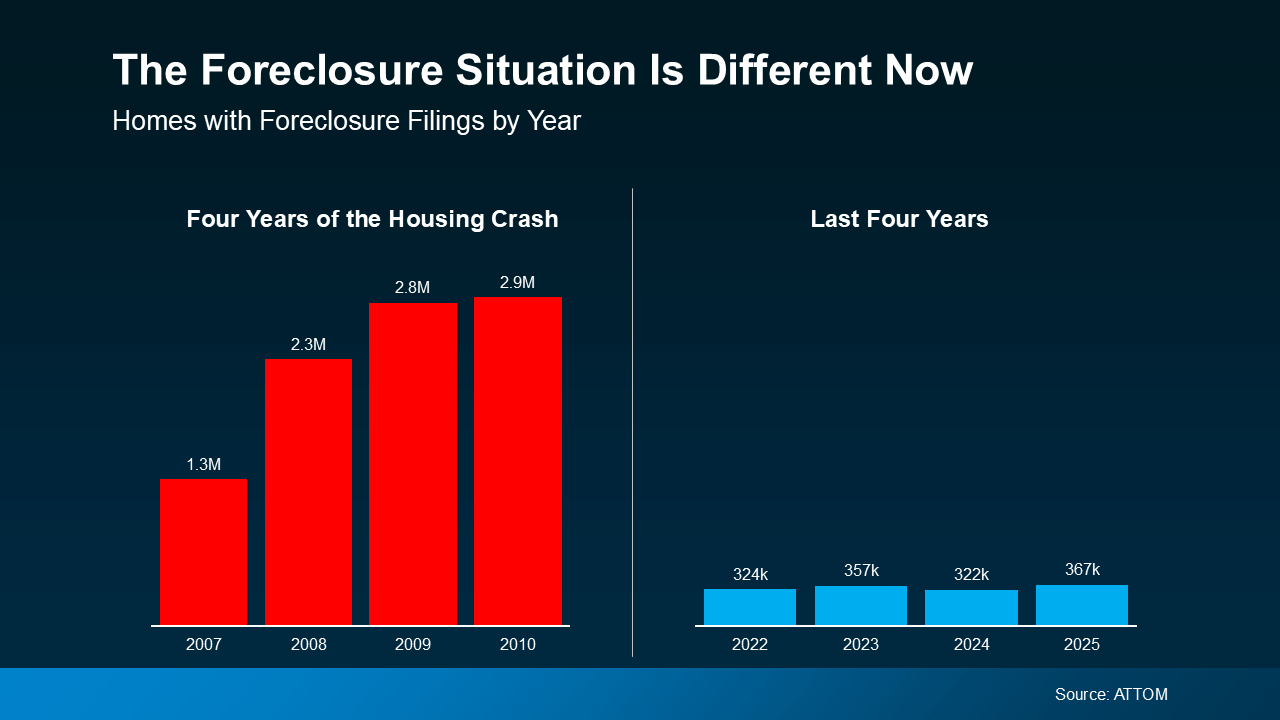 Even with the uptick lately, we are still nowhere near crash levels – far from it. This isn’t a return to crisis levels. What it is, is a return to normal.
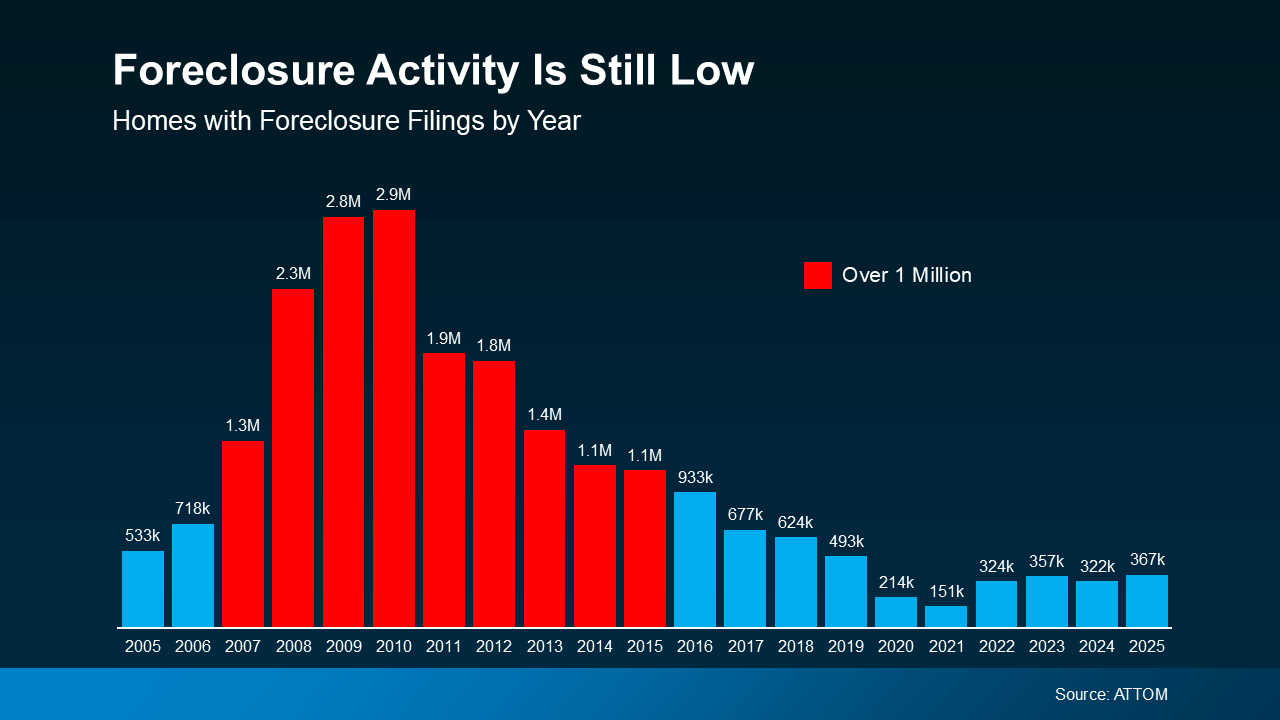
The graph below shows foreclosure filings going all the way back to early 2005. The lead up to, and the aftermath of, the crash is there in red. Those are the years when foreclosure filings went above the 1 million mark each year.
Now, look at the right side and scan back to the 2017–2019 range (the last truly normal years for housing). You’ll see we’re actually just starting to fall back in line with what’s typical for the market, even with the increase lately:
 Rob Barber, CEO at ATTOM, explains it well:
“Foreclosure activity increased in 2025, reflecting a continued normalization of the housing market following several years of historically low levels . . . While filings, starts, and repossessions all rose compared to 2024, foreclosure activity remains well below pre-pandemic norms and a fraction of what we saw during the last housing crisis . . . today’s uptick is being driven more by market recalibration than widespread homeowner distress, with strong equity positions and more disciplined lending continuing to limit risk.”
The word “normalization” in that quote is extra important. While economic and financial pressures are putting a strain on some homeowners, this isn’t a flood of distressed homes. No matter what the headlines may have you believe, this isn’t a large-scale crisis.
Today’s increase isn’t a sign of trouble. It’s a return to normal.
Why This Isn’t a Repeat of 2008
Even though the last housing crash still shapes how a lot of people interpret today’s news, the reality is, this is a different market:
- Lending standards are stronger
- Borrowers are more qualified
- And homeowners have far more equity
And that equity piece is especially important. Over the last five years, home prices have risen significantly. For many people, their house is worth far more than they paid for it. That means most homeowners have a strong financial cushion to fall back on, if needed.
Basically, if someone faces hardship today, they often have the option to sell, and maybe even walk away with money in their pocket, instead of going through foreclosure. That’s a major contrast to 2008, when many homeowners owed more than their home was worth.
Bottom Line
Foreclosure activity may be rising, but it’s still well within a normal range – and nowhere close to the danger zones of the past. But the headlines are doing more to terrify than clarify. And that’s exactly why having a trusted real estate expert you can call on is so important.
When you hear something in the news or see something on social about housing that worries you, reach out to a local agent. An expert will have the context needed to explain what’s really happening and how it impacts you (if at all).

With everything going on, it’s understandable if you’re wondering if you’d regret buying right now.
Everyday expenses cost more. Mortgage rates are higher than you’d like. And when the economy feels uncertain, taking on a mortgage can feel like a much bigger leap. But here’s some perspective that may help…
Most people who already made that leap would do it again.
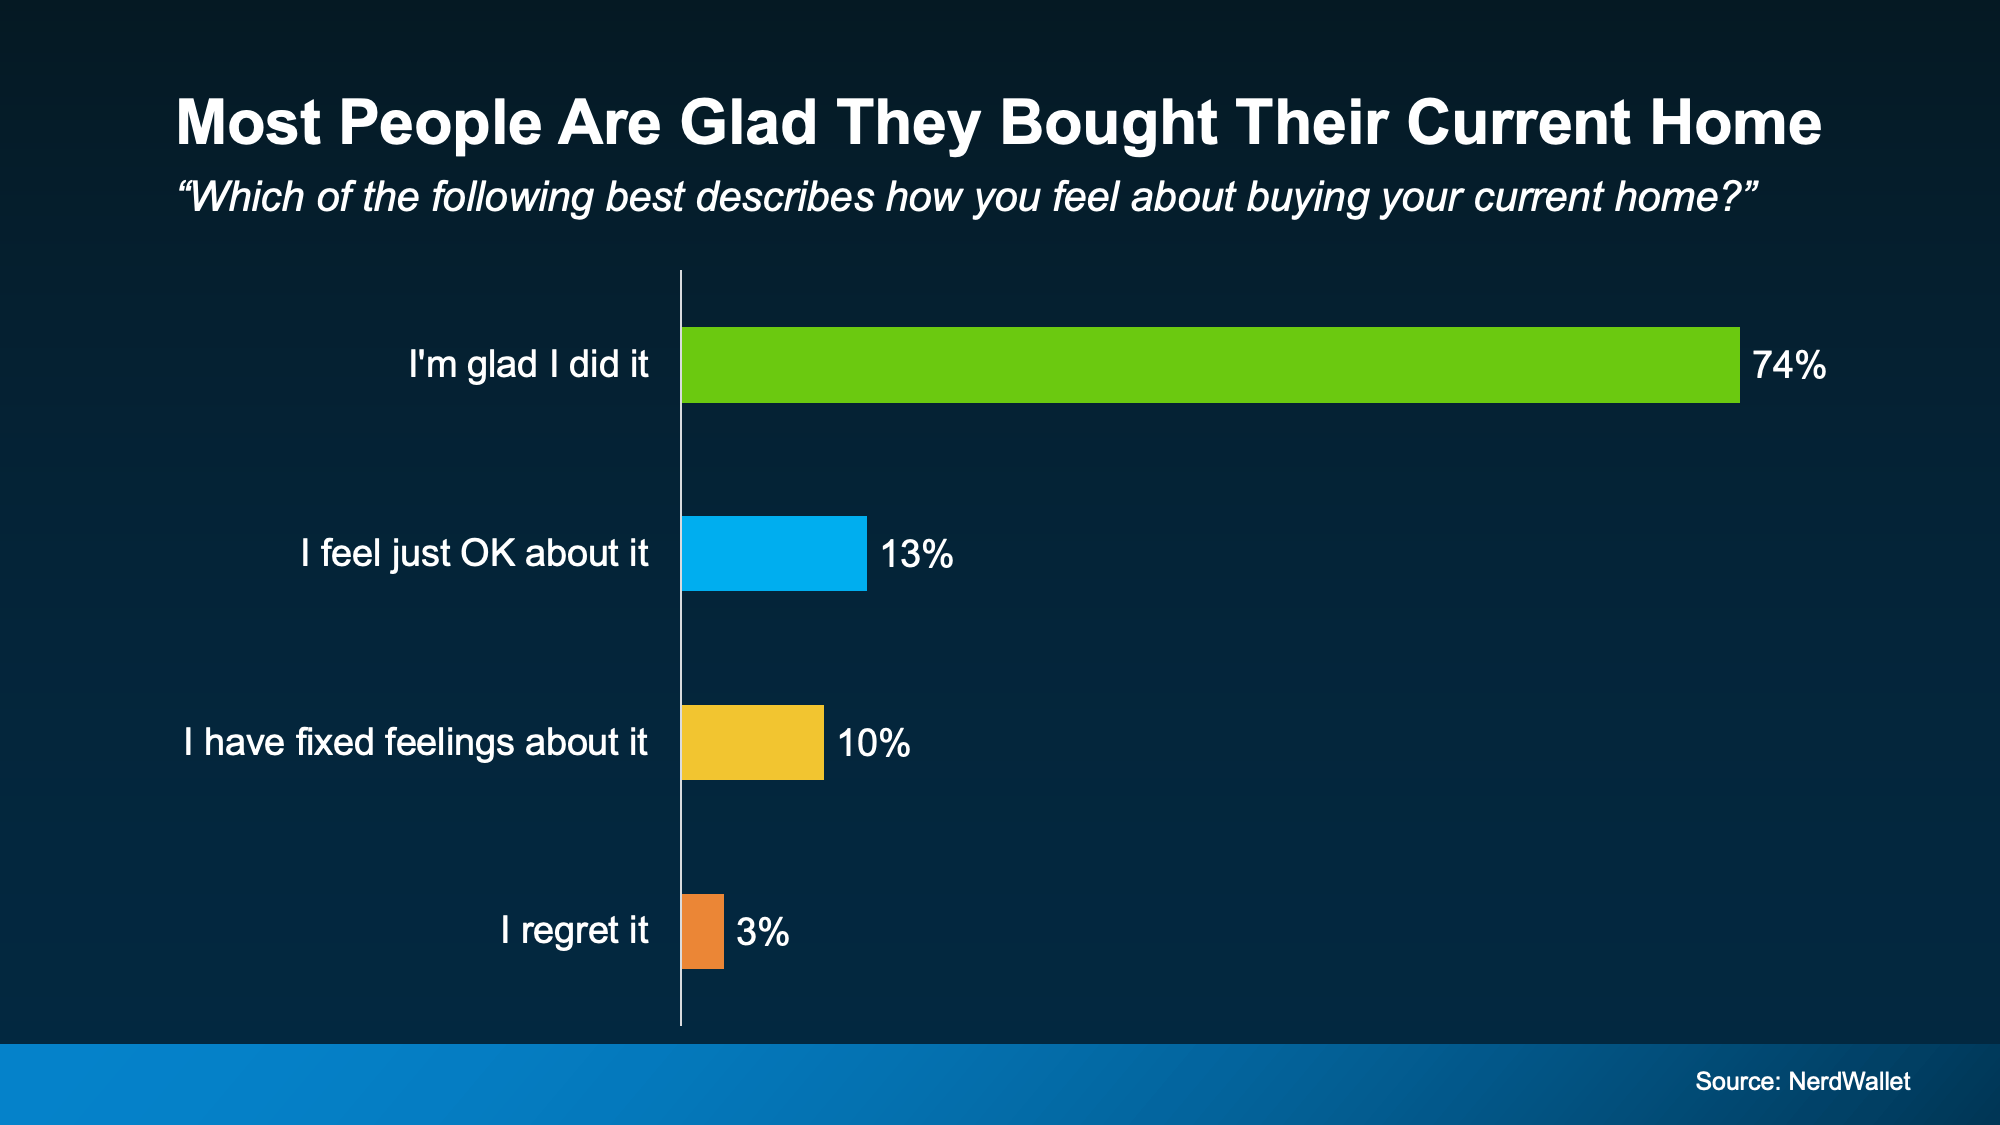
According to a recent survey from NerdWallet, the vast majority of recent buyers (74%) were glad they bought their current home. Only a very small 3% of people regret it:
And here’s a big reason why so many people feel it was worth it, even now.
Homeownership Is a Long-Term Play
When you’re deciding whether to buy, it’s easy to focus on what’s happening right now. What’s today’s mortgage rate? Are prices going up or down? Those things matter. But don’t get so caught up in buying in the perfect moment that you miss the bigger picture.
A home isn’t typically something you buy for just a year or two. It’s a longer-term play. And when you zoom out, it all starts to fall into perspective – especially if you look at home prices and equity.
According to data from the Federal Housing Finance Agency (FHFA), home prices nationally have risen 33.4% over just the past five years (see map below):
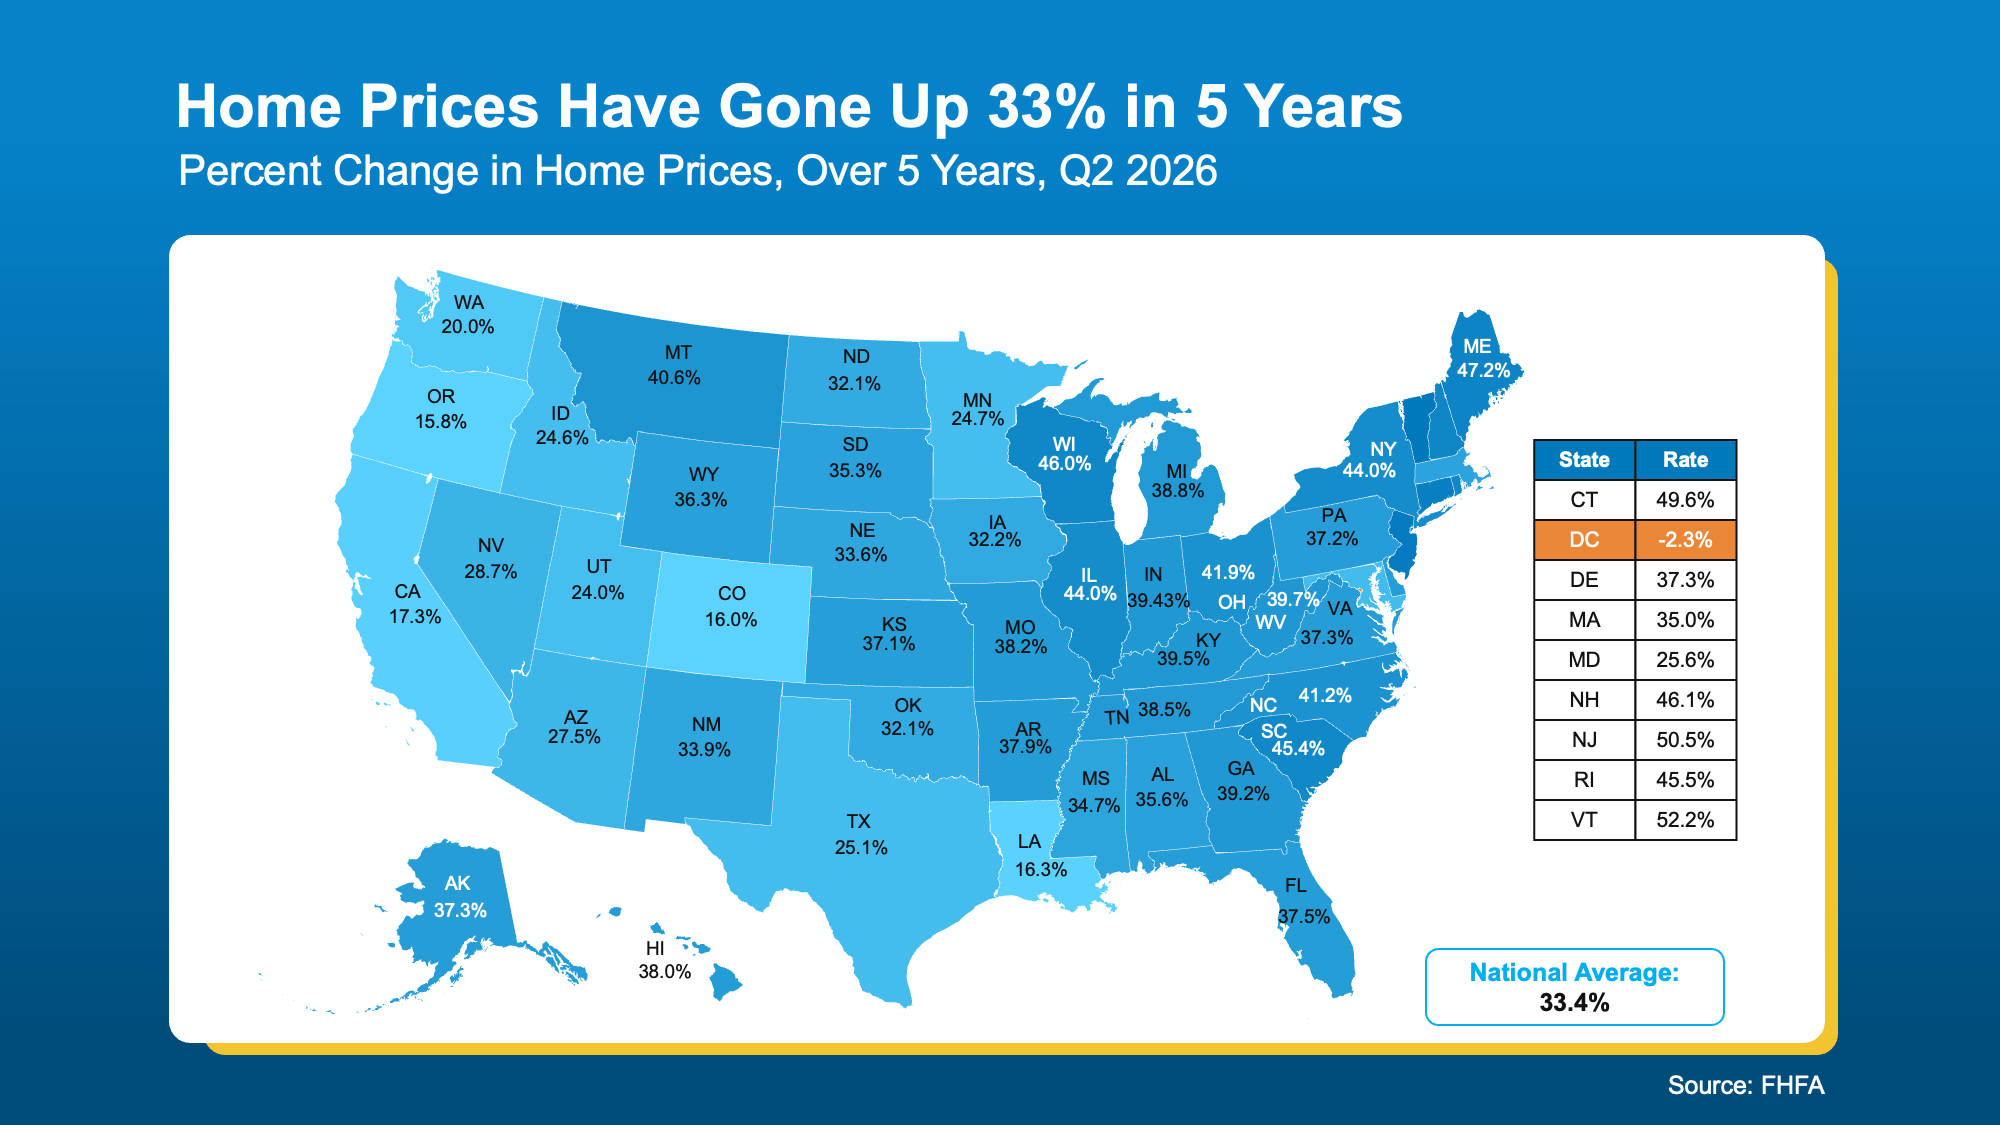
And that appreciation has helped current homeowners build some serious wealth. Research from Bankrate shows homeowners gained an average of nearly $150,000 in wealth over the past five years as equity steadily rose across 90% of major metro areas.
That’s one of the biggest benefits of homeownership. As you pay down your mortgage and your home appreciates over time, your ownership stake – your equity – can grow.
Now, Zoom Out Even Further
The five-year numbers are impressive. But the numbers get even more dramatic when you look at decades instead of individual market cycles.
FHFA data shows home prices nationally have risen 336% since 1991. Sit with that for a second. Three hundred percent (see map below):
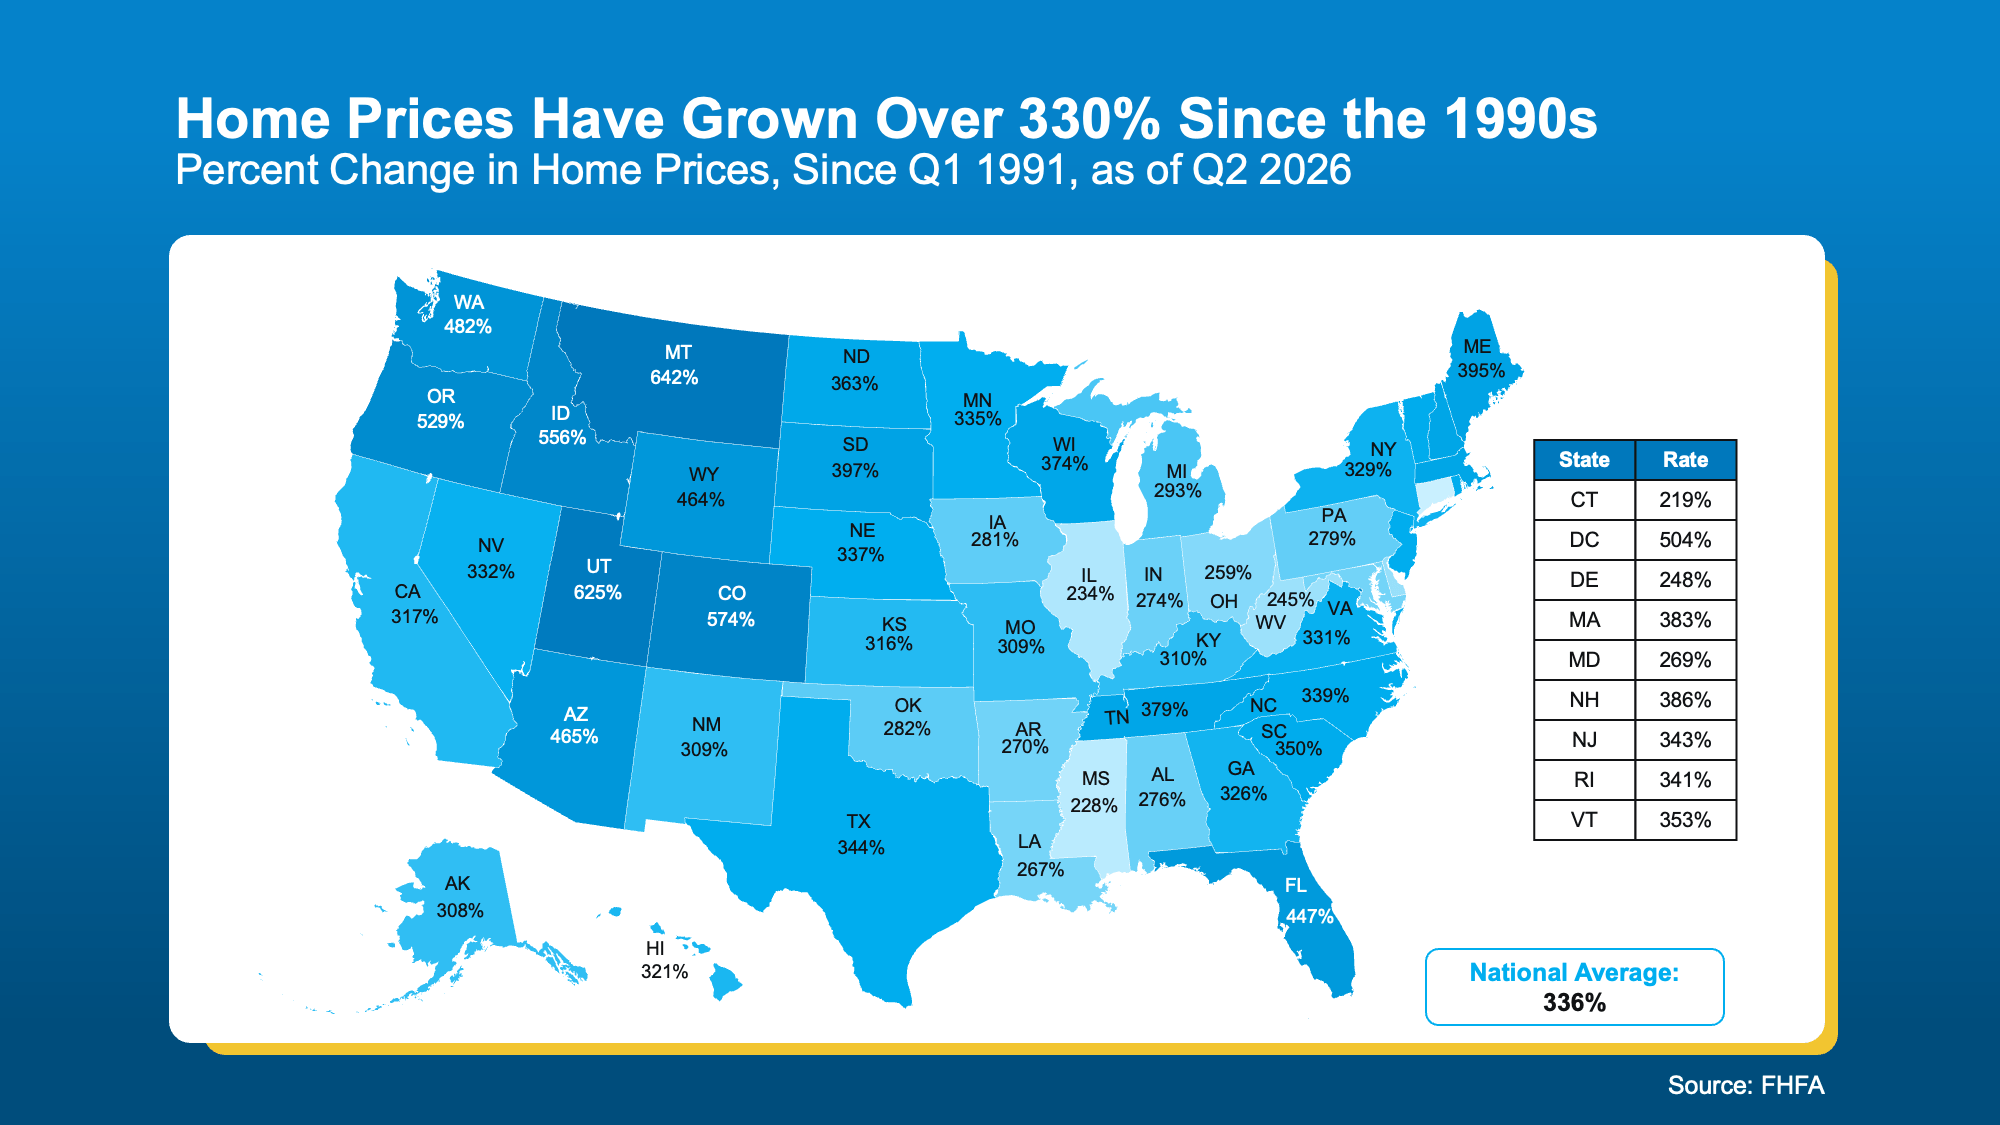
That doesn’t mean prices go up every single year. And it doesn’t mean buying is automatically the right decision for everyone today. You should only buy when the numbers (and the payment) work for you.
What it does show is why trying to perfectly time the market can make you miss the bigger picture.
Over time, homeowners gain a lot of equity. And that equity can eventually become a powerful financial resource. As Freddie Mac explains:
“Your home’s equity is part of your total wealth as a homeowner. If you decide to sell your home, the equity you have built over time will come back to you in the sale. . .
If it’s time to upsize or downsize, you can use that cash for the down payment on your next home.”
Basically, if you can afford to do it, buying a home now could set you up for future moves.
And just in case you’re someone who’s worried about what happens if prices do fall, after you buy, remember: you’re not buying for one year.
Prices can dip. They have before. But historically, they’ve risen far more over the long run. And the longer you own your home, the more time you have to ride out those ups and downs and keep building equity.
Bottom Line
Don’t let today’s uncertainty make you lose sight of what homeownership can do over time. Most homeowners say they’d make the same choice again. And decades of home-price growth help explain why.
If you’re wondering whether buying makes sense for you right now, connect with an agent to look at the numbers together – and what owning a home could mean for you in the years ahead.
You’ve probably heard the Federal Reserve (the Fed) is raising rates again. And if you’re planning to buy or sell a house, you may be wondering what that means for you.
With all the headlines, it’s easy to think the Fed sets mortgage rates. That’s actually a common myth. But the Fed’s decisions can still have an impact on them.
So, where does that leave you? The next few months could get a little bumpy. But the Fed is playing the long game. And with the right plan, you can still make a move that works. Let’s break it down.
Why the Fed Is Raising Rates
It all comes back to inflation. With prices rising fast, everything is getting more expensive – and that leaves buyers with less spending power and makes homes cost more to build.
So, the Fed raises its key short-term rate (the Federal Funds Rate) to slow down inflation. And that’s where a lot of people get tripped up.
-
MYTH: The Fed controls mortgage rates.
-
REALITY: The Fed has an impact on mortgage rates, but it’s only one piece of the puzzle.
As NerdWallet explains:
“The Federal Reserve influences mortgage rates, but doesn’t set them. . . Mortgage rates are influenced by many elements, including the inflation rate, the pace of job creation, and whether the economy is growing or shrinking. The Federal Reserve’s monetary policy is a factor, too . . .”
Here’s the simplest way to explain how it all fits together. Mortgage rates tend to follow something called the 10-year treasury yield. That’s the return investors get for lending money to the government for 10 years. And that yield moves up and down based on what investors expect from inflation and the economy.
Right now, one of the biggest things moving that yield is the conflict in Iran. It’s pushed oil prices higher, which has investors worried about inflation. That’s why any news about the conflict can move mortgage rates. If there’s resolution in Iran, that could take some pressure off inflation and mortgage rates. But the timing is hard to predict.
What the Fed does can move that yield, too. When they hike the Federal Funds Rate to fight inflation, investors pay attention. That can push the 10-year yield up, and mortgage rates usually follow. But once inflation cools, the yield has room to come back down, and mortgage rates can, too. That gives buyers some of their purchasing power back (see graphic below):
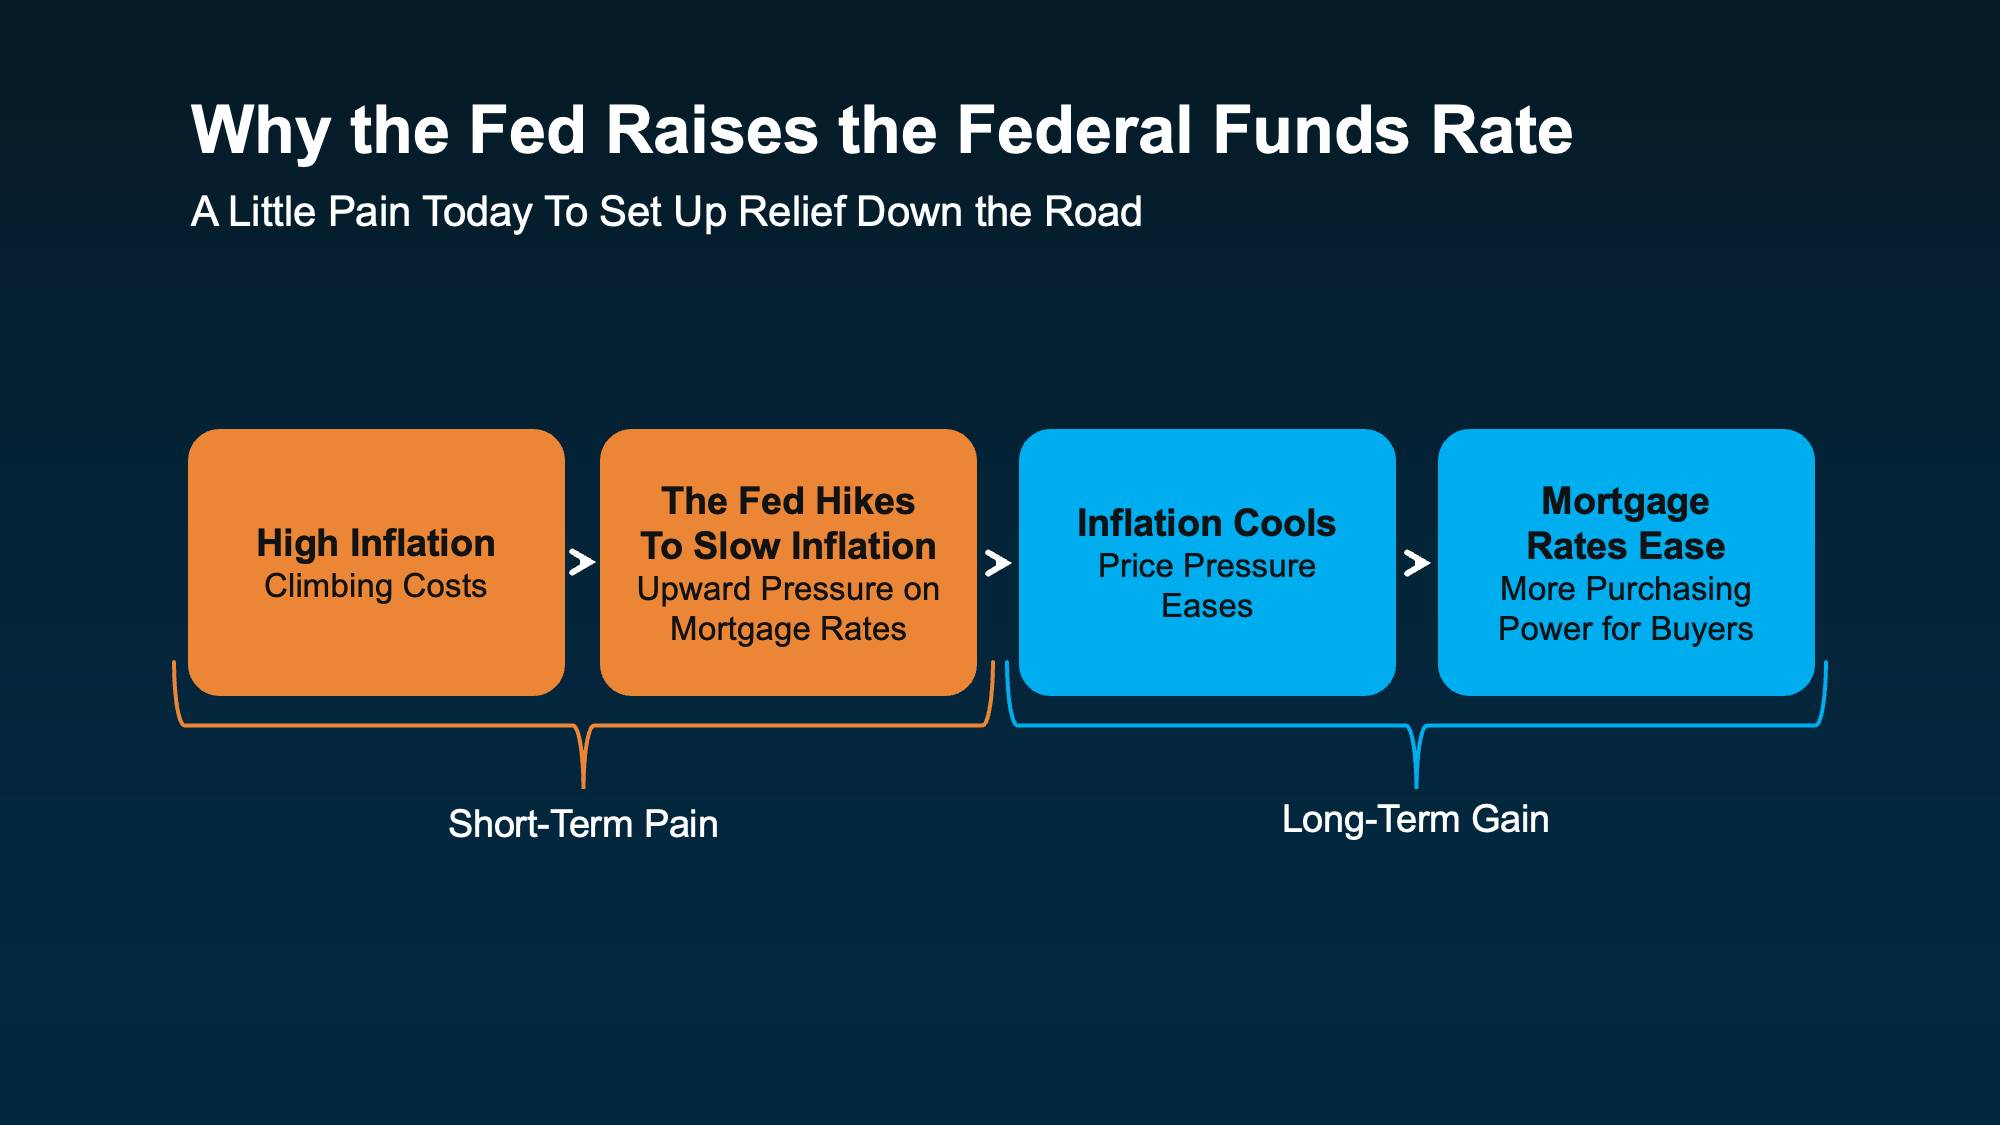
Think of it as a little pain today to set up some relief down the road. But how long could that short-term pain last? A lot depends on what the Fed does next.
There’s a Strong Possibility the Fed Will Hike Again This Year
According to CME FedWatch, there’s over an 80% chance the Fed hikes their federal funds rate at least once more before the end of 2026 (see graph below):

Remember, the Fed doesn’t set mortgage rates. But another hike will likely keep upward pressure on them in the short term. So, should you wait it out? Sam Williamson, Senior Economist at First American, says this:
“Over time, firmer Fed action could help steady the bond market and open the door to lower mortgage rates, but only if investors become more confident that inflation is coming under control.“
And there are some early signs that’s starting to happen. Inflation cooled faster than experts expected in August:
-
PCE inflation dropped to 3.4%, down from 3.7% in July.
-
Core PCE (the Fed’s preferred measure which leaves out food and energy prices) fell to 3%, down from 3.3%.
That’s a step in the right direction, and it’s part of why the odds of a hike at the Fed’s October meeting have come down recently. But inflation’s still above the Fed’s 2% target, and it’s been that way for about 5 years. So, lower rates could still take a while. Your best bet is a plan that works at today’s rates.
How To Make Your Move Work Right Now
While this rate hike cycle isn’t the headline you want to see, it doesn’t mean you have to wait. There are still ways to move, even now.
-
If you’re buying: Get pre-approved so you know your real budget. Ask your lender about your options to get the best rate possible. And once you’re under contract, lock your rate so a jump before closing doesn’t raise your payment.
-
If you’re selling: Decide what matters most to you – a quick sale or top dollar. Each one can call for a different plan. Price for today’s buyers, whose budgets are smaller with higher rates. And think about offering a rate buydown or other concession. They can do more for a buyer’s budget than a price cut.
Bottom Line
The Fed doesn’t set mortgage rates, but its hikes can keep them higher for a while. The goal is to bring inflation, and eventually rates, down over time. With more hikes likely this year, waiting may not pay off. So, connect with a local real estate agent to map out a plan that works at today’s rates.
For a lot of first-time buyers, owning a home can feel perpetually a few years out of reach. Saving for a down payment takes time, and each year you spend renting can make owning feel further off.
But buying your first home doesn’t have to happen to feel like a far away goal. Two choices you control can bring your first home years closer, even with affordability as tight as it is right now.
How Long Buying Really Takes
First, one quick definition. “Breaking even” is the point where owning has cost you about the same as renting would have over the same period. And after that point, owning starts to cost less than renting. Kara Ng, Senior Economist at Zillow, puts it this way:
“Buyers should think about not just when they can afford to buy, but how long they’d need to stay before owning makes more financial sense than renting.“
So how long does reaching that point usually take? And what are the shortcuts? Let’s do the math.
According to Zillow, it usually takes about 8.5 years to save for a 20% down payment, then roughly 6.2 more years before owning costs the same as renting. Together, that’s just under 15 years. But that math relies on two assumptions: that you’re buying a mid-priced home, and that you’re putting 20% down.
Change either one and your timeline gets shorter. Change both and it can shrink fast. It also varies widely by market, since local prices and rents are different depending on where you live.
A Starter Home Can Get You There Twice as Fast
A starter home usually means a home in the lower third of local prices. They’re often condos, townhomes, or single-family homes a little smaller or older than others in the area.
Choosing one over a mid-priced home can cut your wait down by a lot. And while that might sound obvious, you may not realize just how much it shortens your timeline. Because if you’re buying a more affordable home, you don’t have to save up as much or as long.
Zillow found that nationwide, a starter home takes half the time – about 7.2 years – to save for and come out ahead on, compared with renting (see graph below):
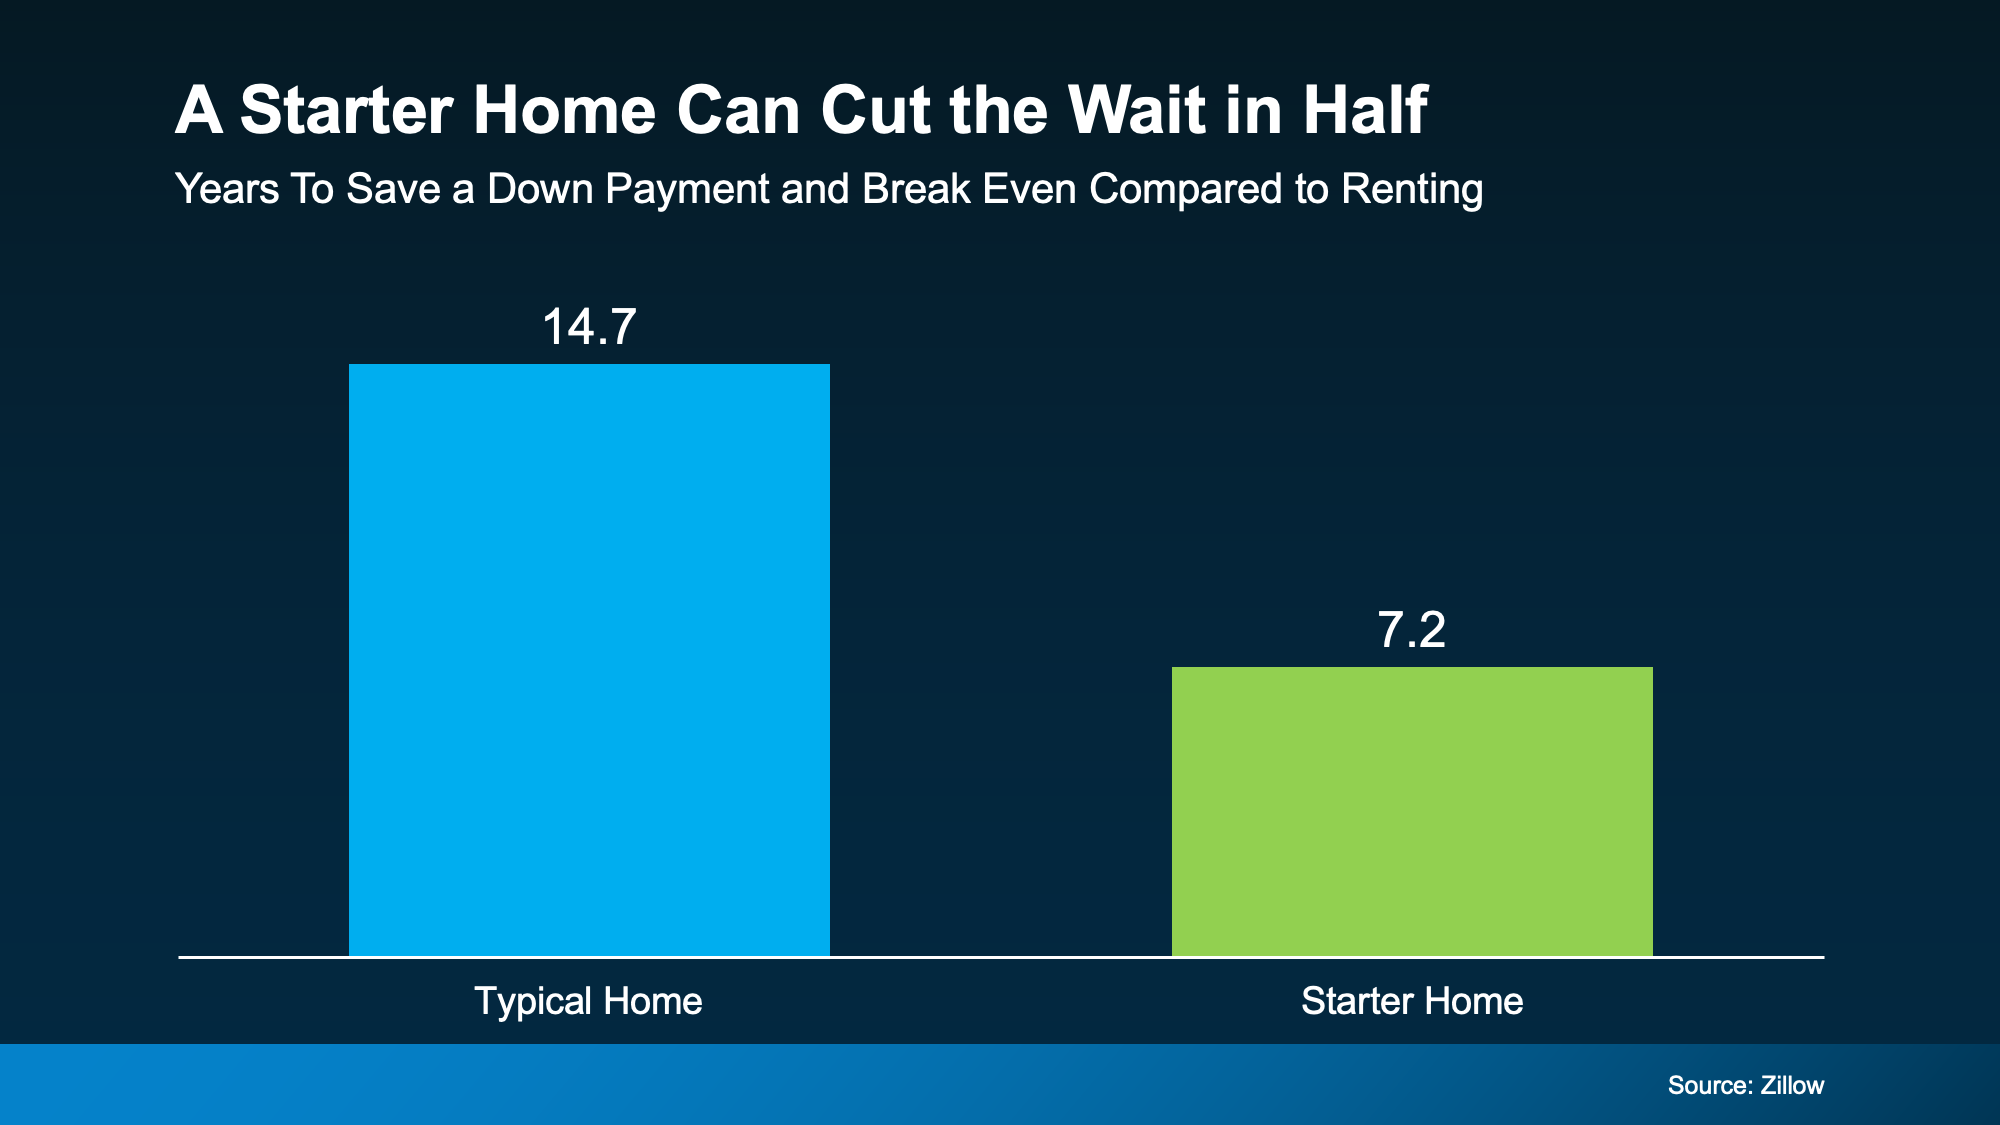
That works out to about 4.6 years to save and 2.6 years to break even. It won’t erase every affordability challenge, but it can take years off the wait. And if you’ve already been saving for a while, it could get you closer to making it a reality.
You Usually Don’t Need To Put 20% Down
You, like many first-time homebuyers, might assume you need a 20% down payment to even consider buying. But a lot of the time, you don’t.
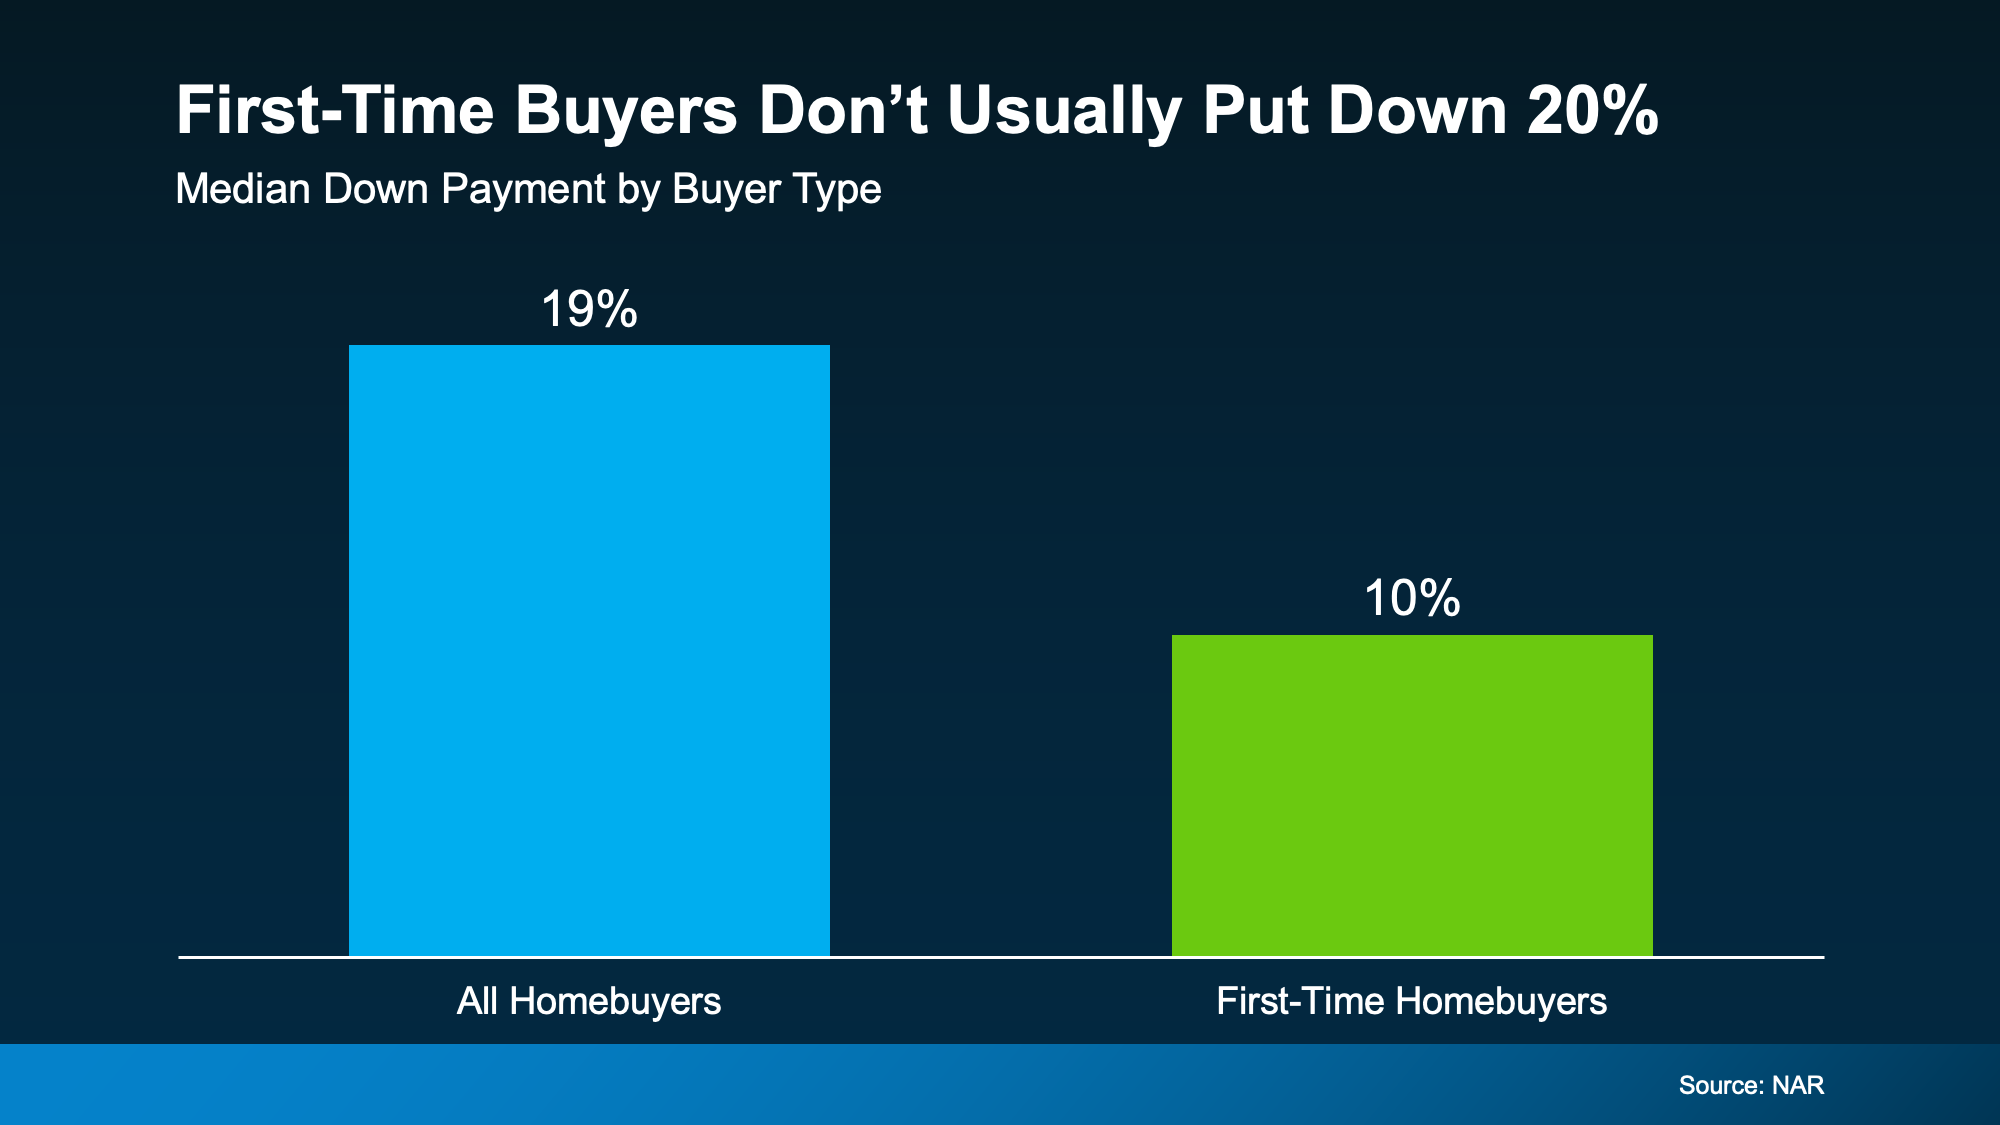
Most first-time buyers don’t put down anywhere near that. The National Association of Realtors shows the median down payment for first-time buyers is 10% (see graph below):
And the minimums go lower still. Some buyers put down as little as 3% on a conventional loan or 3.5% on an FHA loan, and eligible veterans or buyers in certain rural areas can put down nothing at all.
There’s help with the upfront costs of buying, too. Down Payment Resource counts 2,746 assistance programs nationwide, and some are even stackable:
“Some homebuyers can layer multiple sources of assistance to reduce their upfront costs. Layering means combining more than one eligible source of funding as part of your home purchase.”
Put those together – a lower price point, a smaller down payment, and help covering it – and the years you thought you needed start to come down.
Bottom Line
Your first home may not be as far off as it feels. When the numbers make sense for you, buying a starter home and putting down less than 20% can get you there years sooner.
Want to see which starter homes in your area could fit your budget? A local real estate agent can show you.

Why Most People Are Still Glad They Bought a Home

Renovate or Relocate? What To Know Before You Decide To Age in Place

Myth vs. Reality: Does the Fed Control Mortgage Rates?



-

 For Sellers4 weeks ago
Selling This Fall? You Want To Get These 4 Things Right.
-

 Agent Value4 weeks ago
Selling This Fall? You Haven’t Missed Your Window
-

 Affordability3 weeks ago
3 Things You Can Actually Control About Your Mortgage Rate Right Now
-

 Affordability4 weeks ago
The Best Time To Buy a Home in 2026 Is Almost Here
-

 Buying Tips2 weeks ago
Hoping for (or Dreading) a Housing Crash? The Experts Just Weighed In.
-
 Agent Value3 weeks ago
There Are 4 Types of Housing Markets Right Now. Which 1 Are You In?
-

 Affordability3 weeks ago
Why So Many Sellers Are Cutting Their Price Right Now
-
 For Sellers2 weeks ago
What Higher Mortgage Rates Mean for Home Sellers
You must be logged in to post a comment Login