
For Sellers
What You Can Do to Get Your House Ready to Sell [INFOGRAPHIC]
![What You Can Do to Get Your House Ready to Sell [INFOGRAPHIC] | Simplifying The Market](https://lets-talk-real-estate.com/wp-content/uploads/2020/04/20200410-MEM-EN-scaled-1.jpg)
Some Highlights:
- Believe it or not, there are lots of things you can do to prep your house for a sale without even going to the store.
- Your real estate plans don’t have to be completely on hold even while we’ve hit the pause button on other parts of daily life.
- Tackling small projects from cleaning the corners you may normally skip to tidying up your yard are easy and necessary wins if you’re thinking of listing your house and making a move.

After more than a year of headlines talking about how home prices are going to crash, the latest data shows that price growth may be starting to pick back up again. And depending on whether you’re buying or selling, that shift means something different for you.
The Numbers May Be Starting To Turn
For the past couple of years, home price growth has been moderating – cooling from around 7% in mid-2024, according to Redfin (see graph below). But look at the right side of that graph. The pace of that growth appears to have hit its low point and started to turn.
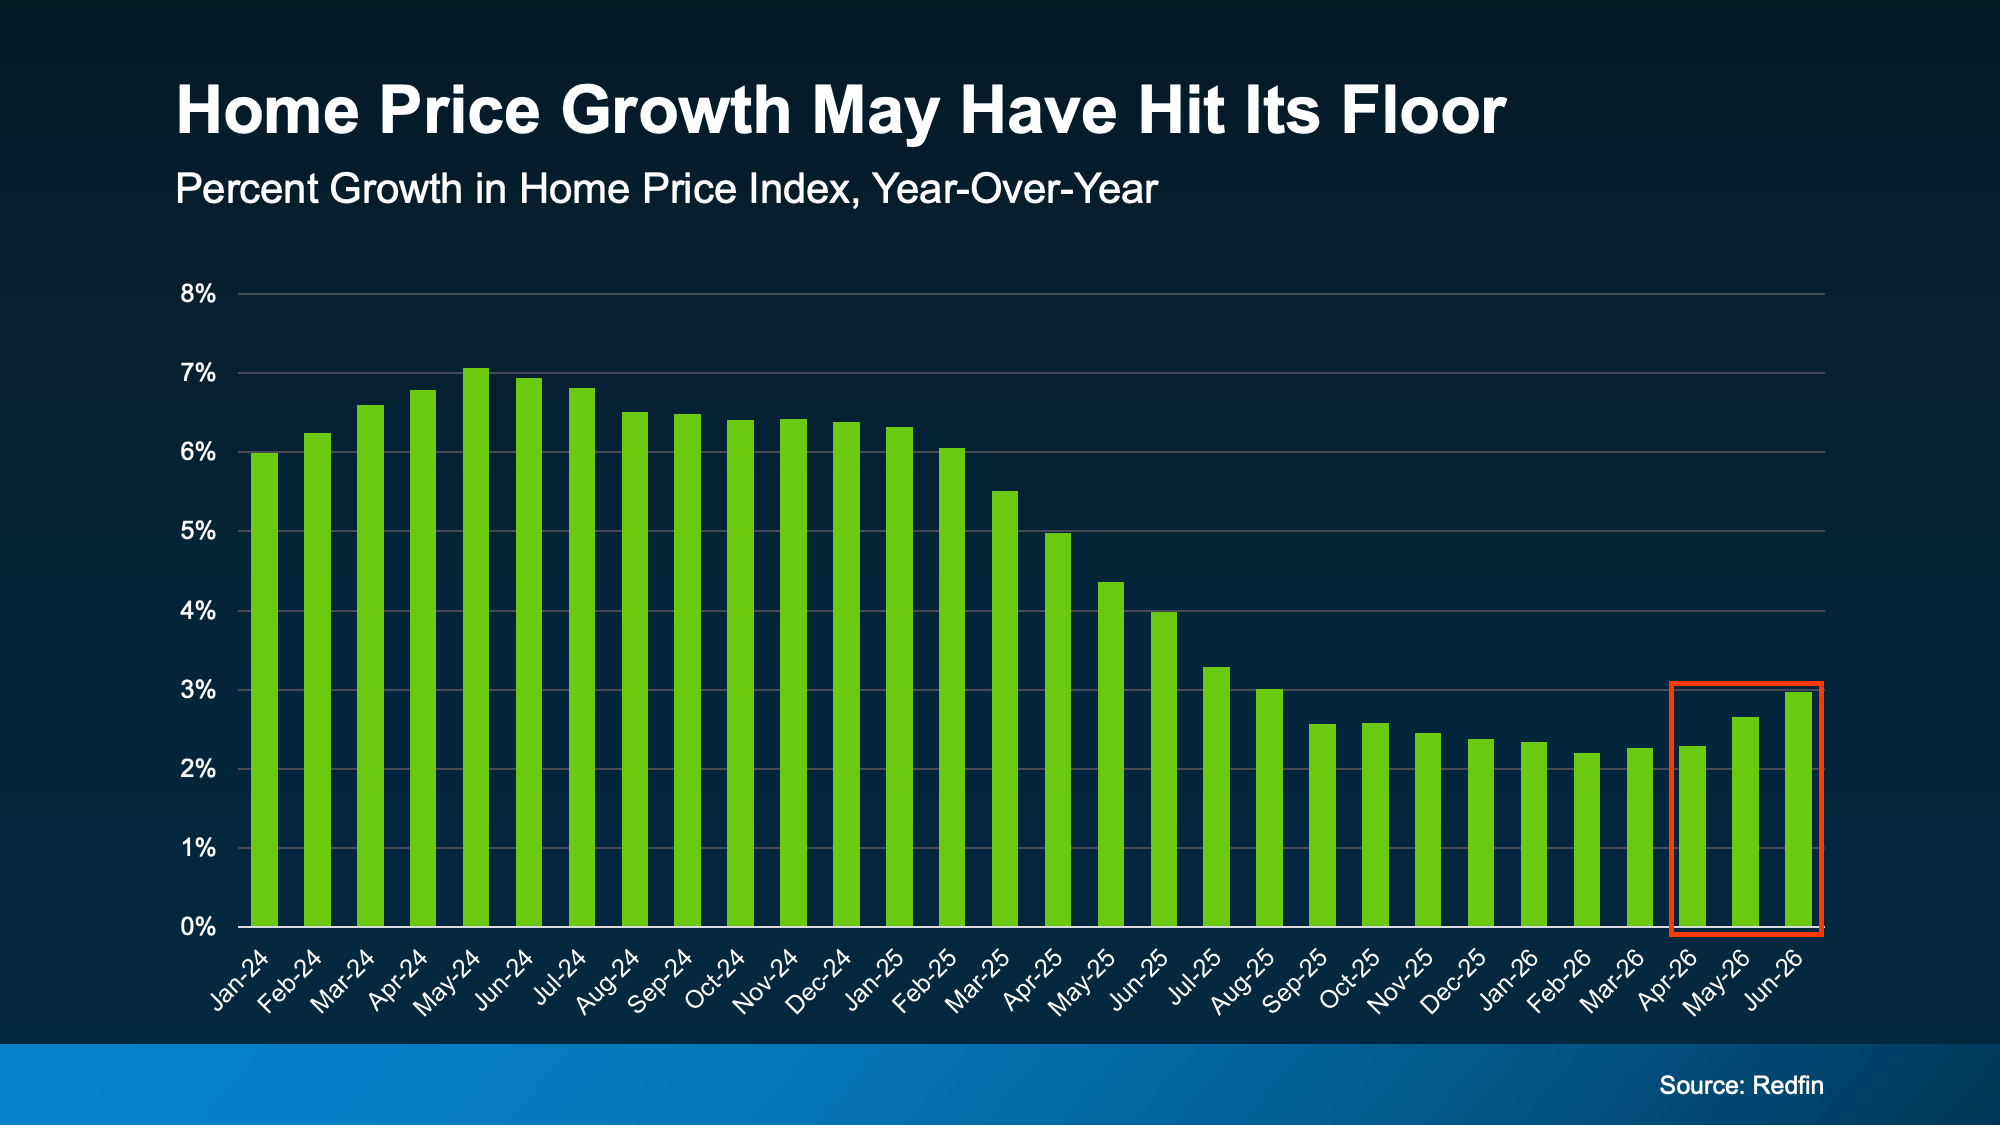
While a couple months of data doesn’t necessarily mean this will be a lasting trend, there are some other signs that this could continue.
For example, fewer markets are seeing prices decline. According to ResiClub and Zillow, about 36% of the 300 largest housing markets had falling prices as of the middle of last year. Since the start of this year, that share has been shrinking. Now? Only 23% are experiencing those mild dips (see graph below):
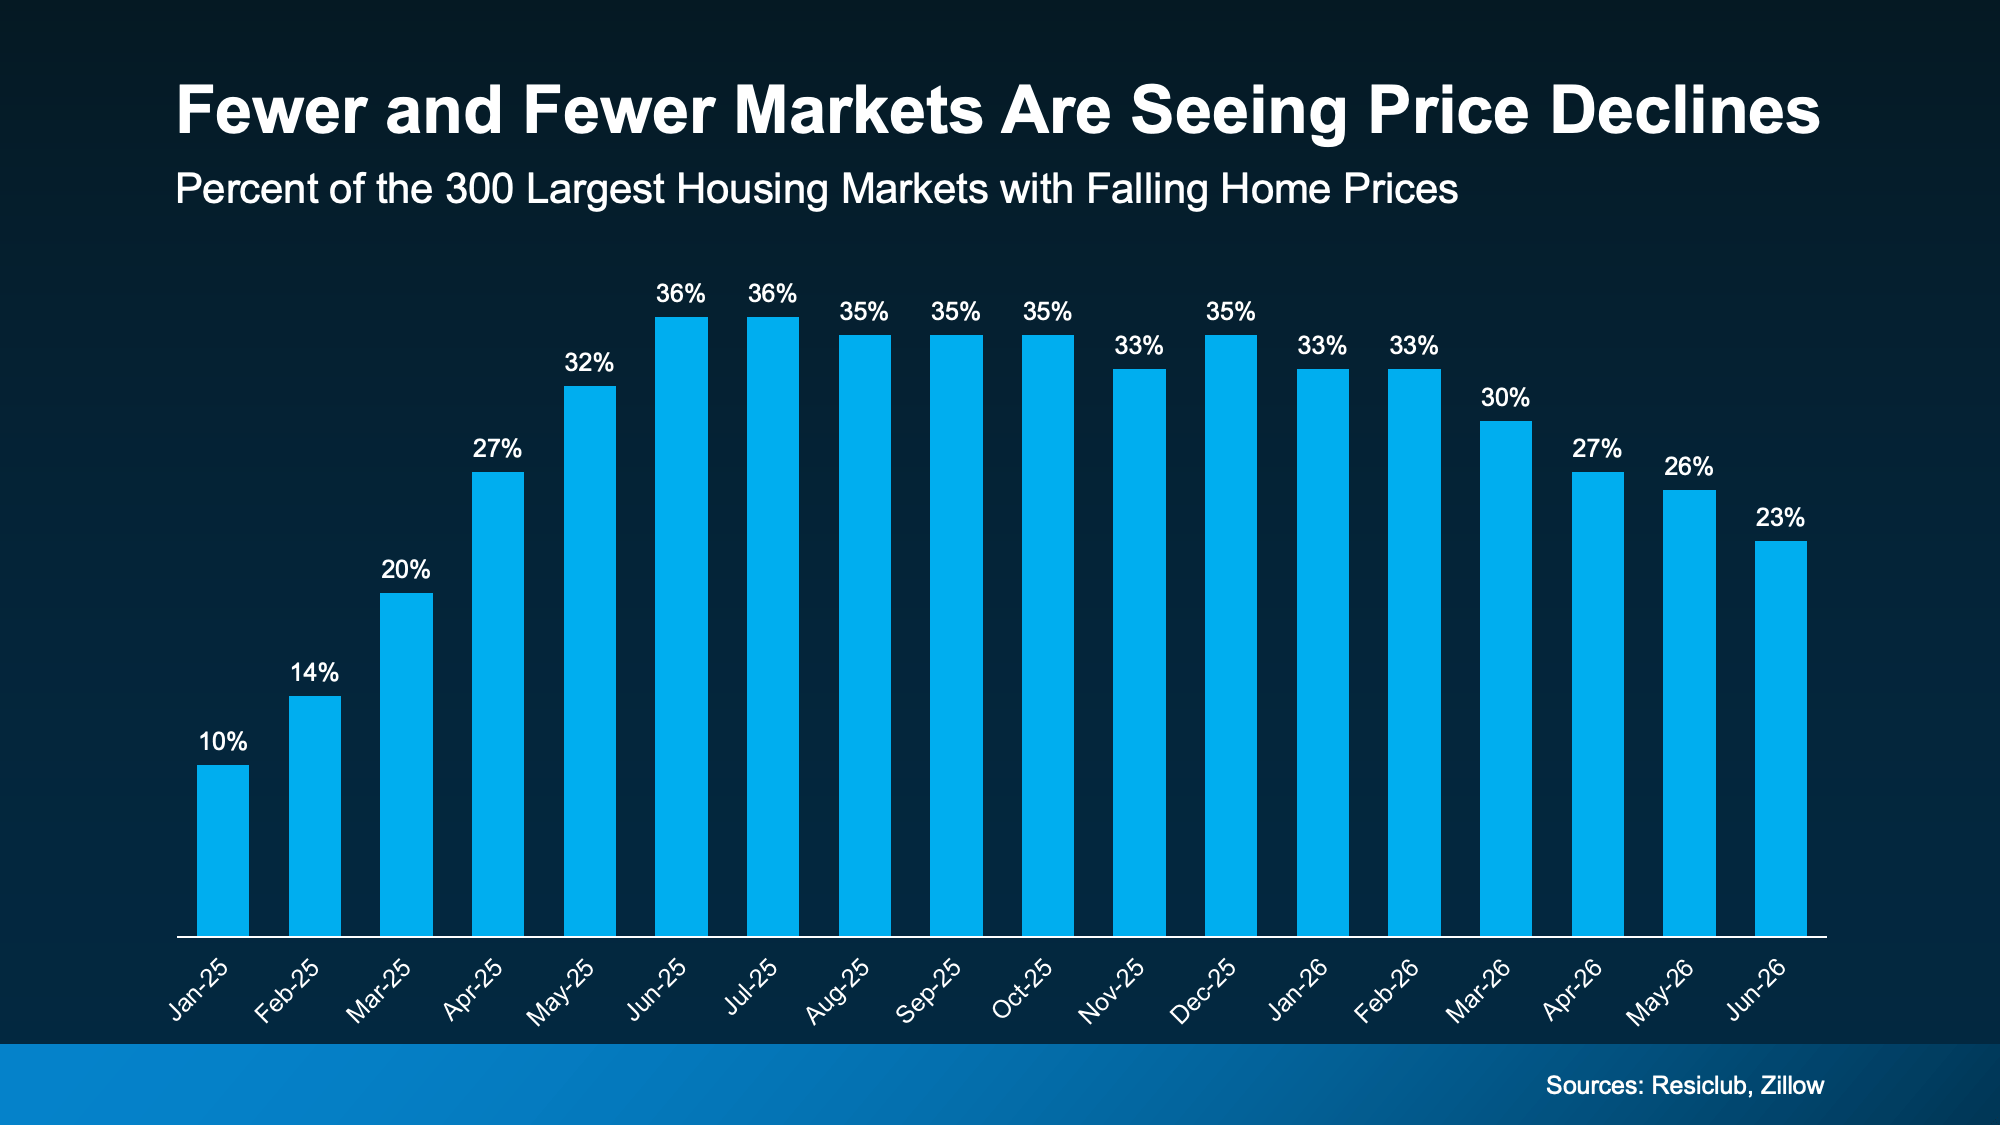
When fewer markets see prices falling, that means more markets are seeing prices rise again.
And forecasts suggest this shift has room to run. On average, experts project home prices will rise about 2.3% nationally this year. And for that to happen, price growth would have to pick up a bit in the second half of 2026.
But Remember, Real Estate Is Local
While it looks like national prices may be starting to pick back up a tiny bit, that doesn’t mean that’s what’s happening in your neighborhood.
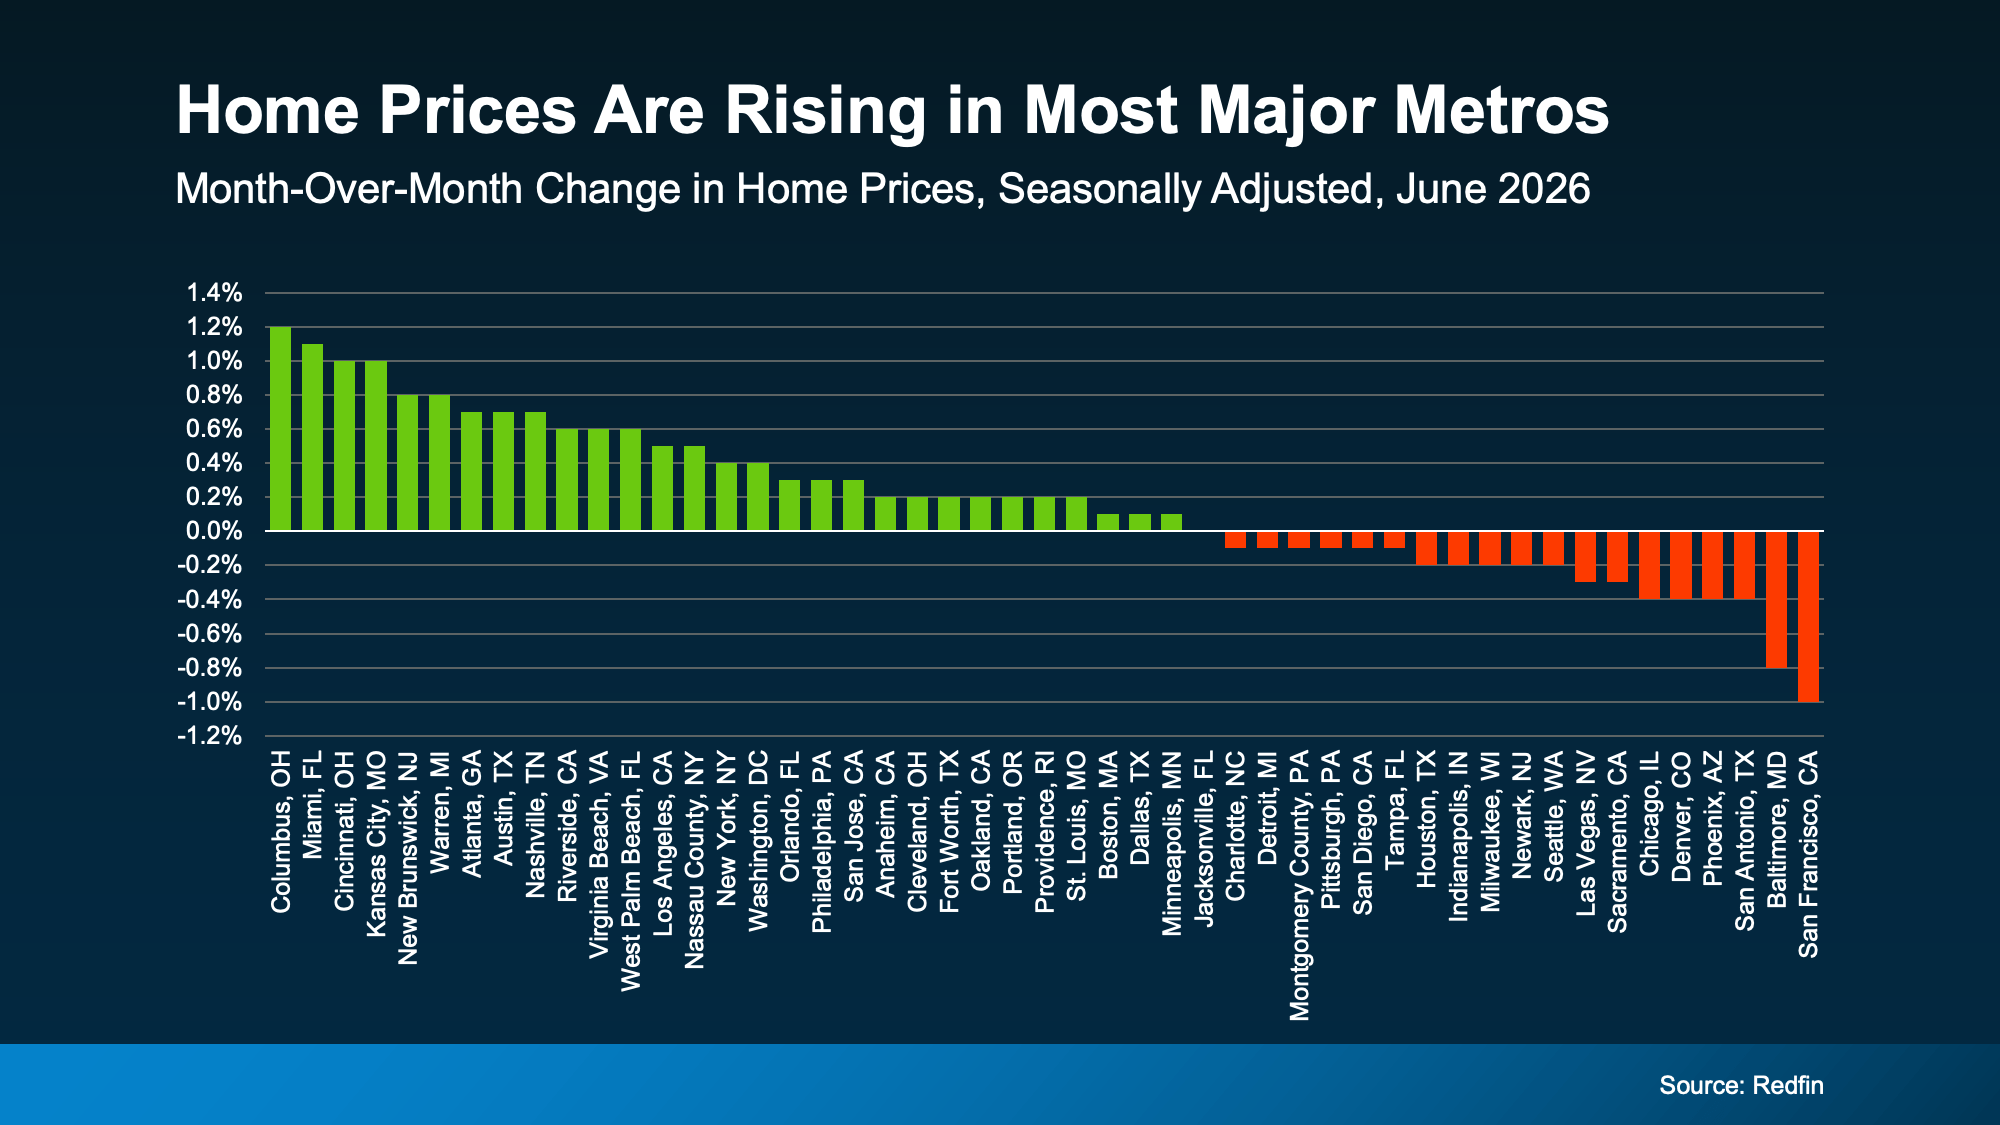
National home prices are really just an average of hundreds of local markets. Some are climbing faster. Others are still cooling. But one reason the national average may be looking up is because a growing number of metros may actually be net positive for prices this year.
Not long ago, the major metros were split about 50/50 – half seeing prices rise and half seeing them fall. Now, that balance looks like it’s starting to tip in a more positive direction. Just last month, more than half of the major metros saw prices go up, according to Redfin (see graph below):
As Selma Hepp, Chief Economist at Cotality, explains:
“. . . local markets continue to tell very different stories. Annual home price growth has changed little since the start of the year, but some markets, especially those supported by strong job and income growth in the West and more affordable Midwest markets, have seen notable acceleration in price gains.”
What This Means for You
Home price headlines can be confusing because they don’t always tell the full picture. Lean on an agent to understand what’s happening in your local market and what the early signs say for where prices may go from here.
That’s the best way to stay one step ahead of the market.
If you’re buying: slower price growth has worked in your favor. You’ve had more room to negotiate and a budget you could plan around. If price growth is picking up in your area, buying now may mean paying less than you would later this year.
If you own a home: you’ve been gaining equity all along, even while growth moderated. If growth keeps picking up, those gains could speed up, too. Lawrence Yun, Chief Economist at the National Association of Realtors (NAR), projects the typical homeowner will gain roughly $16,000 in housing wealth this year. And if you’re thinking about selling, this shift is a good early sign for you. Just remember, the market is still pretty balanced and buyer-friendly in a lot of areas right now.
Home price growth slowed way down, and now it’s showing early signs of picking back up. Whether you’re buying or selling, let’s connect so you can see exactly what prices are doing in our local market and what that means for your plans.
Bottom Line
Home price growth slowed way down, and now it’s showing early signs of picking back up. Whether you’re buying or selling, connect with a local real estate agent so you can see exactly what prices are doing in your local market and what that means for your plans.

If you own a luxury house, you’re in a stronger spot than most sellers right now. While much of the market has cooled, the high-end tier hasn’t. Sale prices and buyer demand are both up. So if you’re considering selling, now could be a great time to make your move.
Luxury Is Leading on Price
Let’s start with prices. But before we get into it – what actually counts as a luxury home? Generally, these are homes in the top 5% price range for the area, so it varies depending on where you live.
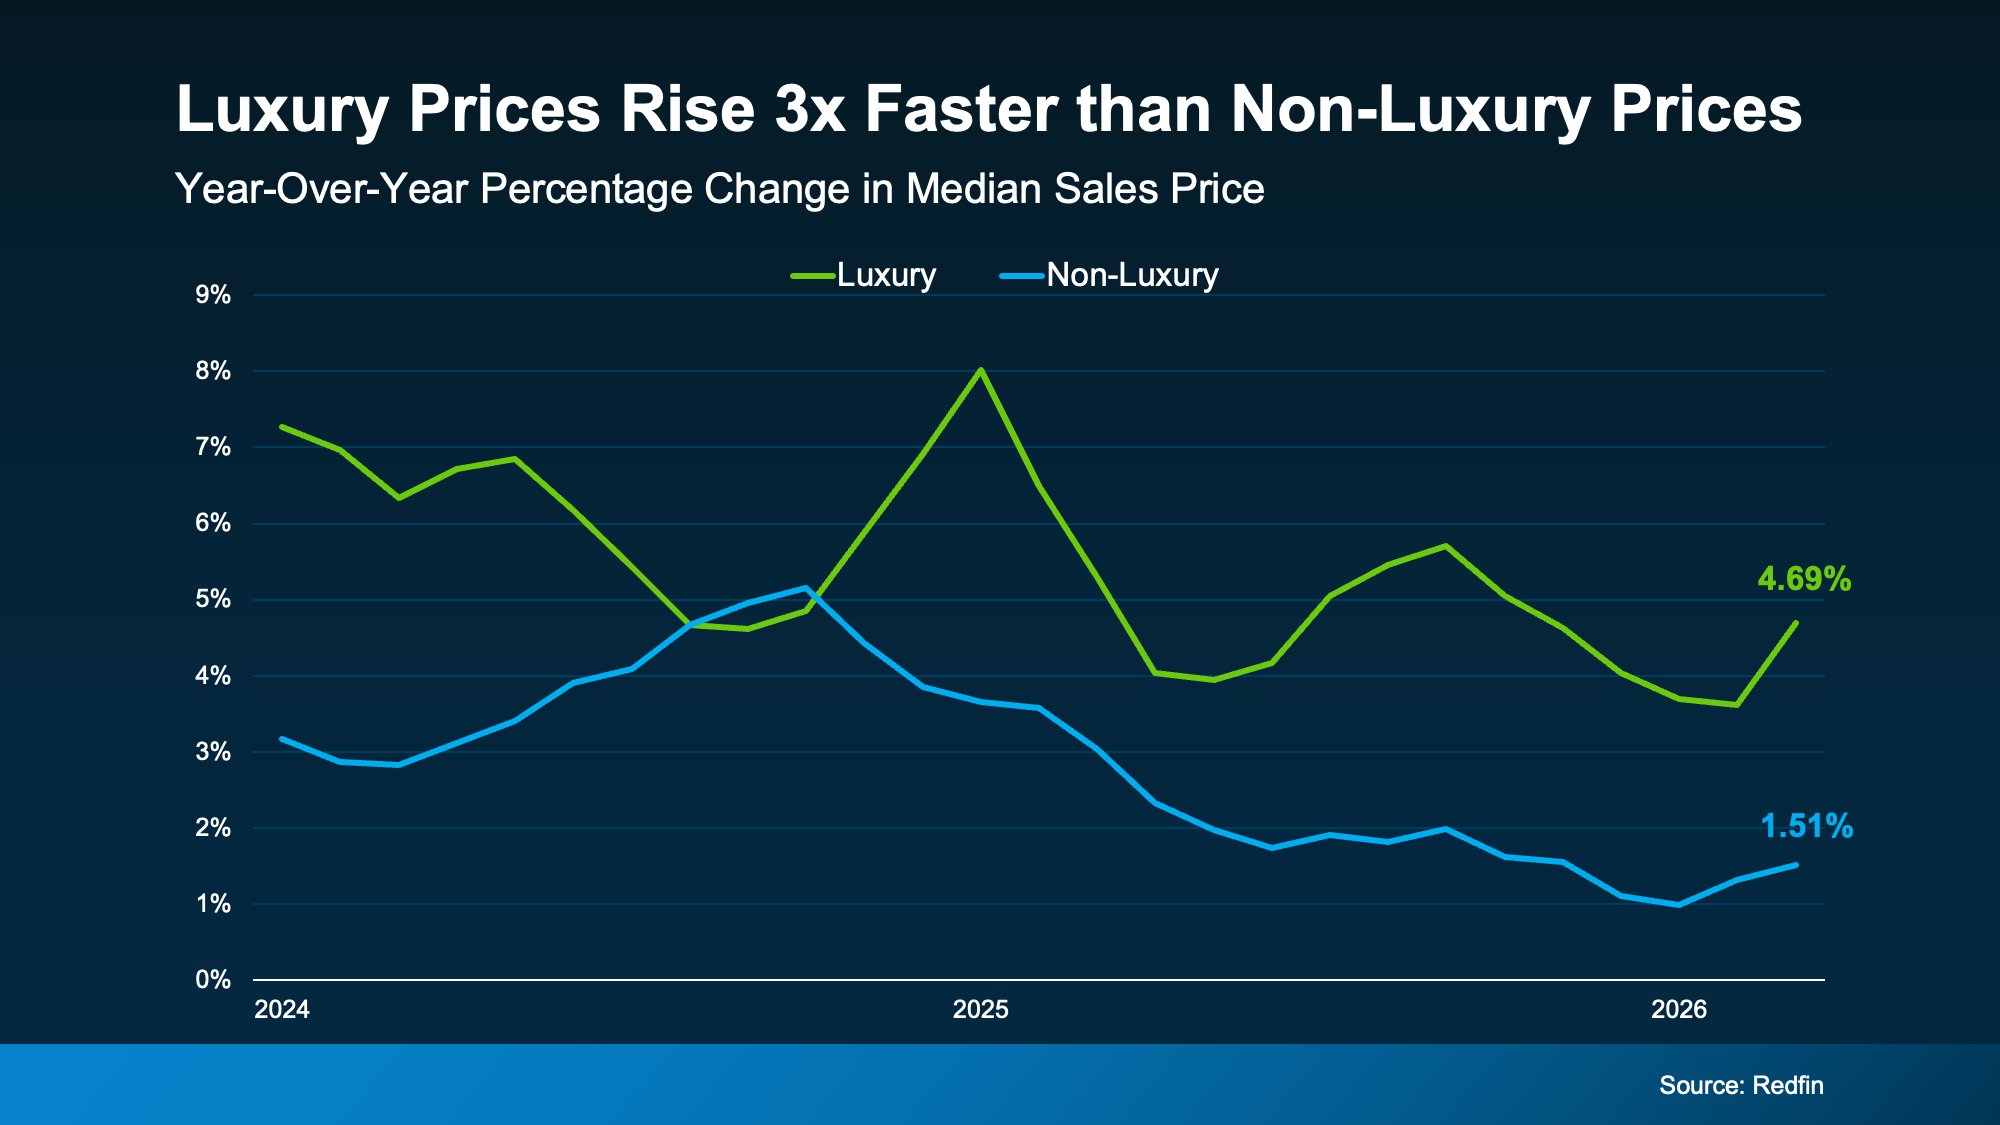
But what’s interesting is that according to the latest data from Redfin, sale prices for luxury houses have risen about three times faster than for non-luxury.
Right now, the typical home’s sale price is up about 1.5% year-over-year. But high-end homes? Their sale prices have gone up nearly 5% since last year (see graph below):
That’s a bigger deal than it sounds like.
Despite all the talk about slowing price growth lately, sale prices in this segment of the market may be rising faster than you’d expect based on the headlines. That’s going to be a good thing if you’re thinking about selling. And rising sale prices are only half the story.
Buyers Are Showing Up, Too
While so many headlines are talking about how buyers are pulling back, that’s not necessarily true when it comes to luxury homes. In fact, right now, it looks like the higher the price point, the more active the buyers.
Lawrence Yun, Chief Economist with the National Association of Realtors (NAR), explains:
“The luxury market has really performed better compared to the lower price point. . . . if we look at price points, any home priced under $250,000, virtually no change in unit sales from one year ago. Then you go into the upper price category, and home sales are up about 10% from one year ago. But the million dollar-plus homes, it is up by 18% from one year ago.“
Basically, more homes are selling on the upper end of the market. A big reason is that high-end buyers tend to feel less of the affordability pressure weighing on many households today, so they keep buying even when the wider market slows.
That demand also means that luxury houses don’t stay on the market as long as they used to.
Luxury Houses Are Selling Relatively Quickly
According to the most recent data from Redfin, for luxury homes the median number of days on market is under 50. That’s much faster than pre-pandemic norms going even as far back as 2014 (see graph below):

That means you probably won’t spend a ton of time sitting in limbo wondering when you’ll get an offer.
Bottom Line
Selling a high-end house is a big decision, and you deserve to feel confident going in. With sale prices climbing and buyers active at the top, this is a strong window to make your move.
When you’re ready to cash in, connect with a local real estate agent to talk strategy.

Remember how exciting it was to buy your first place? It felt like crossing a long-awaited finish line. It gave you a place to build your life. Maybe it’s where you lived when you got married. Or where you welcomed a child or a pet into the family.
But that was just the beginning.
For most people, your first house was never meant to be your forever home. It’s a stepping stone for what comes next.
And if your life looks different today than it did when you got the keys, you’re not stuck. Moving may be more realistic than you think.
Starter Home Inventory Is Still Relatively Low
If you’ve been wondering whether now is the right time to move up, here’s something worth knowing. Starter homes remain one of the hardest types of homes to find. And that’s good news if you’re thinking about selling your first place.
Historically, we haven’t been building enough homes for first-time buyers. And even though homebuilders have shifted more attention toward smaller, entry-level homes lately, the Census shows there’s a long way to go to re-build supply (see graph below):
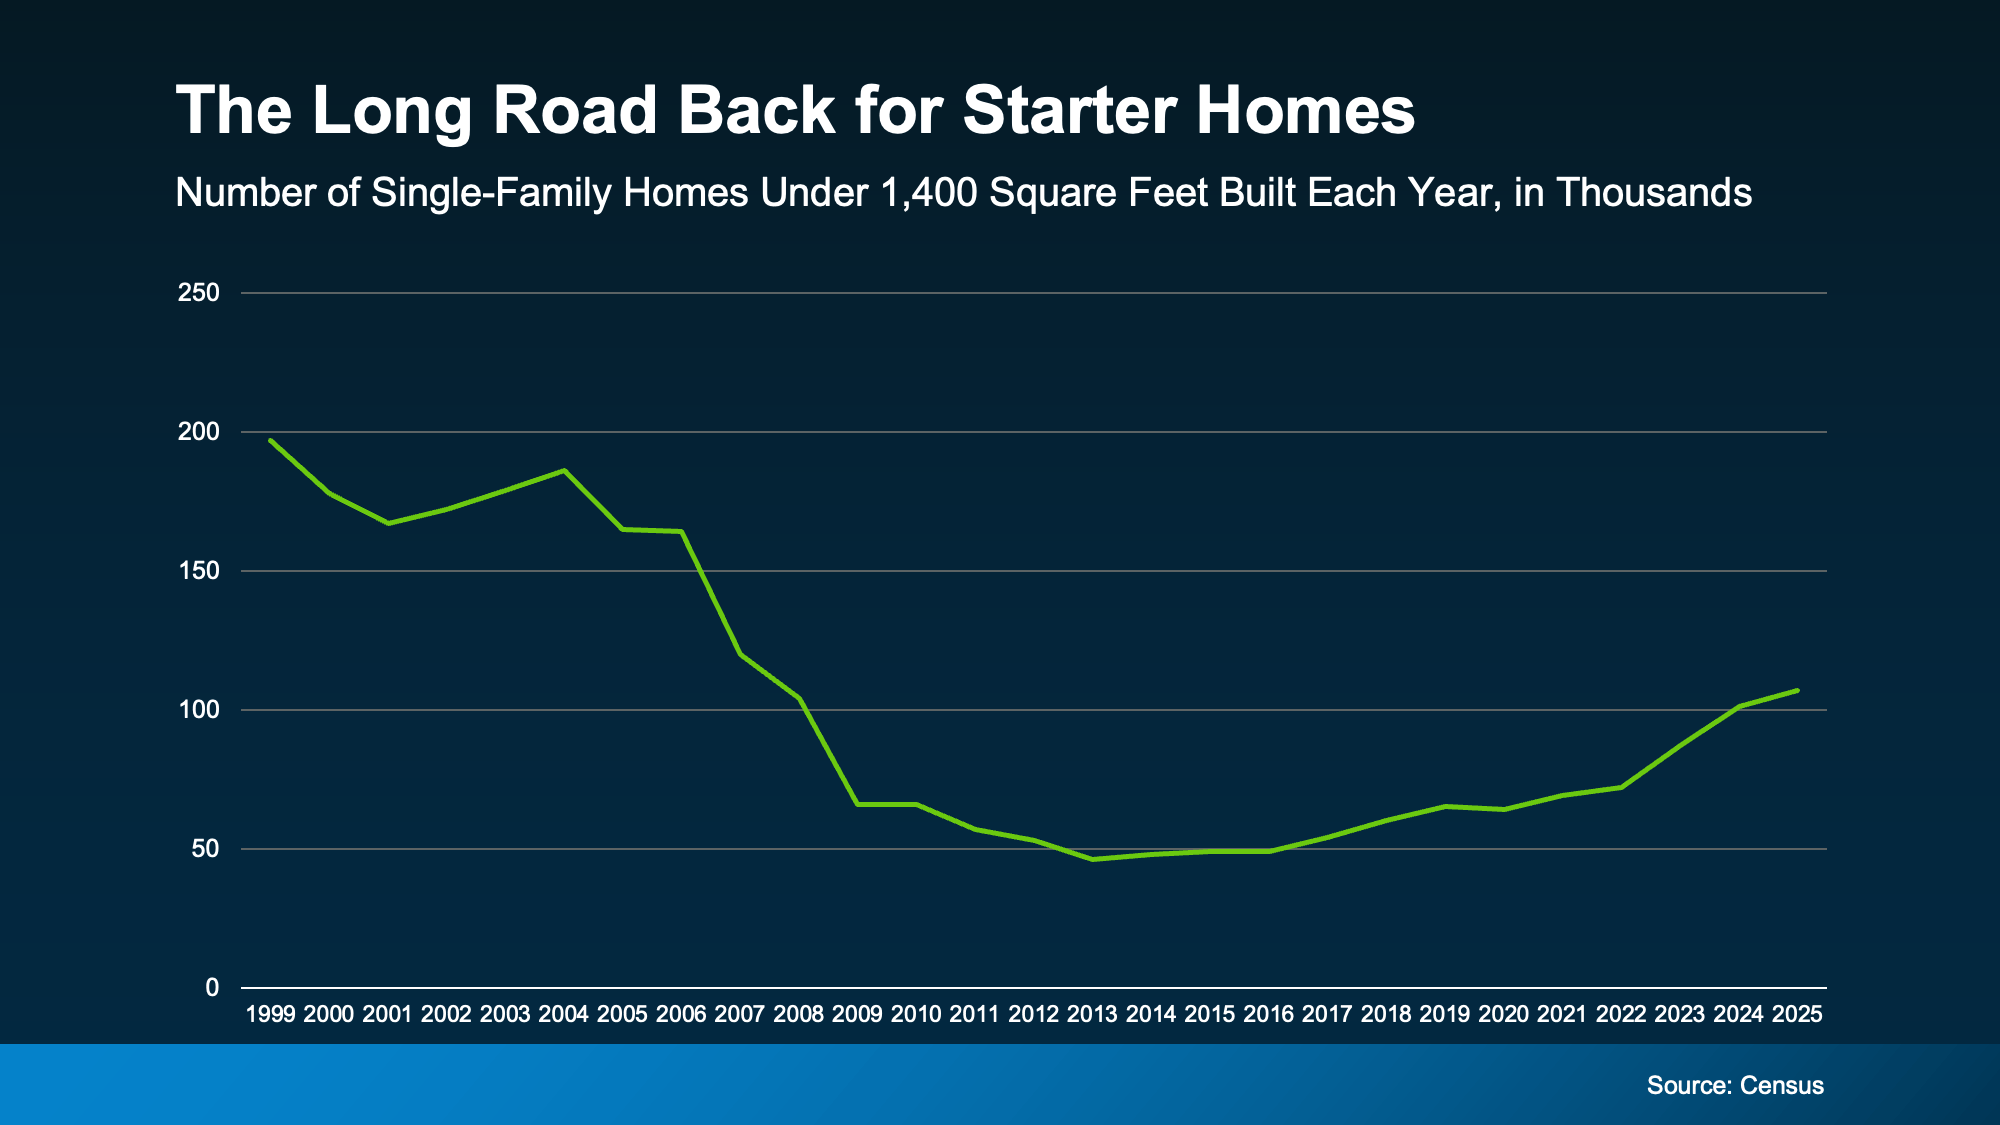
That means your current house is in demand – and that’s a dream scenario for sellers. But that’s only half the story. You also need somewhere to go.
There Are More Move-Up Homes on the Market
Here’s where this gets interesting. While the supply of starter homes remains tight (the green line), data from Redfin shows that the number of homes for sale has been climbing overall (the blue line):
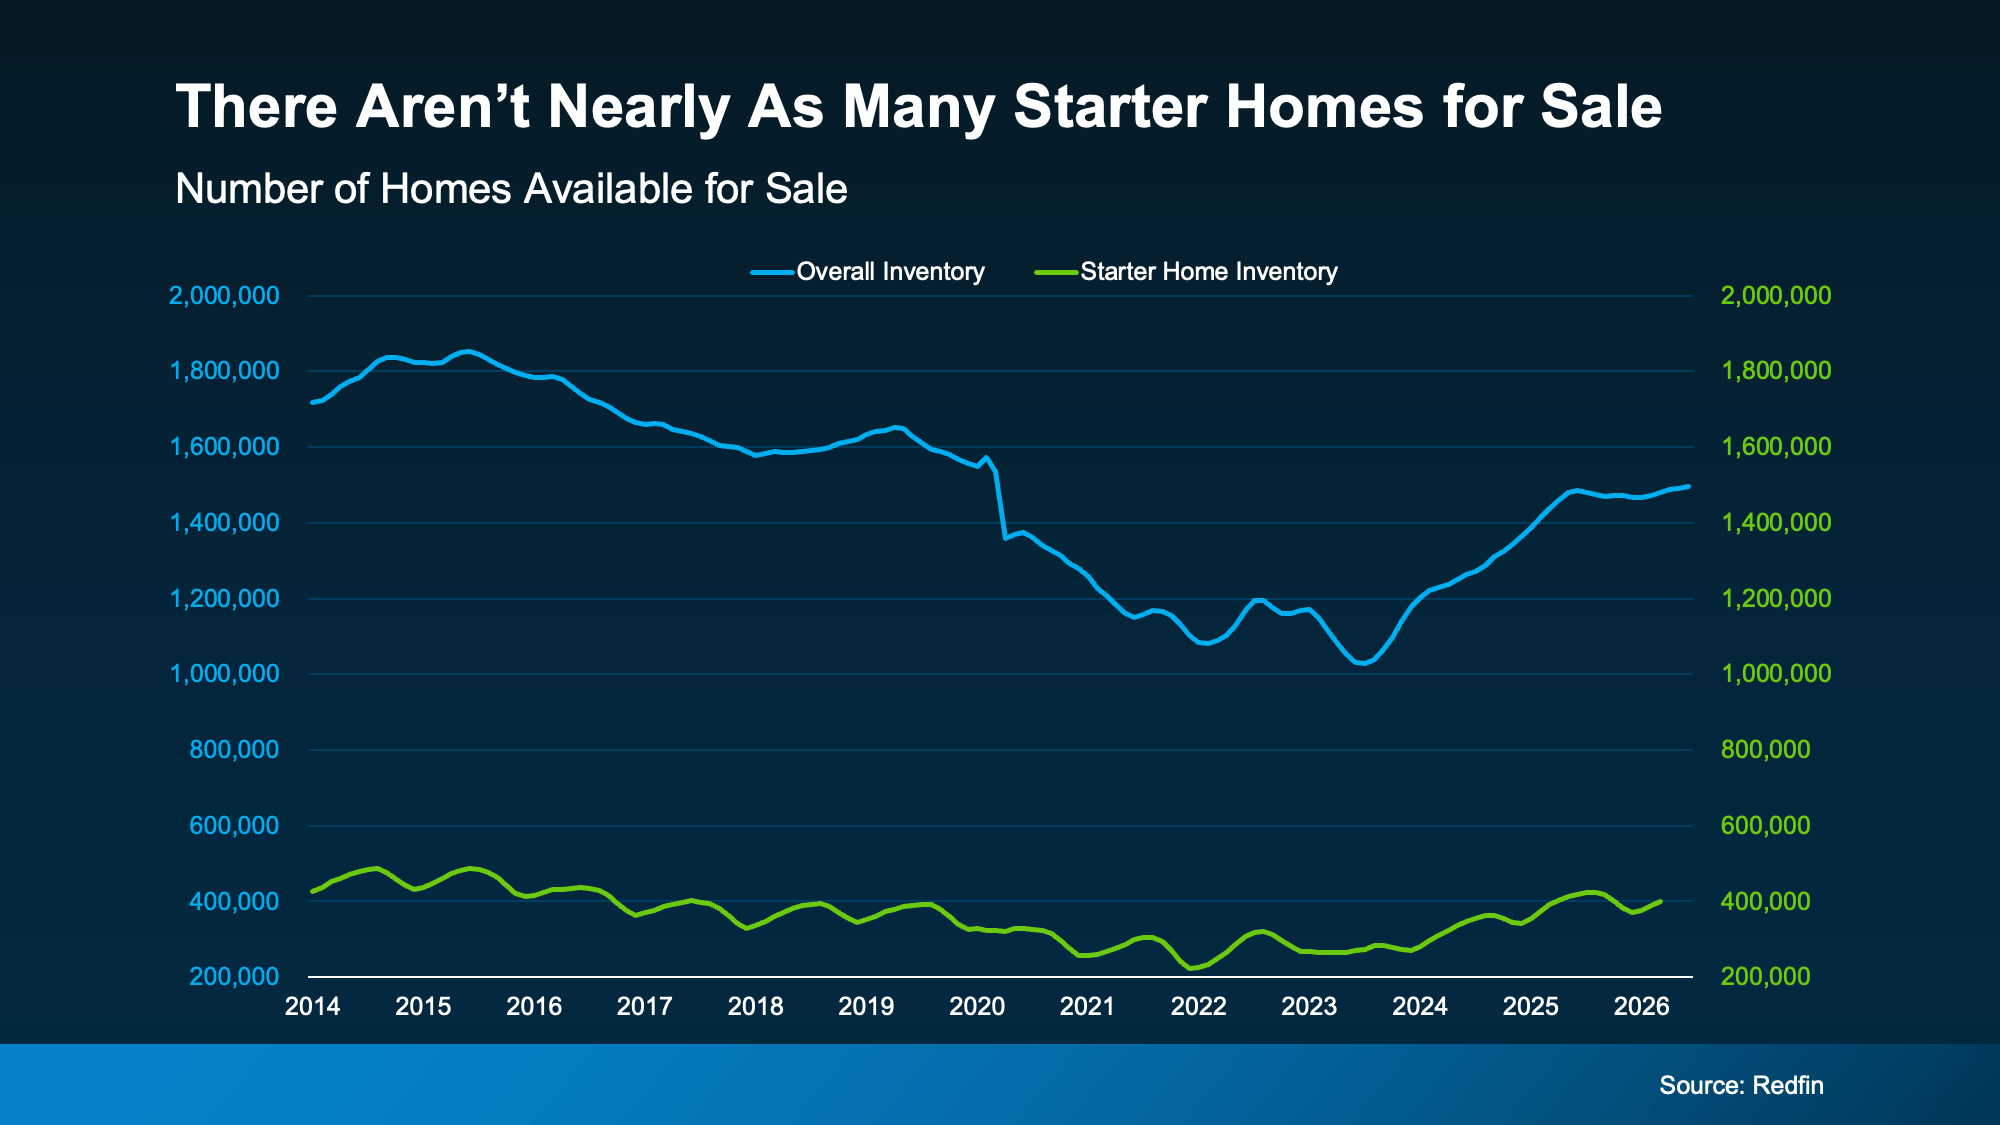
As Nadia Evangelou, Principal Economist and Director of Real Estate Research at the National Association of Realtors (NAR), explains:
“Too much of the inventory available today remains concentrated at higher price points, leaving a shortage of options for entry-level and middle-income buyers.”
That means you may have more choices for your move up than you’d expect. Whether you’re hoping for another bedroom, a home office, a bigger backyard, or simply more room for this next stage of life, today’s market may finally be giving you the chance to find it.
At the same time, your current house may be exactly what someone else has been looking for because homes like yours are still in short supply. That’s a unique advantage for move-up buyers. And it could help you sell for a stronger price. As Zillow says:
“Starter home value appreciation has outpaced other types of homes nationally, mostly because they’re so in demand.”
Your Biggest Advantage May Be Your Equity
Here’s the cherry on top. There’s one more thing your first home has been doing behind the scenes, and that’s building equity. Every mortgage payment you’ve made and every year your home’s value has grown has quietly increased your ownership stake in your house.
According to Cotality, the average homeowner with a mortgage has $295k in equity built up. While your number may be different, once you sell, it could become the down payment on your next home or help reduce the amount you need to borrow at today’s rates.
Put it all together and your move up becomes a lot more realistic than you think:
-
The house you’re selling is in demand.
-
The house you’re buying may be easier to find.
-
And the equity you’ve built can help bridge the gap between the two.
Your first home did exactly what it was supposed to do. It gave you a place to start.
Now, it may be the thing that helps you take the next step.
Bottom Line
Your first home was never meant to be your forever home. It was meant to help you build a life and build the financial foundation for whatever came next.
If your current home no longer fits the life you’re living today, connect with an agent. You may be closer to your next chapter than you realize.

Buying a Home? Here’s What You Should Know About Home Insurance Costs.

Home Price Growth Slowed Down. That May Be Changing.

Selling a Luxury House? Here’s Why Now Is a Good Time


-
 Economy4 weeks ago
What Buying or Selling a Home Gives Back to Your Community
-

 Buying Tips4 weeks ago
Student Loans Are Back in the News. Don’t Let It Put Your Homeownership Plans on Hold.
-

 Affordability3 weeks ago
What To Expect from the Housing Market in the Second Half of 2026
-
 For Sellers3 weeks ago
Think Nobody’s Buying Homes Right Now? Think Again.
-

 Buying Tips3 weeks ago
The “Take It or Leave It” Attitude Is Fading from the Market – What That Means for You
-

 First-Time Buyers2 weeks ago
14 Years Running: Why Real Estate Is Still America’s Favorite Investment
-
 Buying Tips2 weeks ago
More Homes, Better Prices: A Buyer’s Summer
-

 Equity1 week ago
The House That Started It All Could Kickstart What’s Next
You must be logged in to post a comment Login