For Buyers
A Historic Rebound for the Housing Market
Pending Home Sales increased by 44.3% in May, registering the highest month-over-month gain in the index since the National Association of Realtors (NAR) started tracking this metric in January 2001. So, what exactly are pending home sales, and why is this rebound so important?
According to NAR, the Pending Home Sales Index (PHS) is:
“A leading indicator of housing activity, measures housing contract activity, and is based on signed real estate contracts for existing single-family homes, condos, and co-ops. Because a home goes under contract a month or two before it is sold, the Pending Home Sales Index generally leads Existing-Home Sales by a month or two.”
In real estate, pending home sales is a key indicator in determining the strength of the housing market. As mentioned before, it measures how many existing homes went into contract in a specific month. When a buyer goes through the steps to purchase a home, the final one is the closing. On average, that happens about two months after the contract is signed, depending on how fast or slow the process takes in each state.
Why is this rebound important?
With the COVID-19 pandemic and a shutdown of the economy, we saw a steep two-month decline in the number of houses that went into contract. In May, however, that number increased dramatically (See graph below):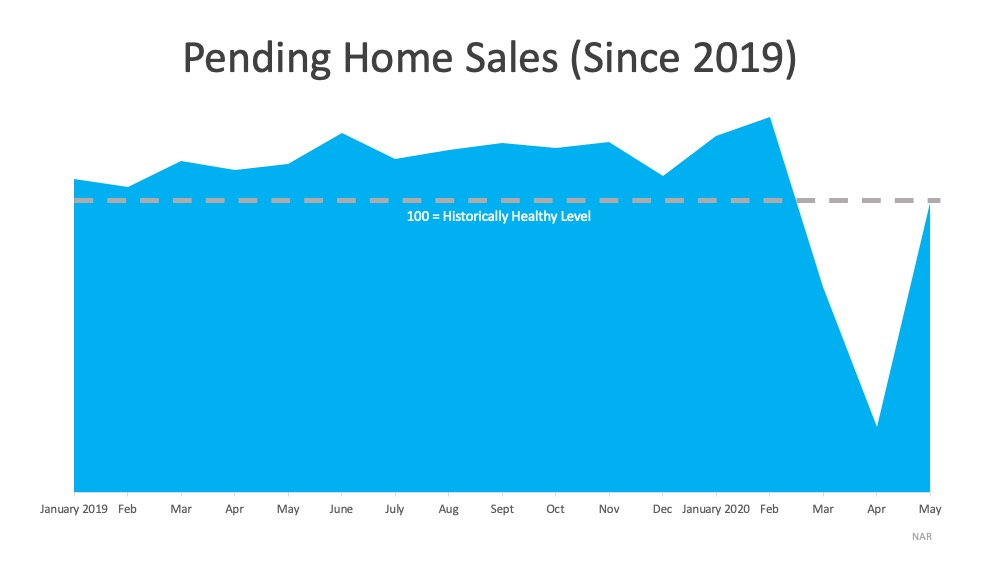 This jump means buyers are back in the market and purchasing homes right now. Lawrence Yun, Chief Economist at NAR mentioned:
“This has been a spectacular recovery for contract signings and goes to show the resiliency of American consumers and their evergreen desire for homeownership…This bounce back also speaks to how the housing sector could lead the way for a broader economic recovery.”
But in order to continue with this trend, we need more houses for sale on the market. Yun continues to say:
“More listings are continuously appearing as the economy reopens, helping with inventory choices…Still, more home construction is needed to counter the persistent underproduction of homes over the past decade.”
As we move through the year, we’ll see an increase in the number of houses being built. This will help combat a small portion of the inventory deficit. The lack of overall inventory, however, is still a challenge, and it is creating an opportunity for homeowners who are ready to sell. As the graph below shows, during the last 12 months, the supply of homes for sale has been decreasing year-over-year and is not keeping up with the demand from homebuyers.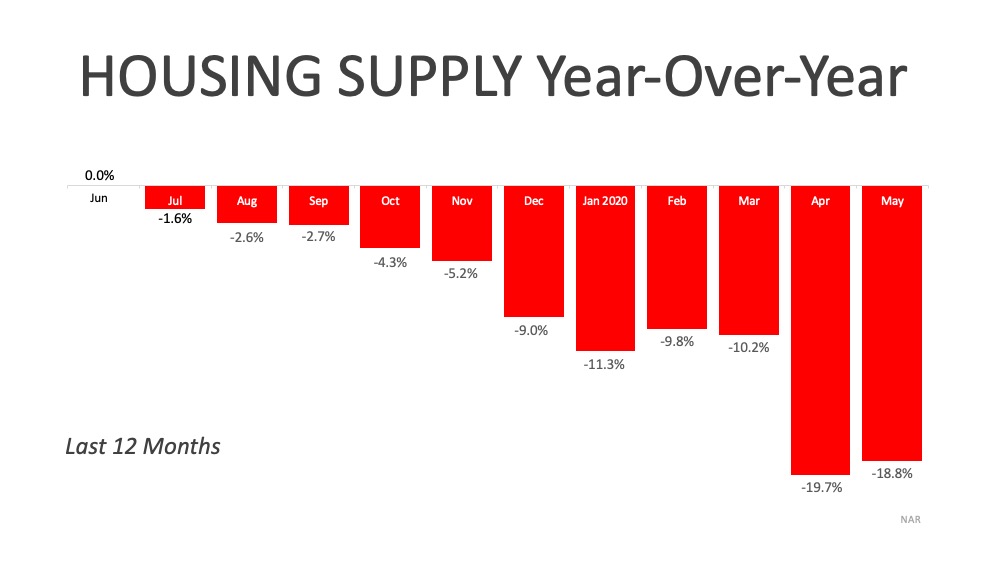
Bottom Line
If you decided not to sell this spring due to the health crisis, maybe it’s time to jump back into the market while buyers are actively looking for homes. Let’s connect today to determine your best move forward.


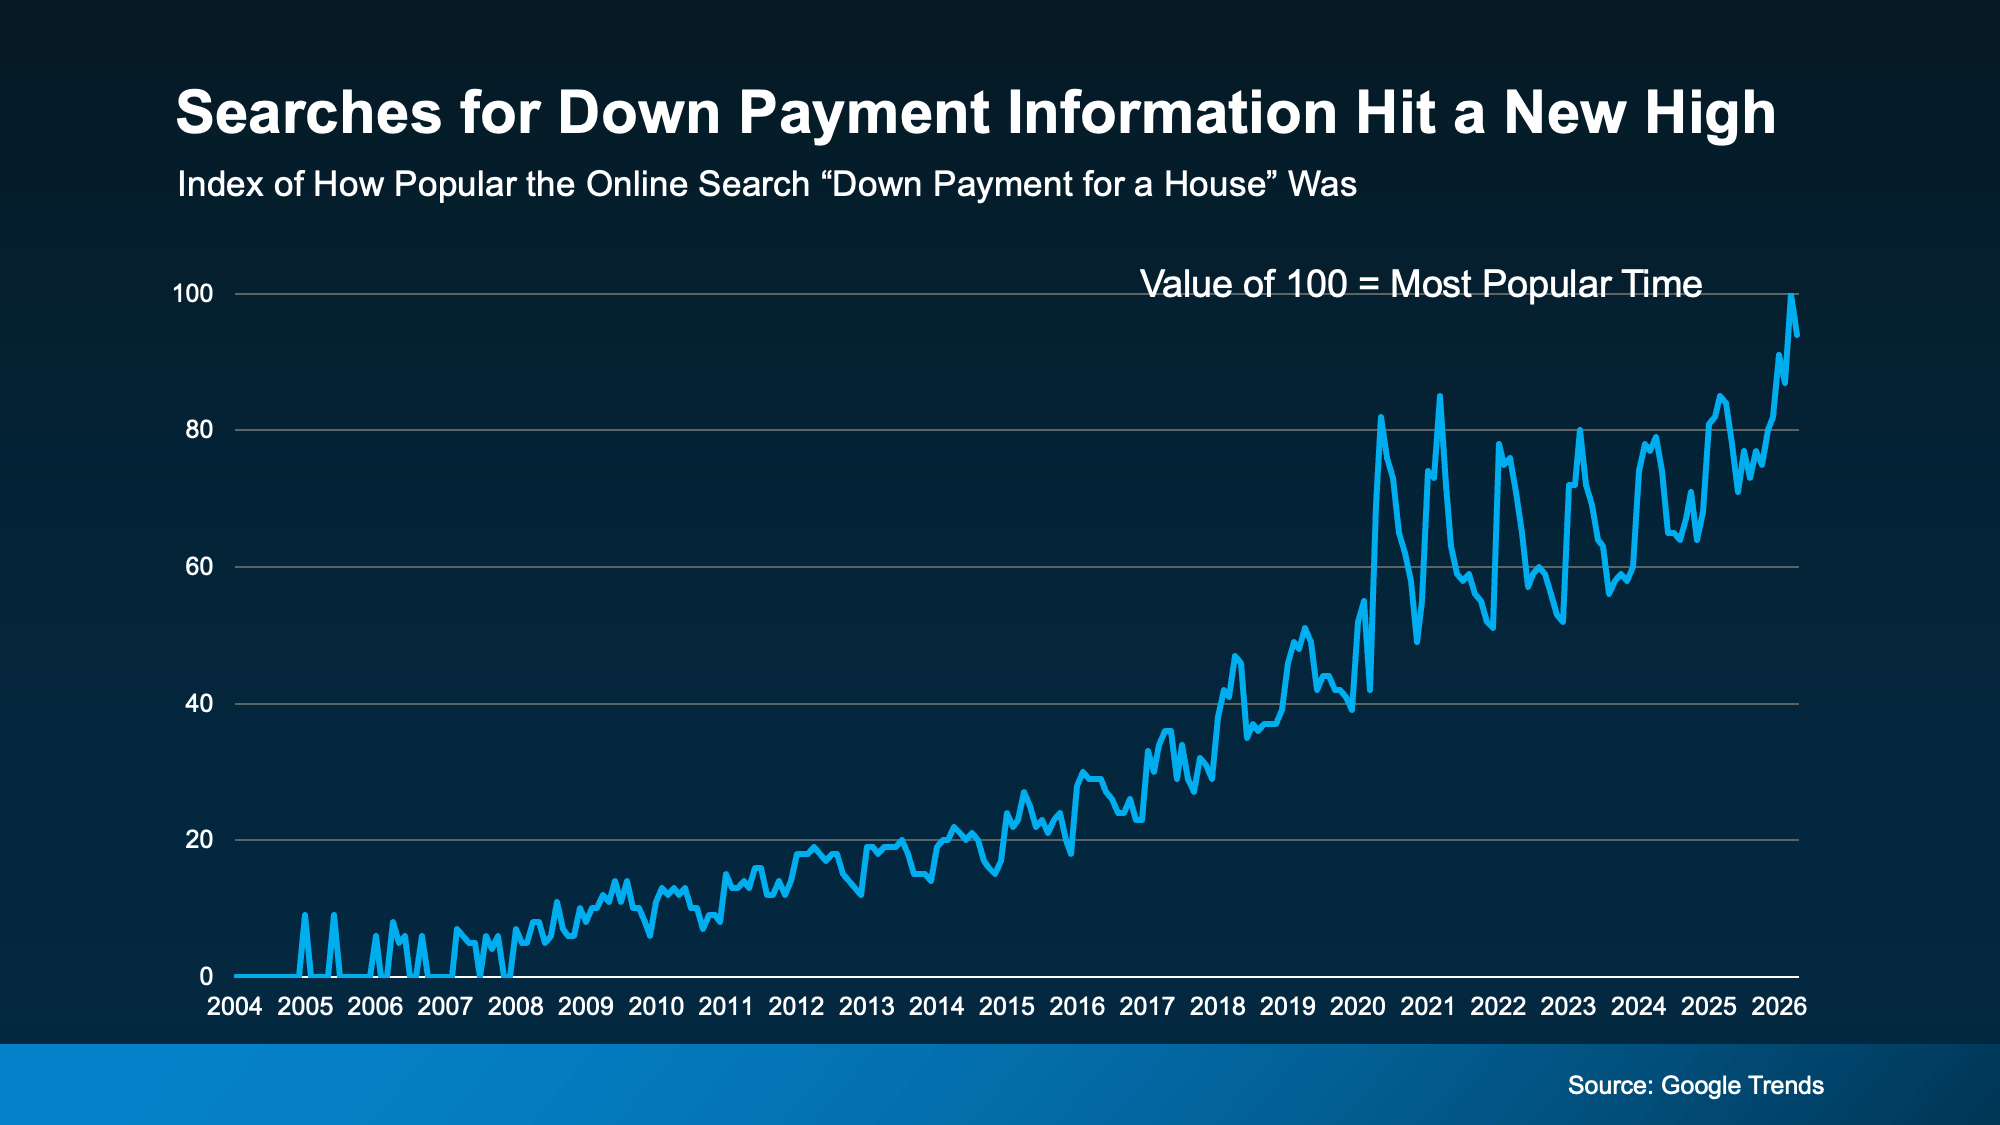
According to Google Trends, online searches for down payment information recently hit an all-time high. And that’s a clear sign more buyers are trying to figure out what they really need to save before making a move (see graph below):
 If you’re wondering the same thing, you can always turn to the internet for answers. But a lot of the time, it’s better to ask a local expert. Because here’s what a pro would tell you.
The 20% Down Payment Myth
The idea that you need 20% down to buy a home is one of the biggest misconceptions around the homebuying process. And the data debunks the myth.
While there are benefits to putting that much money down, most first-time buyers put down far less.
Here’s why. Unless it’s stated by your lender, you typically don’t have to have a 20% down payment. There are even some loan options designed to help you get into a home with a much smaller upfront cost. As the Mortgage Reports explains:
“The amount you need to put down will depend on a variety of factors, including the loan type and your financial goals. If you don’t have a large down payment saved up, don’t worry—there are plenty of options available, and you don’t need to put down the traditional 20% . . . many homebuyers are able to secure a home with as little as 3% or even no down payment at all . . .”
For example, FHA loans allow down payments as low as 3.5%, while VA and USDA loans offer zero down payment options for qualified applicants, like Veterans.
And those options are just one reason so many first-time buyers are able to buy without a 20% down payment.
What Buyers Are Actually Putting Down
So, if buyers aren’t doing 20%, how much do they actually put down?
According to the National Association of Realtors (NAR), the median down payment for first-time homebuyers is only 10%. That’s half of what you probably expected.
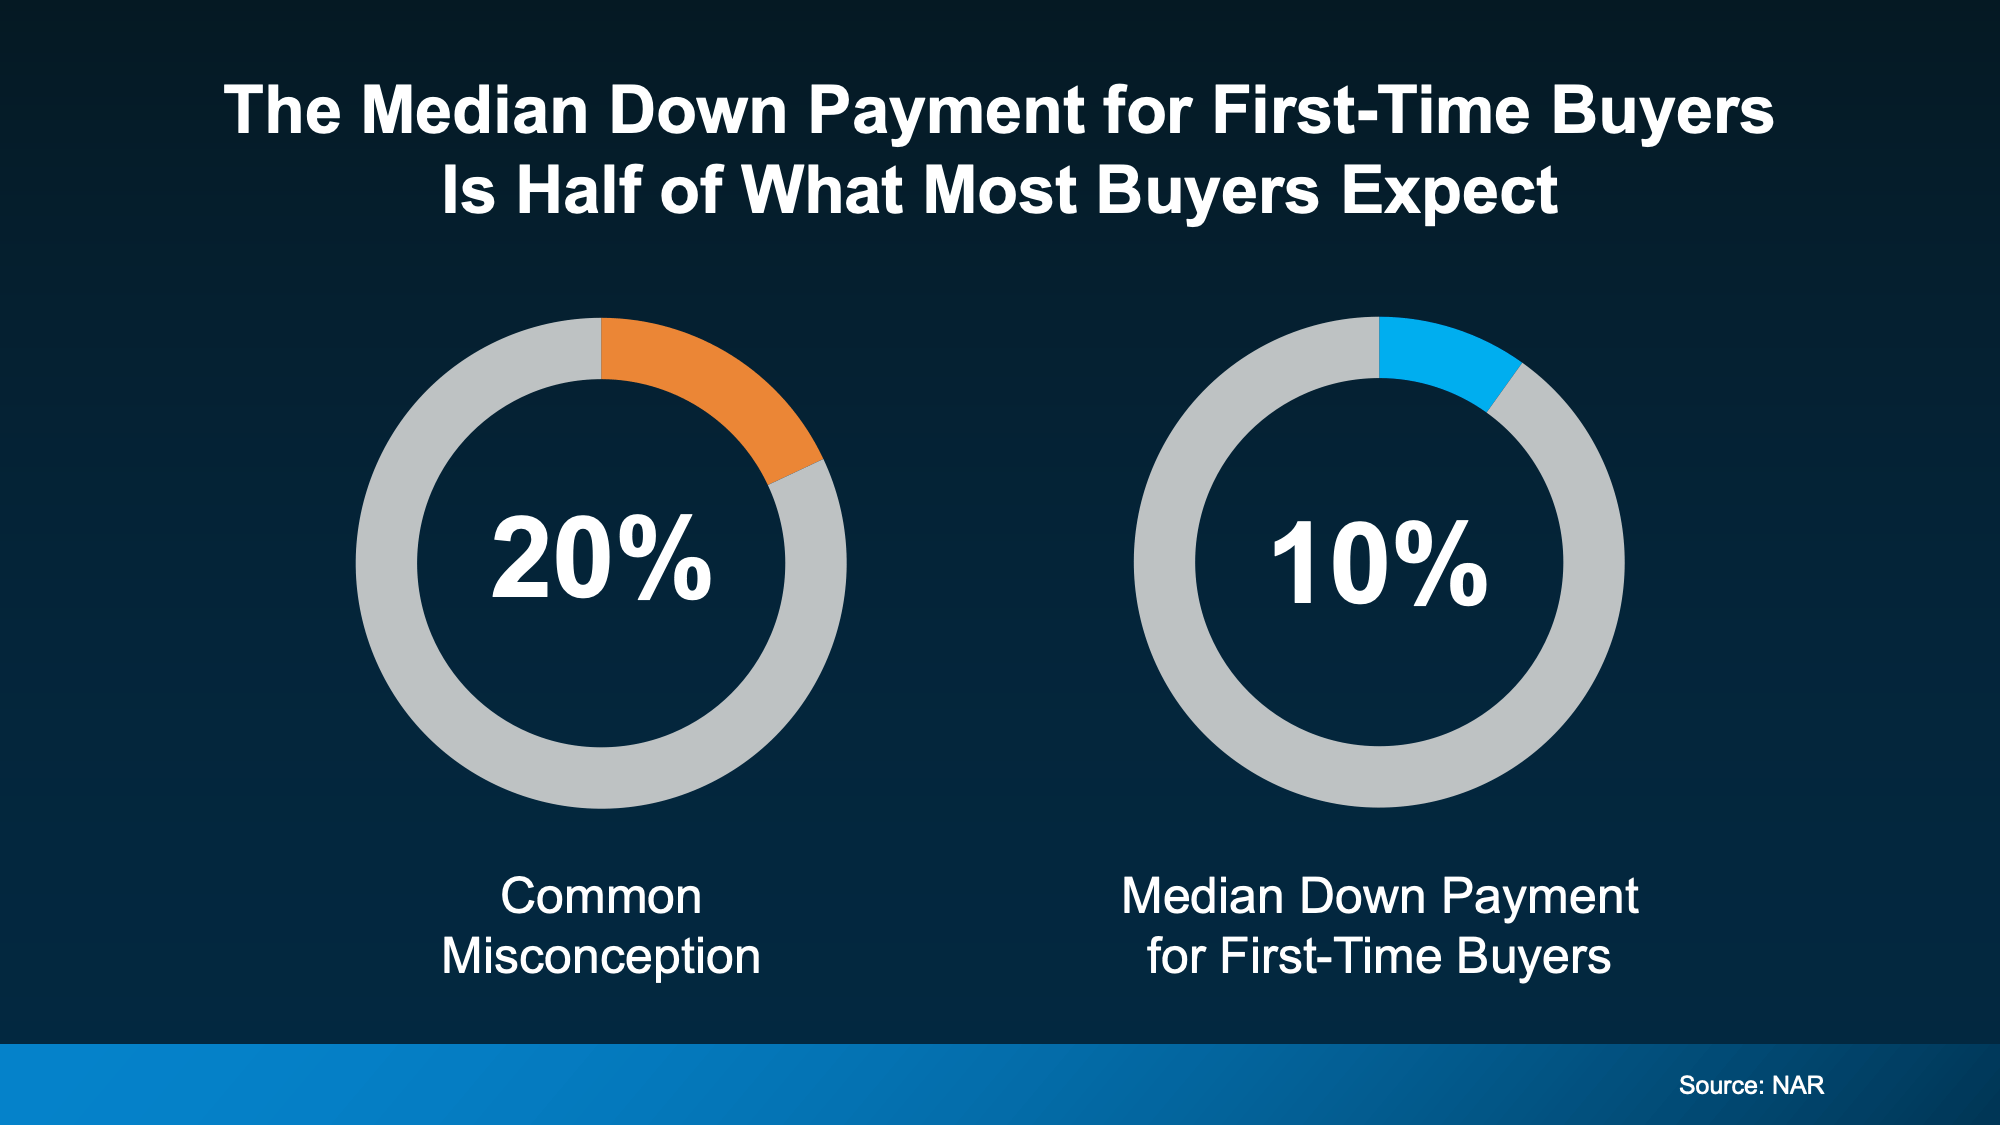 That means if you’re aiming to save 20% because you think you have to, you may be setting a timeline that’s longer than necessary.
And here’s some more good news. It’s not only that you may be able to buy with less money down than you thought, but there are also options to help you get to your down payment goal even faster.
Why You Should Look into Down Payment Assistance Programs
There are a lot of programs designed to help you save for a down payment – and they can make a big difference in how fast you hit your savings target. Unfortunately, buyers don’t realize how many there are, or that they may qualify for help.
Research from Realtor.com shows almost 80% of first-time homebuyers qualify for down payment assistance (DPA), but only 13% actually use it (see chart below):
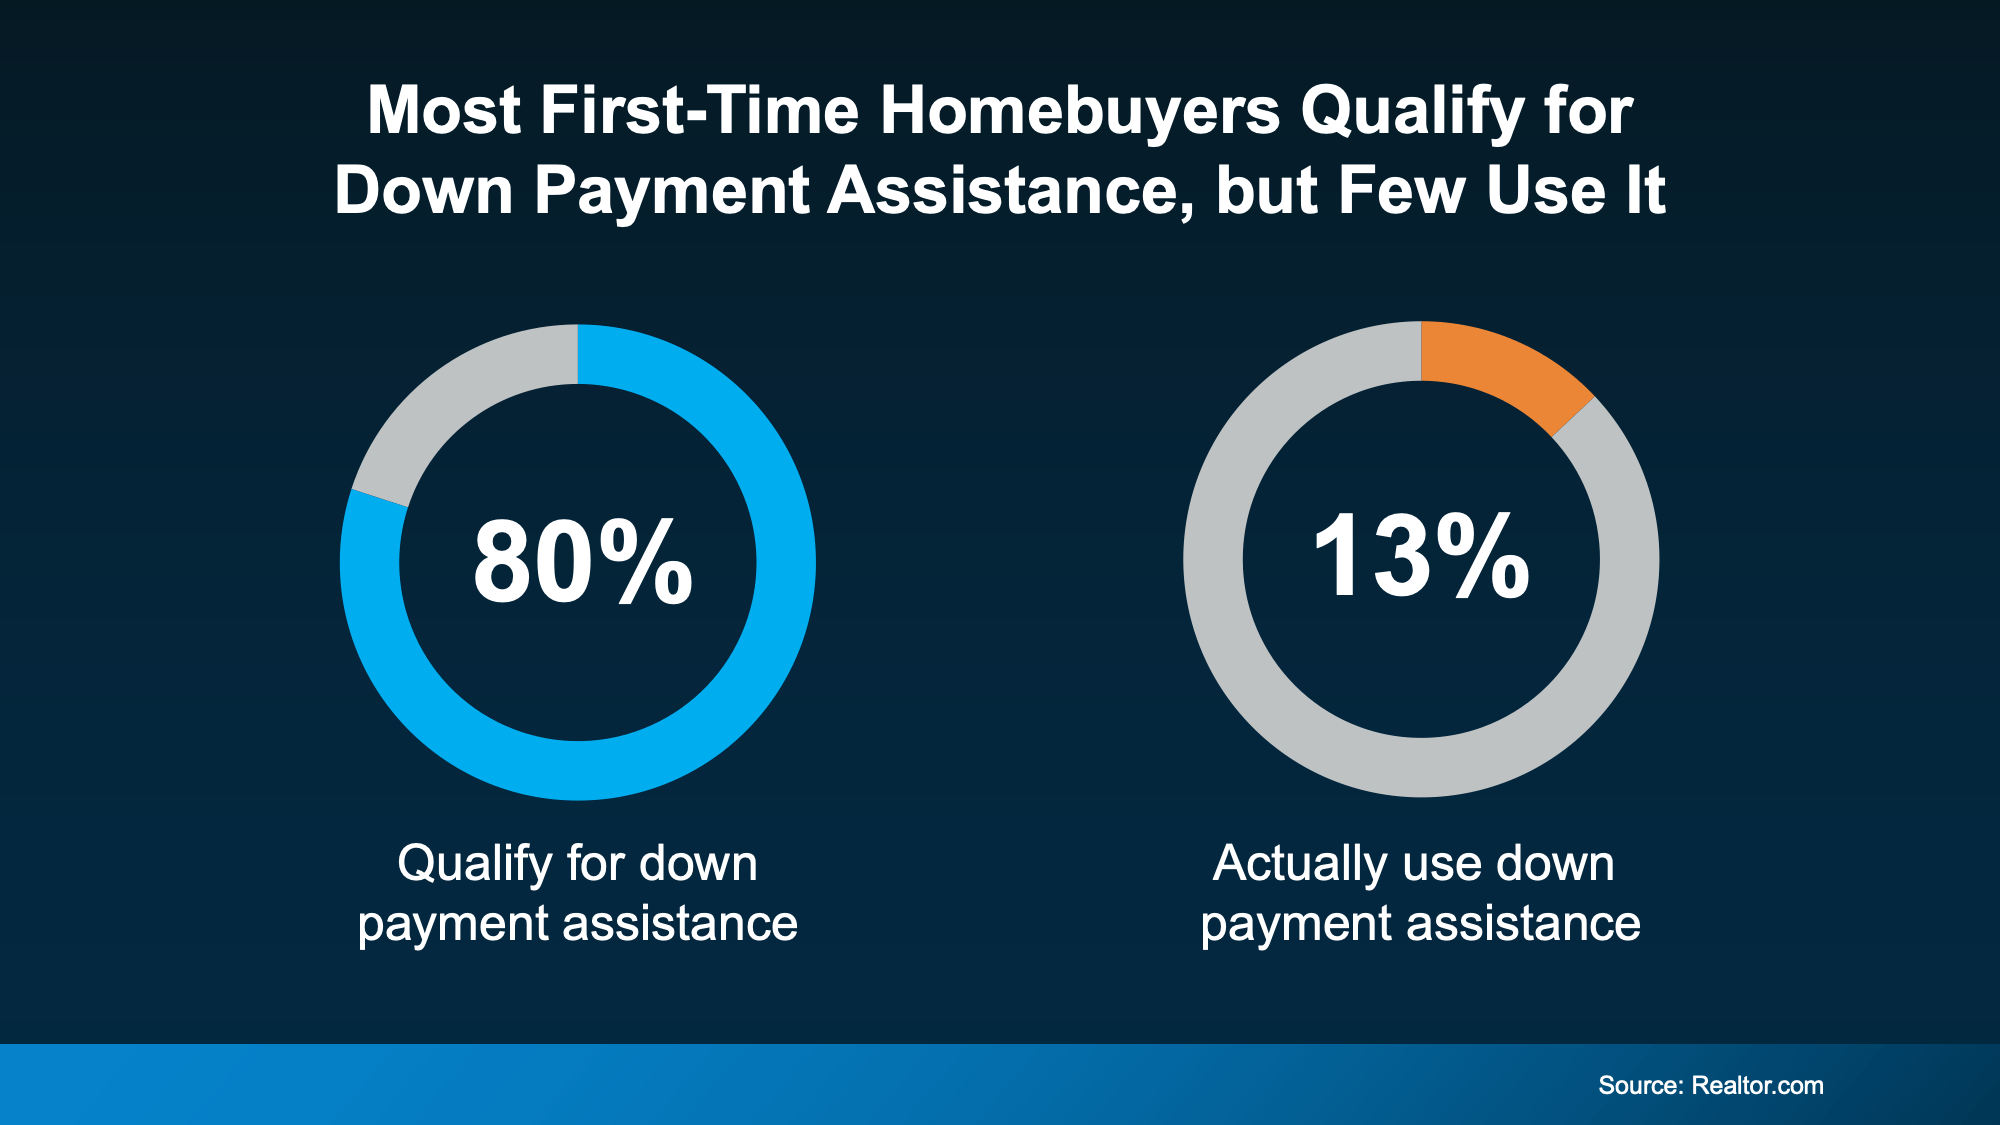 And that’s another big miss holding would-be buyers like you back.
In the U.S., there are over 2,600 homeownership programs available, many offering significant financial support. As Down Payment Resource shares:
“With an average benefit of $18,000, down payment assistance (DPA) remains one of the most essential tools for addressing the nation’s affordability challenges. Programs continue to expand in scope, serving a broader range of incomes, property types and borrower needs, including first-generation, military and repeat buyers.”
Imagine how much further your savings could go with an extra $18,000 you can use to buy. In some cases, you may even be able to stack multiple programs, giving what you’ve saved an even bigger boost.
Bottom Line
The simple truth is: most first-time buyers don’t put 20% down. And if you’ve been waiting to buy until you have that saved, you may be setting a timeline that’s longer than necessary.
To find out what you really need to save and if you qualify for any help, connect with a trusted lender who can walk you through your options. You may be able to buy sooner than you thought.

There’s a lot of uncertainty right now and that’s leading to some dramatic headlines. And if you’re thinking about buying a home, that can make you feel a little less sure about your decision.
A recent study by CNBC asked homebuyers what they’re most worried about, and three themes kept coming up again and again:
- Mortgage rates
- The number of homes for sale
- Home prices
But a lot of what you may be hearing on those is based more on misconceptions. Not facts. So, let’s break it down and separate fact from fiction.
Misconception #1: “I’ll Just Wait, Because Mortgage Rates Are Going To Fall Dramatically”
One idea doing its rounds on social is that mortgage rates are going to drop dramatically soon. So, it’s better to wait to buy.
But is that really what’s expected?
While mortgage rates have come down a bit in the last few weeks, forecasts don’t show a major drop ahead. The most likely scenario is that rates stay somewhere in the low 6% range this year.
And that’s not a big change from where rates are now (see graph below):
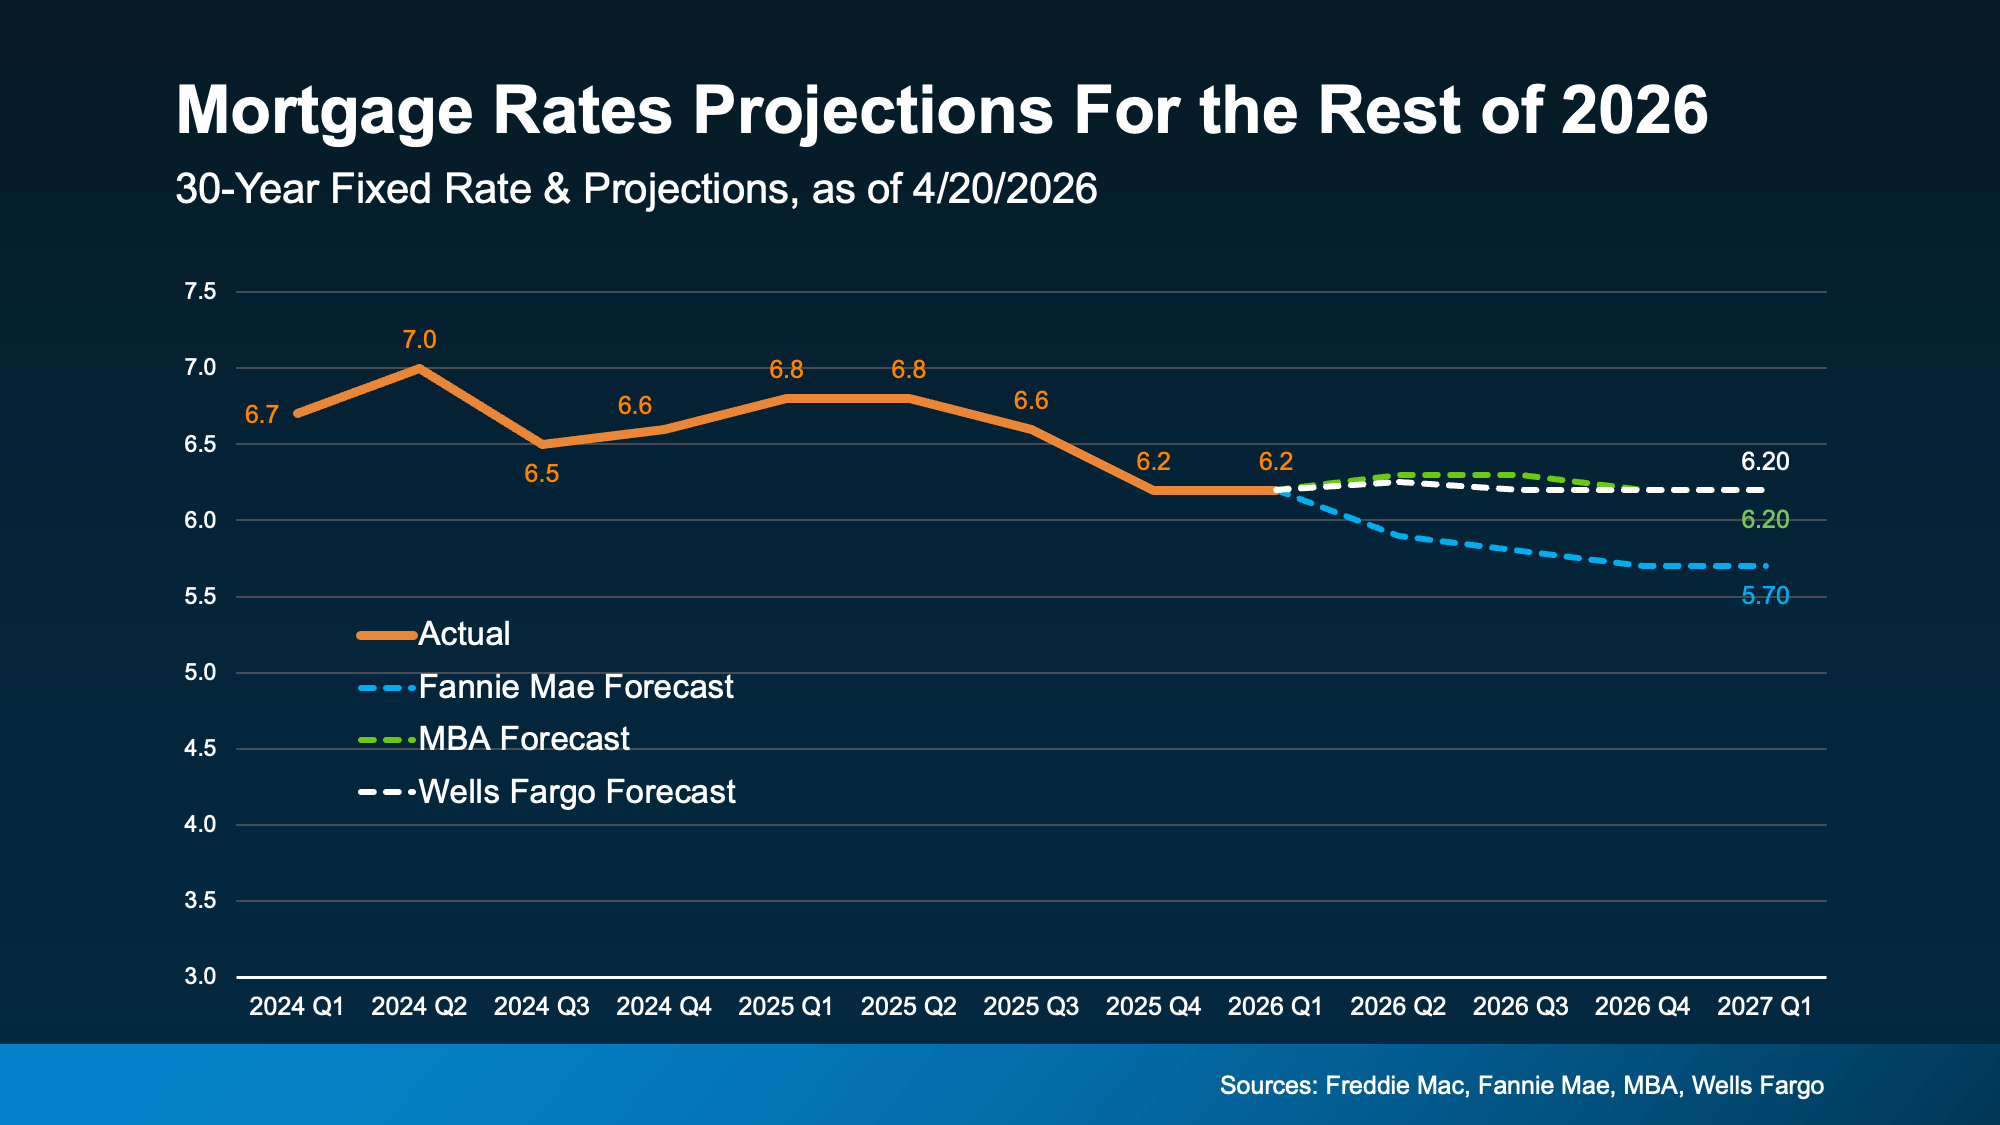 Of course, this depends on where inflation and the economy go from here. But, based on what we know today, waiting for a big drop in rates may not work out the way some people hope. As U.S. News explains:
“Mortgage rates aren’t expected to change much over the next several quarters . . .”
Not to mention, even with rates where they are today, it’s already more affordable than a year ago. So, even if they don’t change much, it’s still better than it was.
Misconception #2: “There Are Too Many Homes for Sale Right Now”
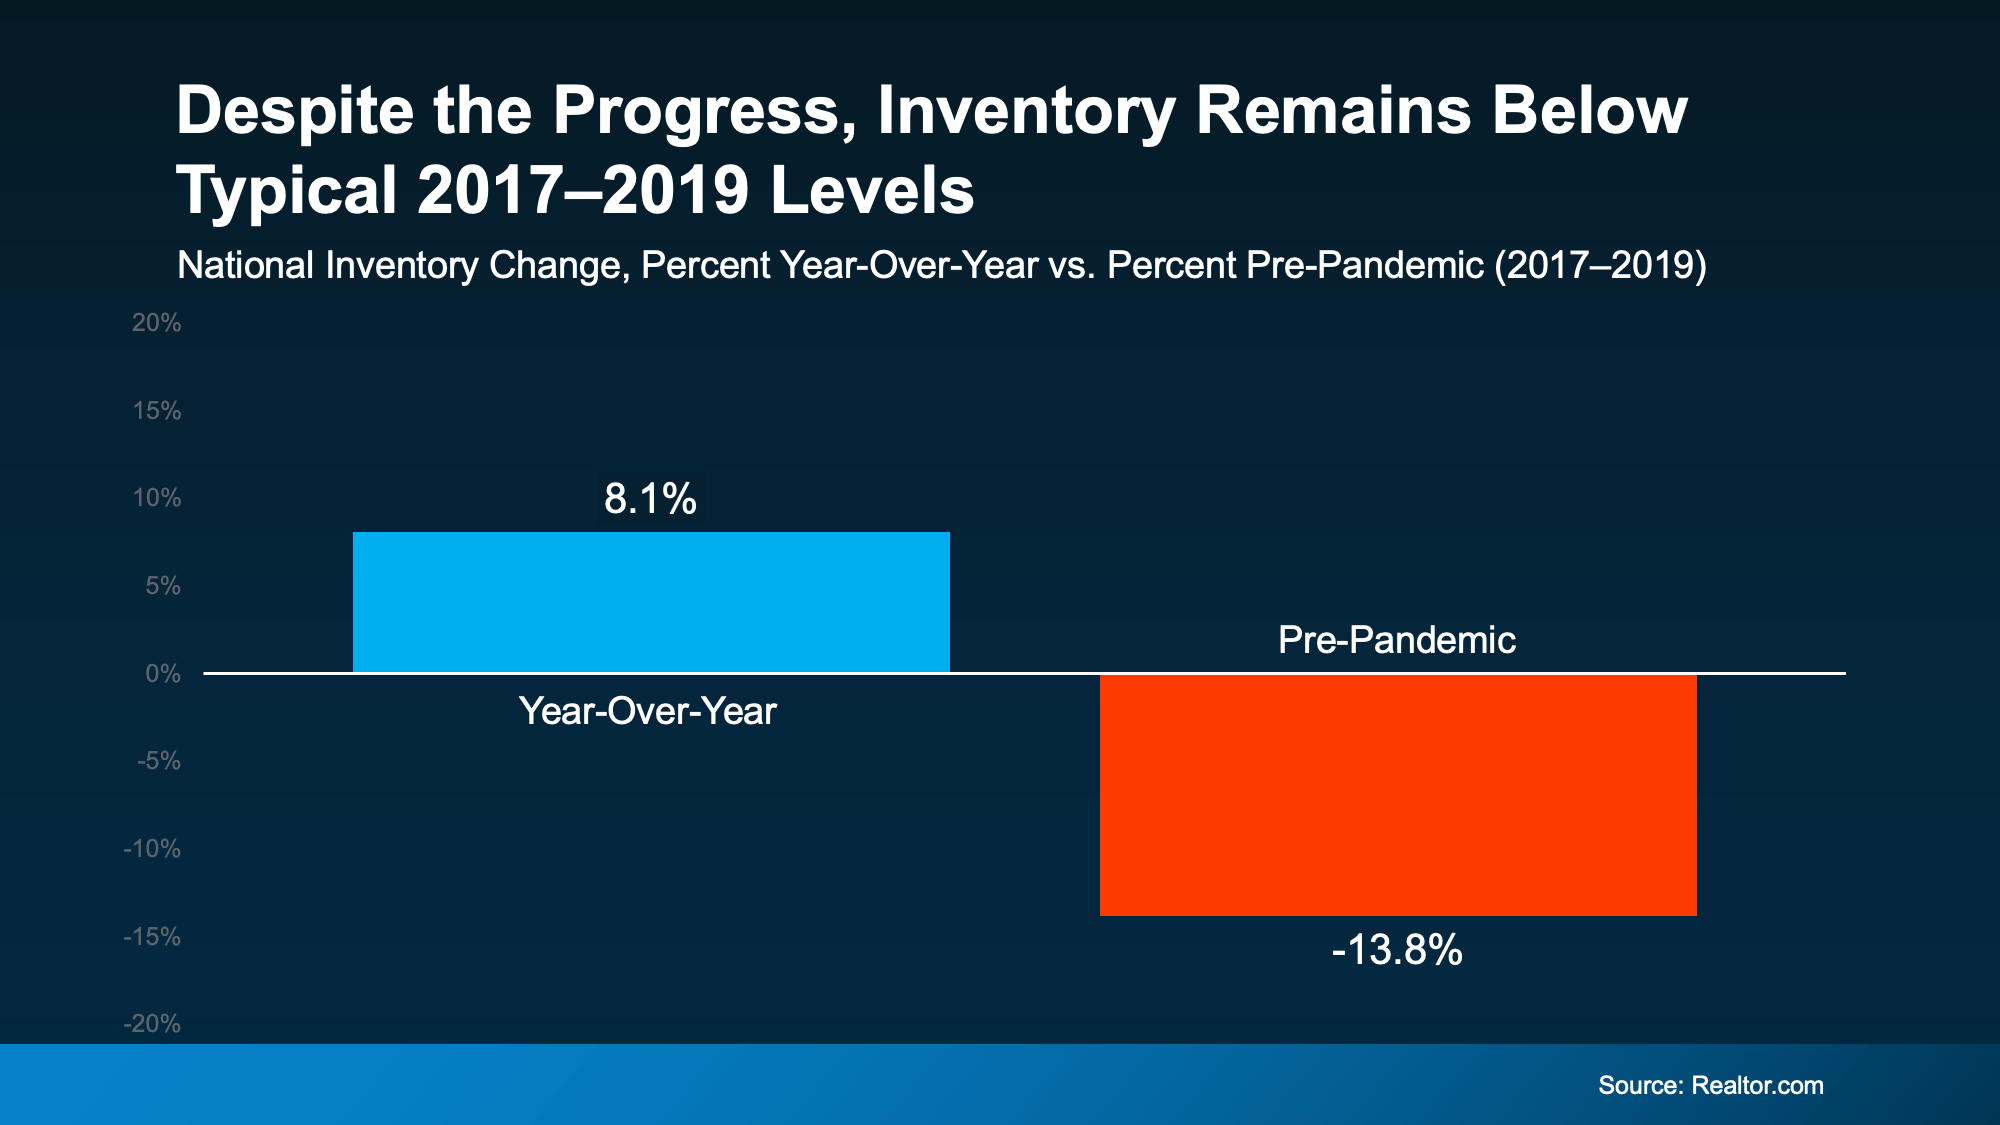
You’ve probably heard inventory is up. And nationally, it is. The number of homes for sale is 8% higher than this time last year. But that’s not a bad thing. In fact, it’s one of the reasons buyers have a bit more breathing room right now.
The problem is the headlines are making something good, sound bad. They’re focusing on how this is the most inventory we’ve had since 2019 or how many homes builders are building. And that can make it sound like the number of homes for sale is rising too far, too fast.
But that’s not what the bigger picture shows.
Data from Realtor.com proves that, even though inventory is up compared to last year, it’s still nearly 14% lower than it was during the last normal housing market (2017-2019):
 While it can vary a lot based on where you live, only 9 states have more inventory than pre-pandemic today. That’s a key reason why there still aren’t enough homes for sale to trigger something like the crash back in 2008.
Misconception #3: “Home Prices Are About To Crash”
You’ve probably seen this one, too. The confusion is coming from the fact that some metros are experiencing slight price declines. And influencers are running with that and saying prices are crashing. But that’s not the reality.
Most areas are seeing prices rise, not fall. And that’s because:
- Many homeowners aren’t selling because they don’t want to give up the low mortgage rate they locked in a few years ago. And that’s keeping a lid on how much inventory can grow.
- Since inventory is still below pre-pandemic norms, there aren’t enough homes for sale to cause a price crash.
- And even in markets with more inventory, some sellers are choosing to pull their homes off the market instead of cutting prices.
And those are 3 big reasons prices aren’t headed for a crash.
And even in the markets experiencing mild declines, the drops aren’t enough to cancel out the big gains most homeowners have seen in the last 5 years (see graph below):
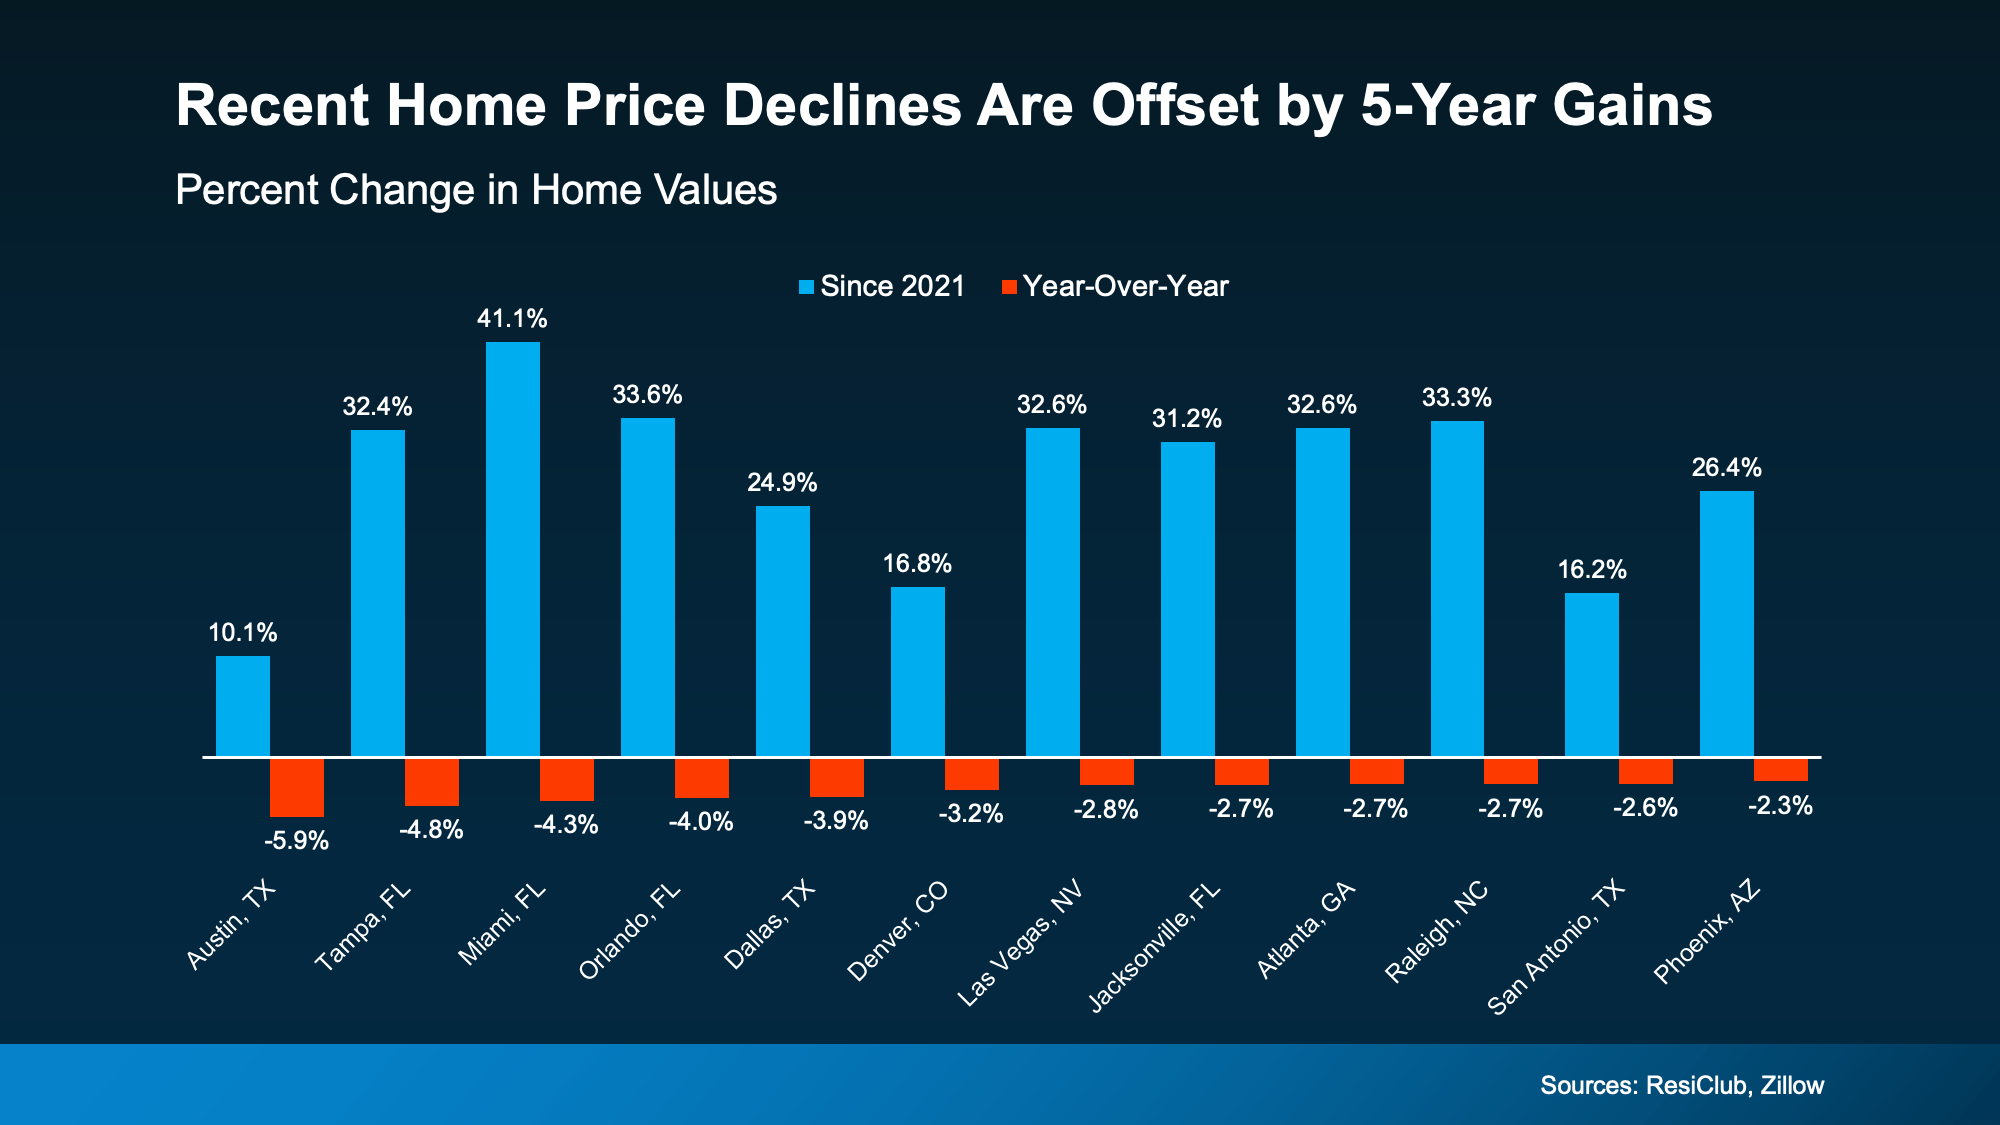 That’s not a crash. That’s just prices moderating after a few record-breaking years.
Bottom Line
Online posts are going to make things sound worse than they are. If you want a true, data-bound look at what’s really happening in today’s market, lean on a real estate agent.
Connect with a local agent so you have someone to separate fact from fiction today.

The Secret To Selling Fast, No Matter the Market

4 Ways To Give Your Offer an Edge This Spring

Is Late May the Best Time To List Your House?


-

 Affordability4 weeks ago
When Buying a Home Feels Out of Reach, Some Families Do This Instead
-

 Buying Tips4 weeks ago
Thinking About an Adjustable-Rate Mortgage? Here’s What You Need To Know.
-

 Agent Value2 days ago
Stay or Sell? How To Make the Right Call as You Age
-

 For Buyers2 days ago
More Options Are Popping Up This Spring
-

 Affordability2 days ago
Think You Have To Put 20% Down? Most First-Time Homebuyers Don’t.
-

 Affordability2 days ago
The 10 Best Markets for First-Time Buyers This Spring
-

 Equity2 days ago
Rent or Buy? The Real Tradeoff Most People Don’t Talk About
-

 Featured2 days ago
3 Things That Are Not Going To Happen in Today’s Housing Market
You must be logged in to post a comment Login