

For Buyers
With Home Values Surging, Is it Still Affordable to Buy Right Now?

Housing inventory is at an all-time low. Realtor.com just reported that there are 39% fewer homes for sale today than there were last year. At the same time, buyer demand remains strong. In a recent newsletter, research analyst Ivy Zelman explained:
“Although the headwind of severe supply constraints in most markets has contributed to slight moderation in seasonally-adjusted and year-over-year new pending contract growth for two consecutive months (albeit still growing strongly), the underlying strength of buyer demand, particularly for this time of year, remains apparent.”
Whenever there’s a shortage in the supply of an item that’s in high demand, the price of that item increases. That’s exactly what’s happening in the real estate market right now. As a result, home values are surging.
This is great news if you’re planning to sell your house. On the other hand, as either a first-time or repeat buyer, this may instead seem like troubling news. Purchasers, however, should realize that the price of a house is not as important as the monthly cost. Here’s how it breaks down.
There are several factors that influence the cost of a home. Two of the major ones are:
- The price of the home
- The mortgage rate at which a buyer can borrow the funds necessary to purchase the home
How do these factors impact affordability?
The National Association of Realtors (NAR) produces a Housing Affordability Index which takes these factors into account and determines an overall affordability score for housing. According to NAR, the index:
“…measures whether or not a typical family earns enough income to qualify for a mortgage loan on a typical home at the national and regional levels based on the most recent price and income data.”
Their methodology states:
“To interpret the indices, a value of 100 means that a family with the median income has exactly enough income to qualify for a mortgage on a median-priced home. An index above 100 signifies that family earning the median income has more than enough income to qualify for a mortgage loan on a median-priced home, assuming a 20 percent down payment.”
So, the higher the index, the more affordable it is to purchase a home. Here’s a graph of the index going back to 1990: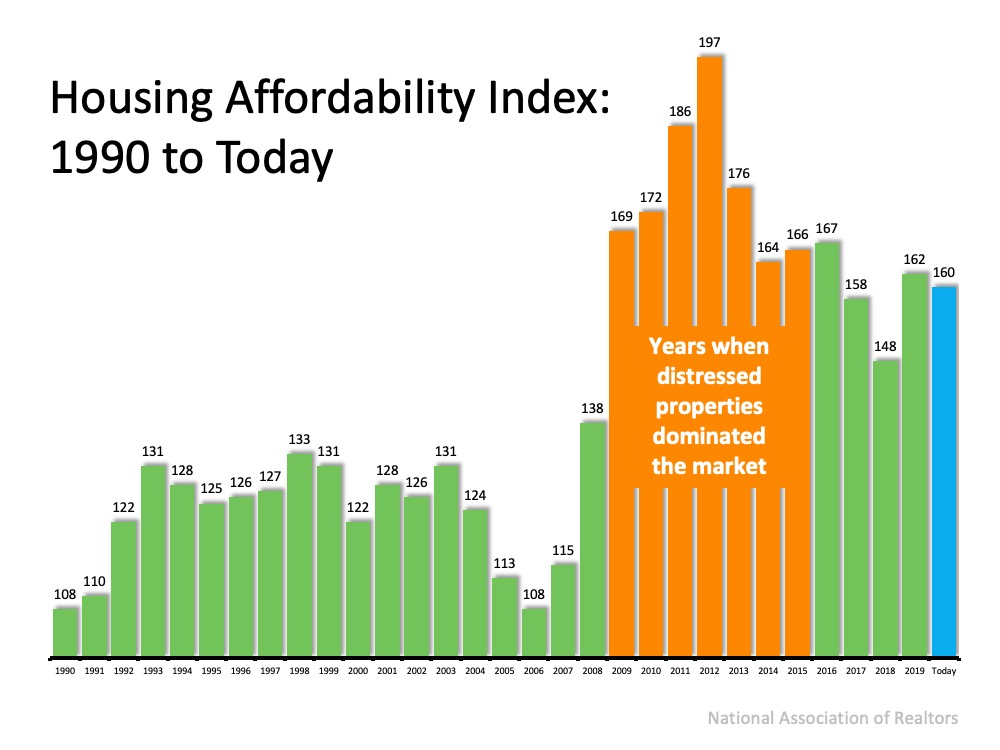 The blue bar represents today’s affordability. We can see that homes are more affordable now than they were from:
- 1990 to 2008
- 2017 to 2018
Buying a home today is just a little less affordable than it was last year, but still very affordable compared to historical housing market trends.
Note: During the housing crash from 2009 to 2015, distressed properties (foreclosures and short sales) dominated the market. Those properties were sold at large discounts not seen before in the housing market.
Why are homes still affordable today?
The number one factor impacting today’s homebuying affordability is record-low mortgage rates. There’s no doubt that prices are on the rise. However, mortgage rates have fallen dramatically. Last week, Freddie Mac announced that the average interest rate for a 30-year fixed-rate mortgage was 2.72%. Last year at this time, the average rate was 3.68%.
If you’re considering purchasing your first home or moving up to the one you’ve always hoped for, it’s important to understand how affordability plays into the overall cost of your home. With that in mind, buying while mortgage rates are as low as they are now may save you quite a bit of money over the life of your home loan.
Bottom Line
At this point, home purchase affordability is still in a historically good place. However, we need to watch price increases going forward. As Mark Fleming, Chief Economist at First American, noted in a recent post:
“Faster nominal house price appreciation can erode, or even eliminate, the boost in affordability from lower mortgage rates, especially if household income growth doesn’t keep up.”

When mortgage rates climb, buying a home can start to feel like trying to hit a moving target. Every jump in rates makes monthly payments bigger, and that pushes a lot of buyers to look for another way in.
More and more of them are finding it in the adjustable-rate mortgage, or ARM.
The ARM Option
Here’s how an ARM differs from a more traditional mortgage. With a regular fixed-rate mortgage, your rate stays the same for your whole loan. But with an ARM, your rate is locked for the first few years, then it can move up or down based on market conditions.
Some people don’t like that level of uncertainty – and that’s okay. But others are drawn to this option specifically because there’s usually a lower rate to start when you opt for an ARM. And in an affordability-strapped market, that’s going to gain popularity.
Bankrate recently found that, in September, rates for ARM products were over a full percentage point lower than a regular fixed-rate loan. Depending on the ARM product, that can make a difference of $150-300 in the monthly payment on a median-priced home.
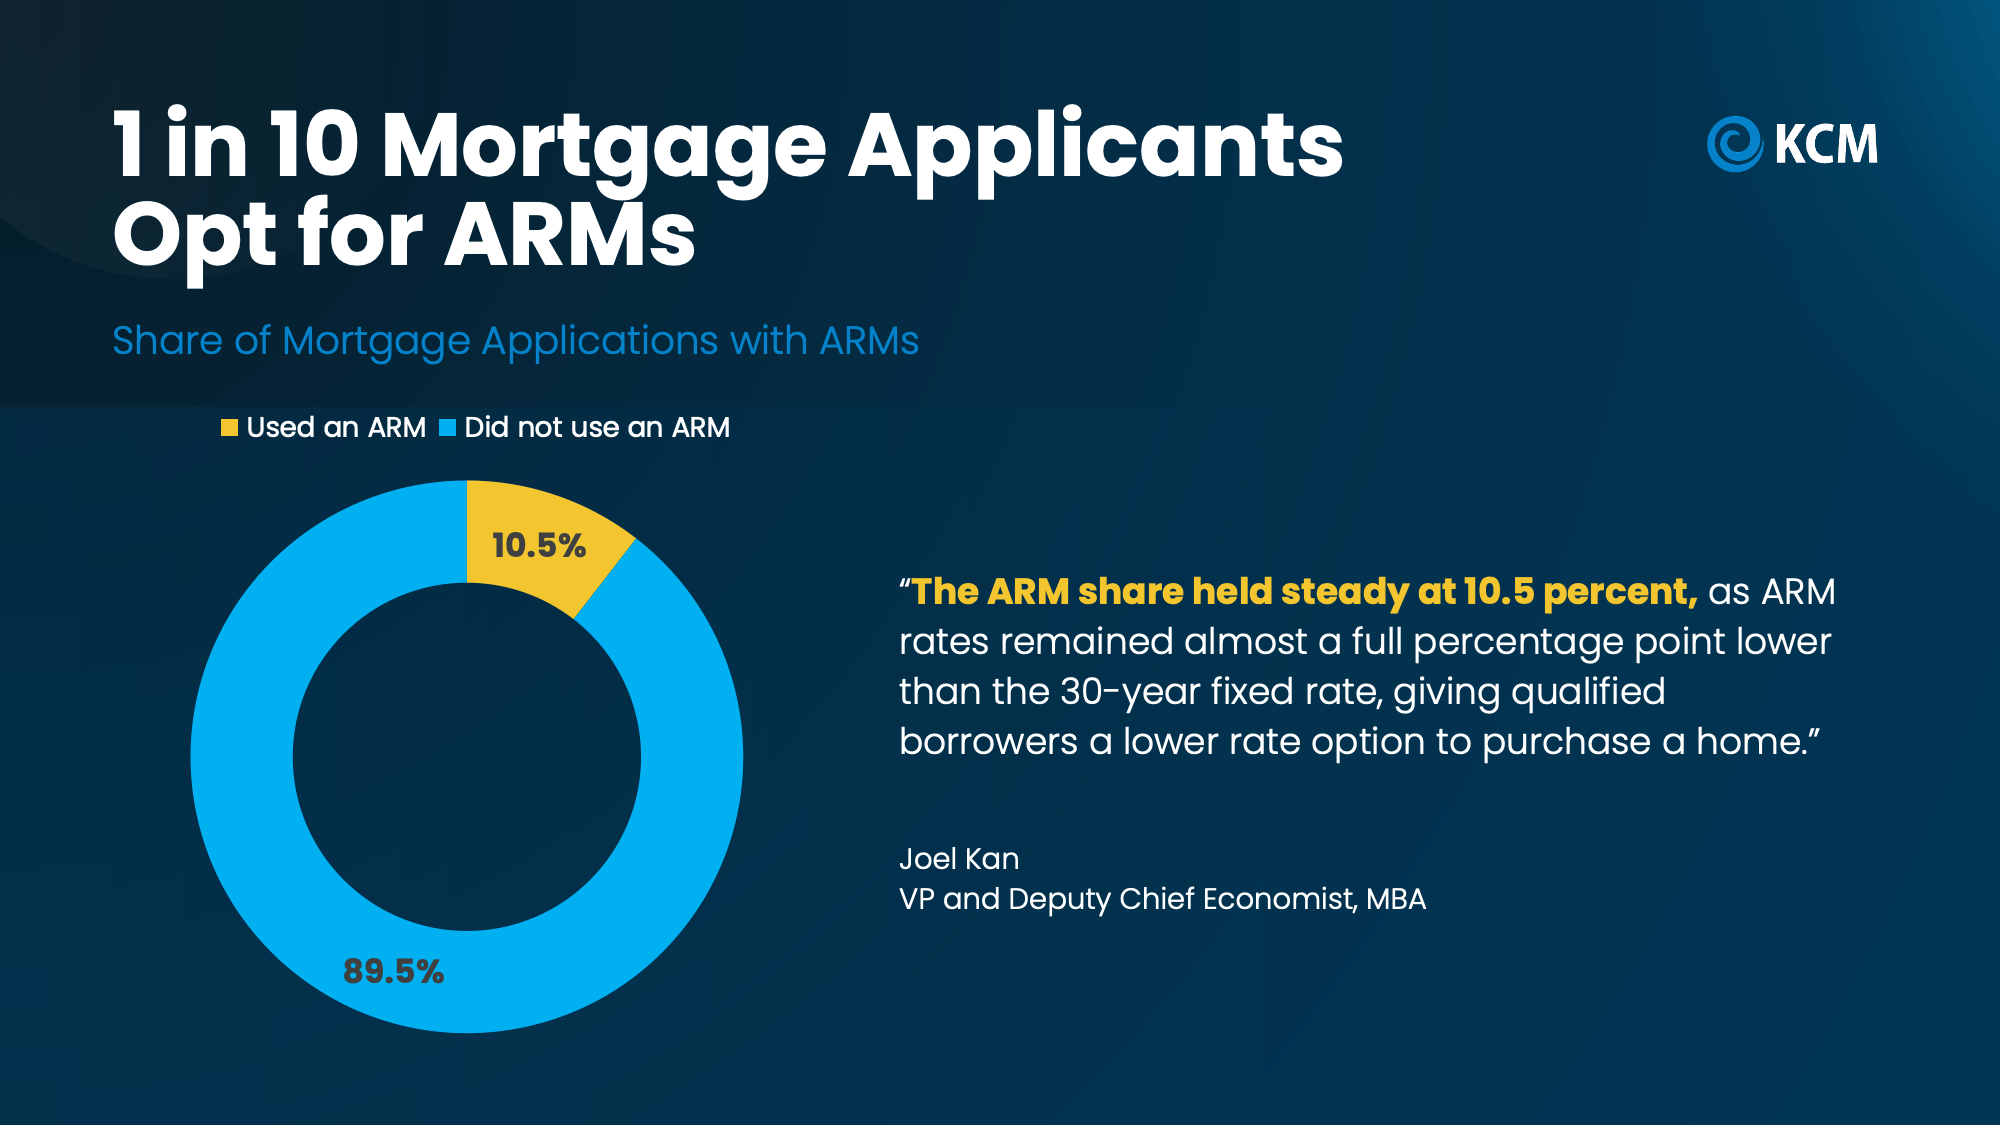
And for some buyers, that’s enough to turn “not right now” into “let’s do this.” You can see it in the numbers. Data from the Mortgage Bankers Association (MBA) shows that, in October, roughly 1 in 10 people applying for a mortgage chose an ARM (see graph below):
If you think you may want to consider this yourself, here’s what you need to know about how it works.
The 5/1 ARM
An ARM is like a phone or cable plan that has an introductory deal for new customers. You start out at a lower price, and then it adjusts after a specified amount of time. A popular loan is the 5/1 ARM.
The “5” means your introductory rate is locked for the first five years, and the “1” means that the rate can change every year after that. The rate change is called the “reset.” And here’s the really important part.
When your rate resets, your mortgage payment could go up or down. The good news is that most ARMs have caps, which are limits on how much your rate can rise each year and over the life of the loan. But either way, you have to be ready.
The Upsides and Potential Downsides
To see if this type of loan may be right for you, here are some things to think about and discuss with your loan officer:
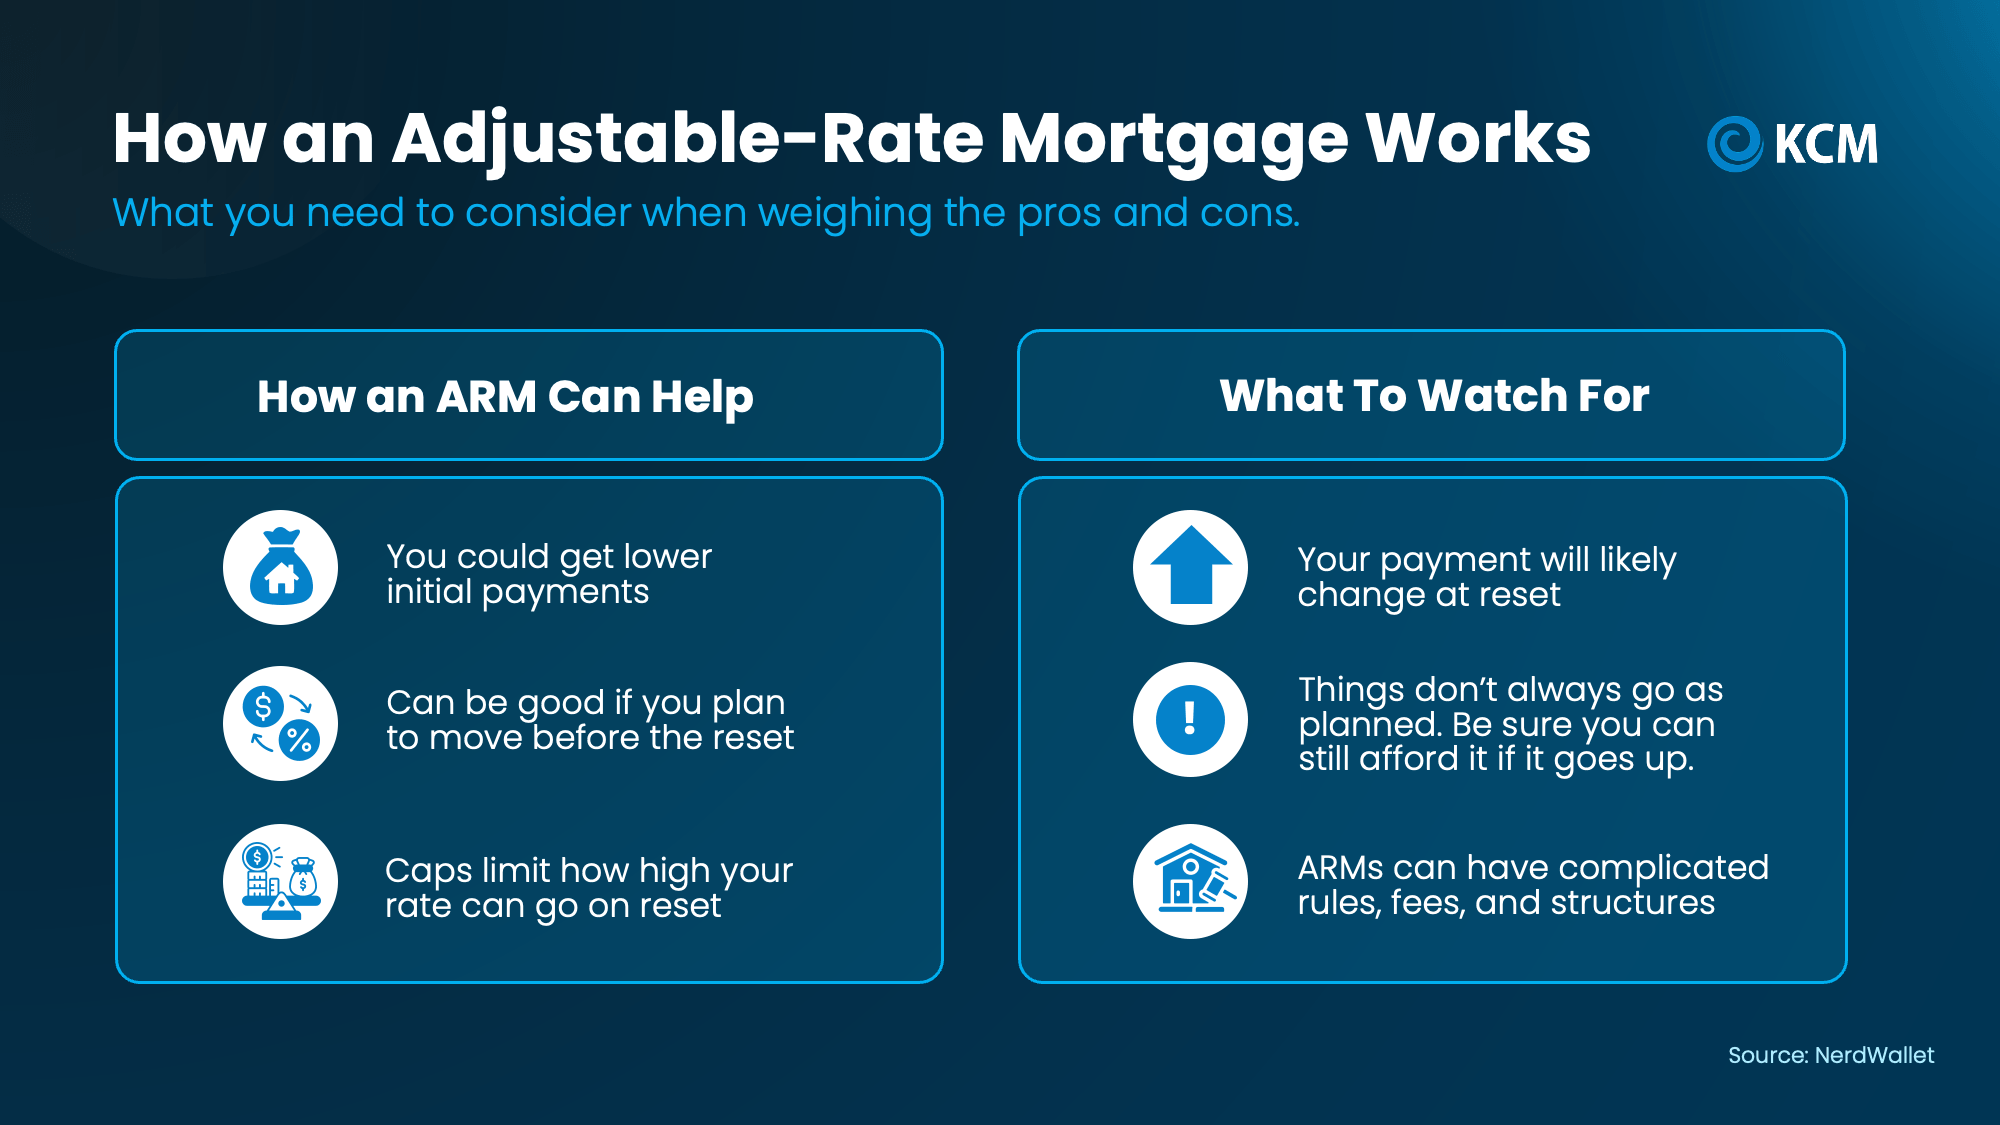
Before you decide, ask your lender to work up the numbers and walk you through the different potential scenarios you could run into with an ARM. That way, you go in with your eyes open.
Be Ready for the Reset
And, if you do go with an adjustable-rate mortgage, just know that you’ll have choices when the reset time arrives. You could:
-
Do nothing and keep your loan in place if the new payment still fits your budget.
-
Refinance into a fixed-rate loan with a payment that never changes.
-
Refinance into another ARM with a new lower rate locked for a specified timeframe.
-
Sell your home.
-
Talk to the loan servicer about assistance or modification.
Remember, a refinance is a brand-new loan that you’ll have to qualify for – even if it’s on a home you already own. So, keep tabs on your credit and debt levels and ask your loan officer how major financial moves like job changes and major purchases will affect your mortgage readiness. It’s important to keep your credit and finances in “mortgage shape.”
Today’s ARMs Aren’t Like 2008
One more quick note. ARMs got a bad name after the financial crisis of 2008. Back then, there were some risky loans with small starting payments that later shot way up. Others let people borrow without proving how much money they earned.
But now, there are new laws to protect both borrowers and lenders. The biggest change is the Ability-to-Repay Rule, which says that before a lender makes a home loan, it has to check real paperwork (like pay stubs, W-2 forms, and tax returns) to make sure you can afford it. The lender also has to look at what your payment could be after the reset, not just the low starting payment.
So, you don’t have to worry that today’s ARMs are the same as the ones we saw back during the crash.
Bottom Line
Today’s market has more options than many people realize. Finding the right one could be as simple as getting more information about tools like ARMs. A trusted lender can run the numbers with you, walk you through the what-ifs, and help you explore the possibilities.
Is an ARM a good option for you? Talk to a loan officer to find out.
Whether you own a house already or you’re looking to buy one, you probably care about home prices. But it’s not always easy to figure out what’s really happening right now, especially if you look at the headlines.
One says home prices are falling. The next says they’re still climbing.
So, which one’s right? It comes down to where you live.
What’s Really Going on with Asking Prices
Part of the confusion out there may be based on what’s happening to asking prices and how the media is talking about it. They’re calling attention to how asking prices are falling, but don’t give the full context or say that seasonality is at play. So here it is.
Right now, there are more homes on the market than at any other time since November 2019. And with mortgage rates rising since the spring, those homes are taking a little longer to sell. One way to help a home sell quickly in that environment is to have a lower asking price.
According to HousingWire Data, the median asking price is down from $449k in early August to $435k just 2 months later (see graph below):
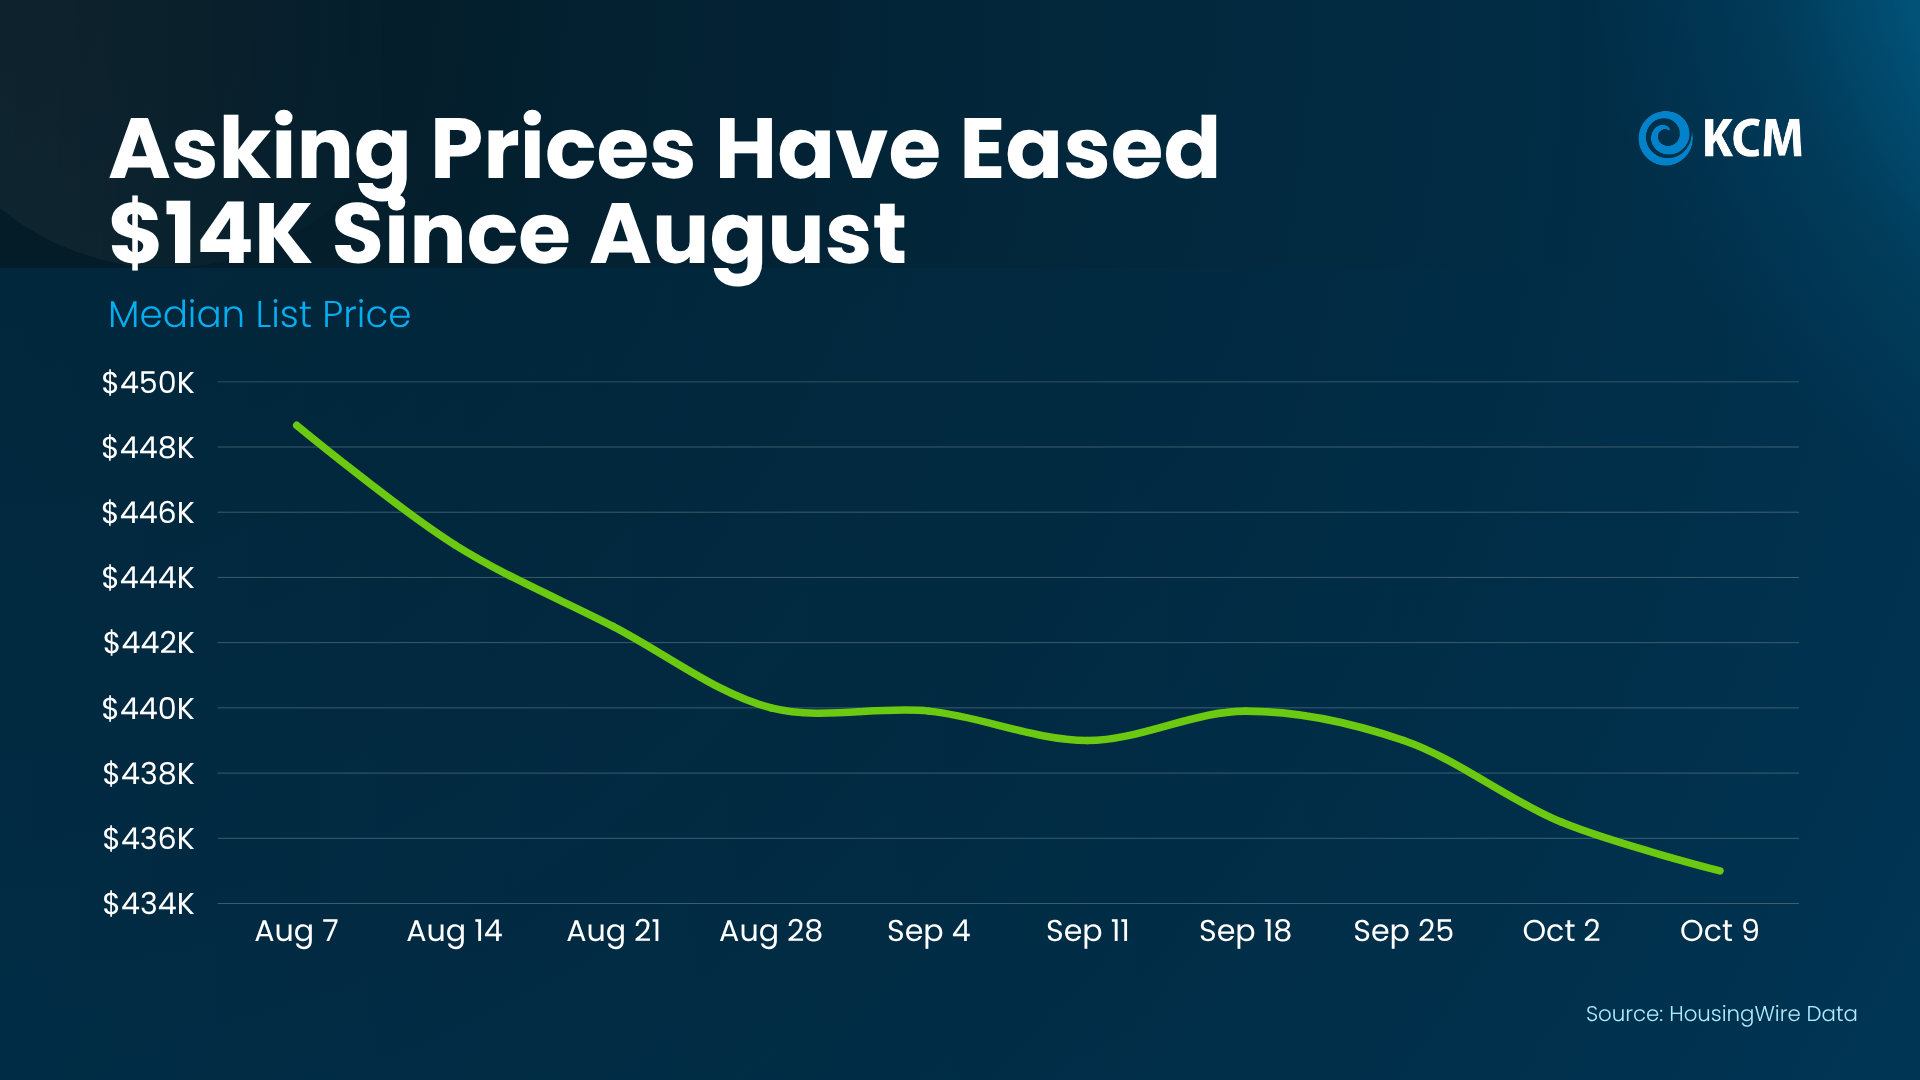
That’s a dip of about 3%, and a lot of it is normal for this time of year.
Asking prices cool off every fall once the busy summer season wraps up. With fewer buyers this time of year, sellers price a bit more competitively. Today’s rates play a role too, since sellers are pricing to match what buyers can afford right now. And that’s a good thing. Smart pricing helps homes sell.
Just keep in mind, that’s a national list price. It doesn’t show what homes near you are actually selling for. So before you react to a headline, ask a local agent what’s really happening in your area.
Where You Live Changes Everything
Realtor.com explains:
“While national headlines might suggest a buyer’s market is taking hold, the reality on the ground depends heavily on where and what you’re trying to buy. Local trends can diverge sharply from national averages, especially when you factor in price range, property type, and post-pandemic market dynamics.”
The latest numbers from S&P Cotality Case-Shiller Index show how true that is. Over the past year, sales prices in Chicago rose almost 7%. In Seattle, they dipped about 1.6%. That’s a gap of nearly 9 percentage points between two major cities (see graph below):
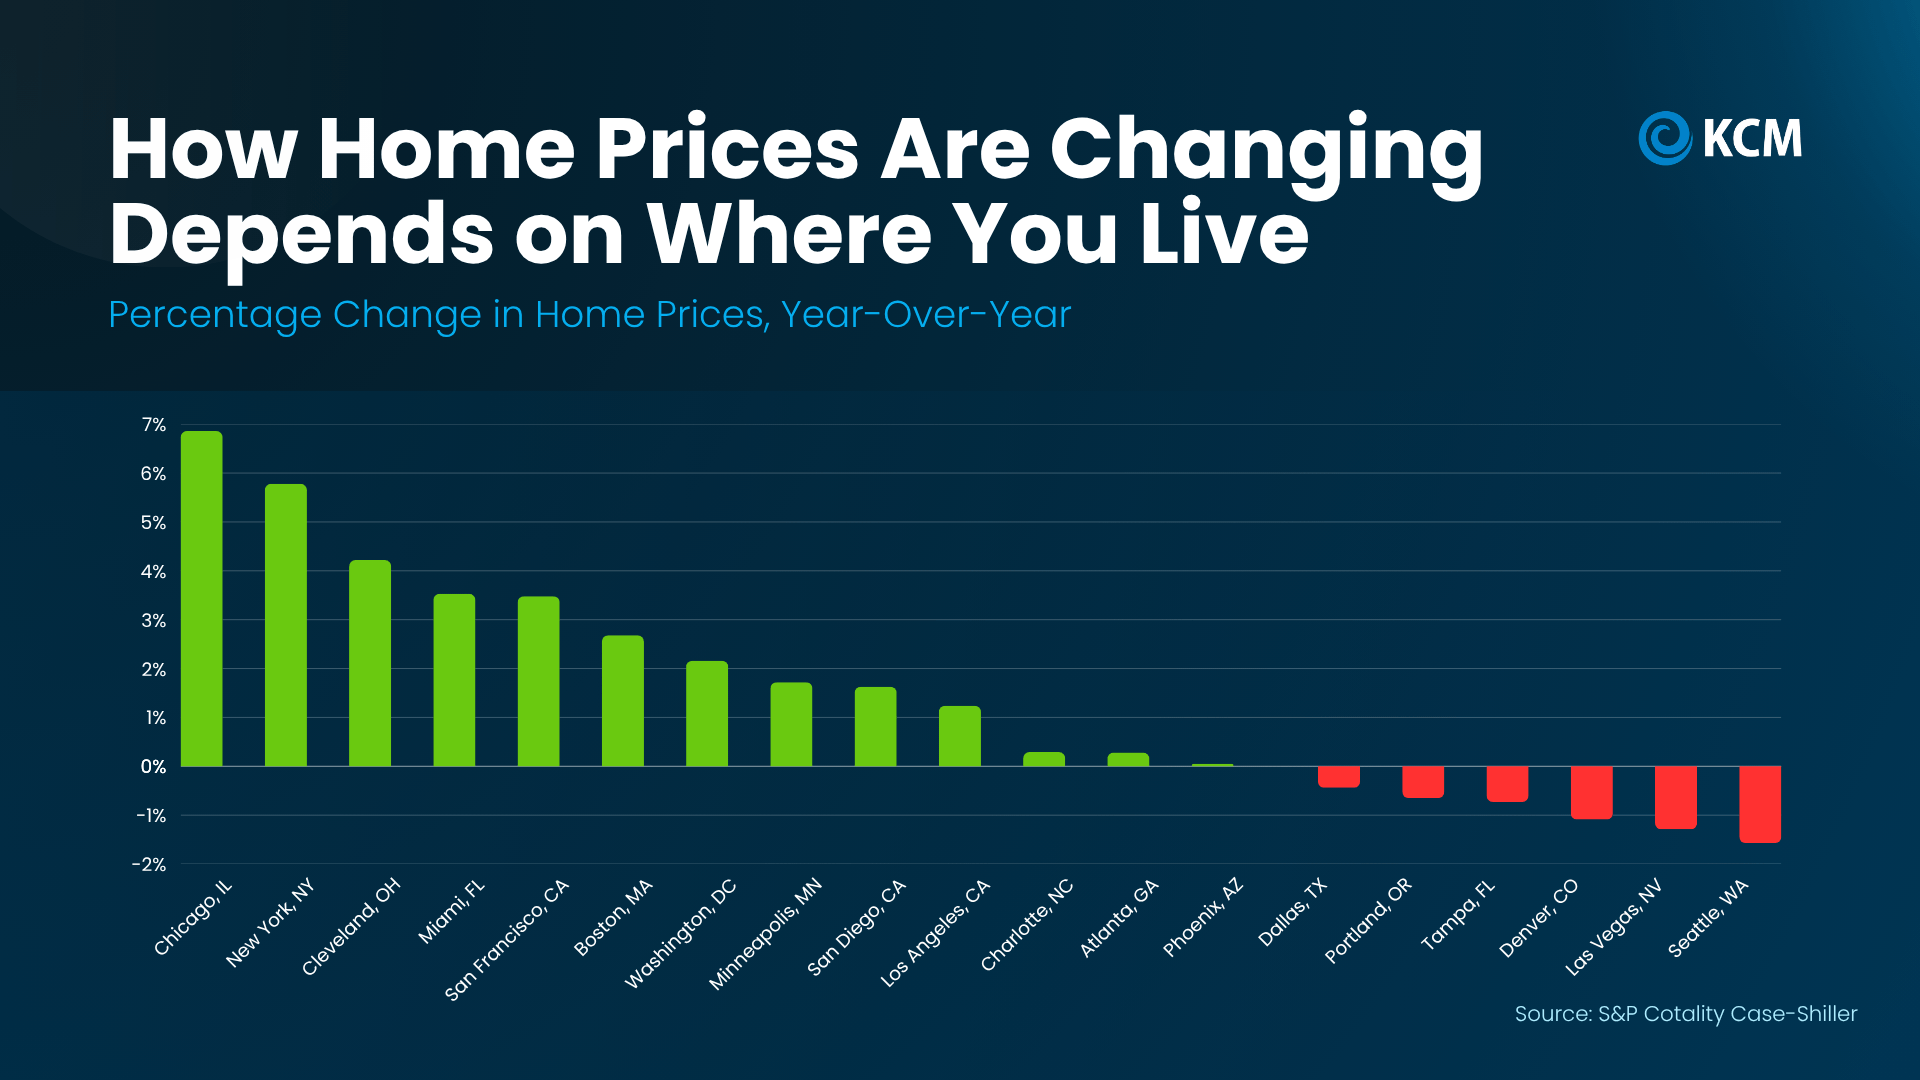
That gap changes your game plan. Selling in New York, where prices are up almost 6%? You may not need to cut your price. Buying in Denver or Las Vegas? You may have more room to negotiate.
Why You Don’t Need To Worry About a Crash
Just in case you’re seeing those slight declines in some markets and worried it means a bigger crash is coming, here’s what you need to remember. Even in the major metros where prices are down, the declines are 2% or less. That’s a long way from a crash like 2008. And if you look back at the graph above, there are more cities in the green than in the red.
And over time, home values have a strong track record. The Federal Housing Finance Agency (FHFA) says national prices have grown year-over-year every quarter since 2012. Go back further, and a $100k home bought in 1991 would be worth about $436k today, even with the 2008 crash factored in (see graph below):
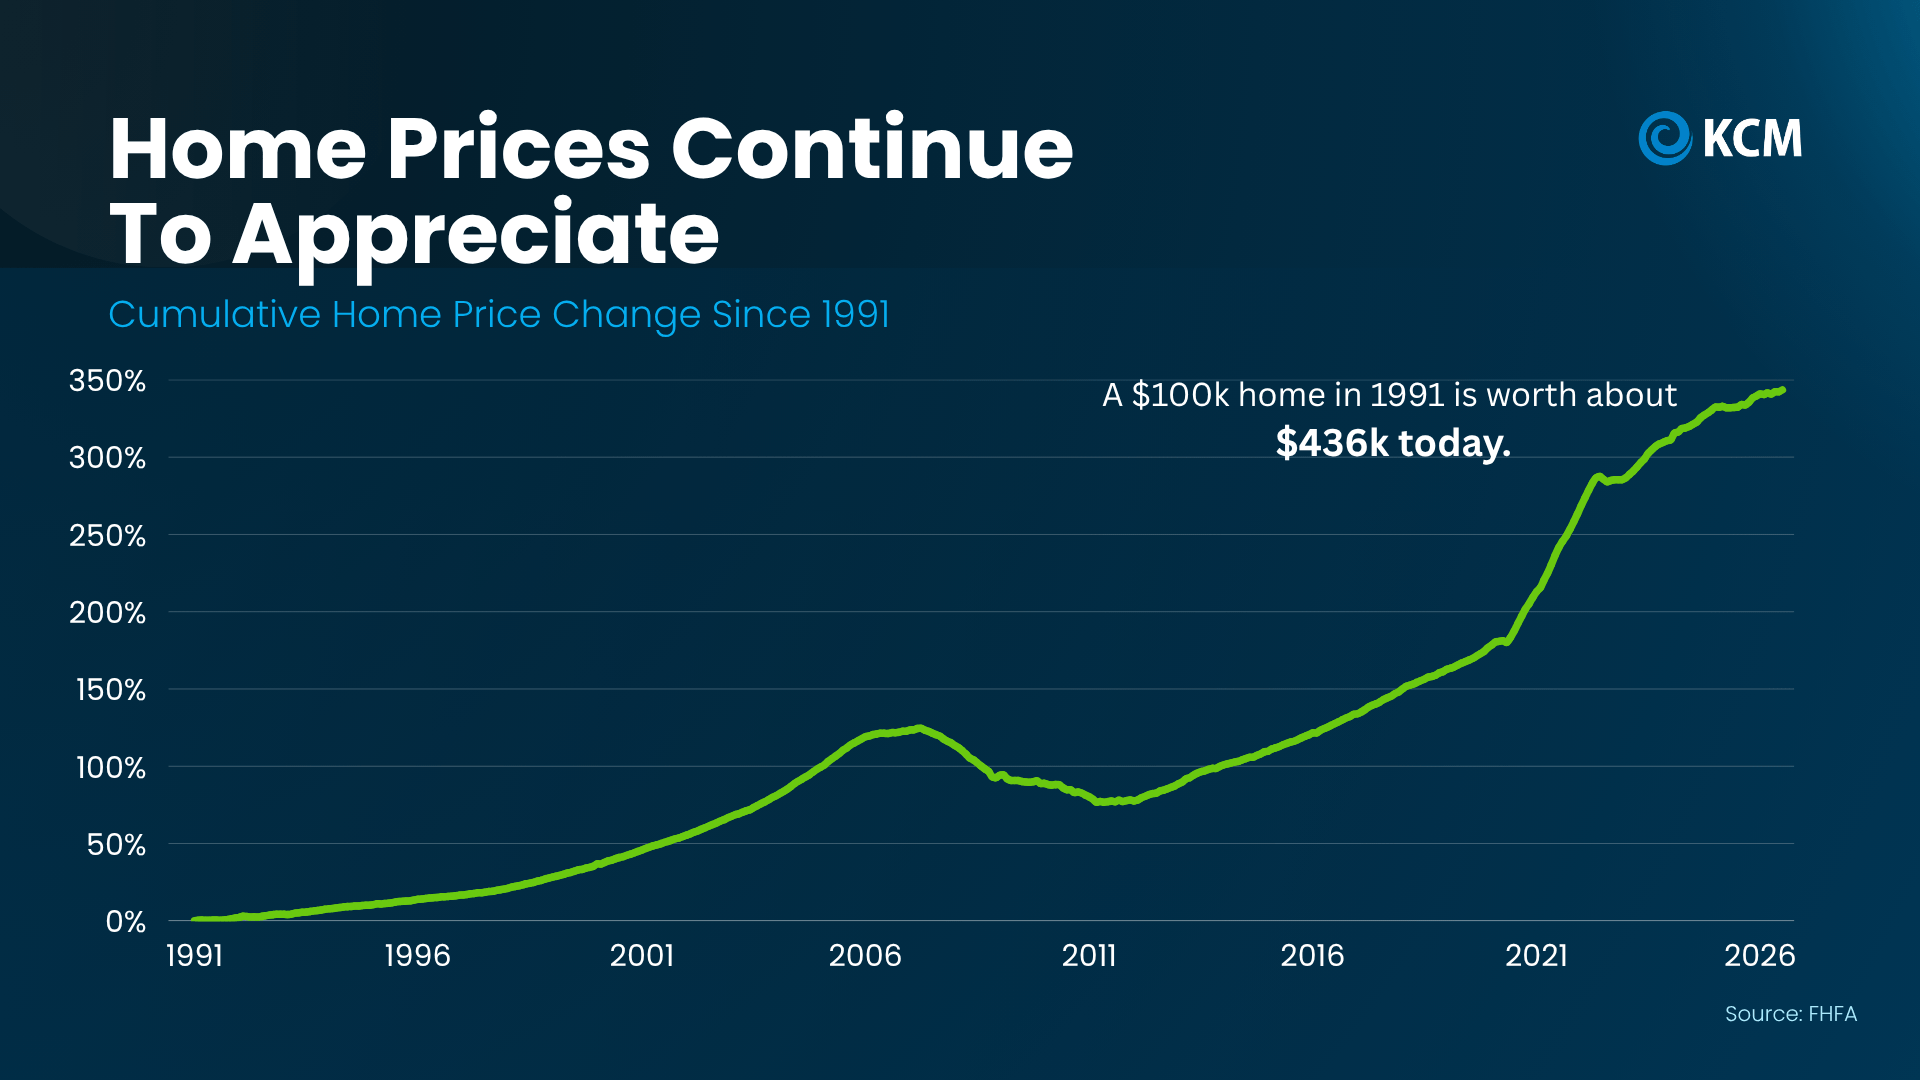
So, this short-term dip probably won’t stick around. The small declines we’re seeing now are in markets that overheated during the pandemic. As a whole, the market is headed back to normal – and normal means prices should rise over time.
Bottom Line
National headlines can’t tell you what your home is worth or how much room you have to negotiate. Local data can. If you’re thinking about buying or selling, connect with a local real estate agent to look at how prices are moving in your area, so you can set your price or make your offer with confidence.
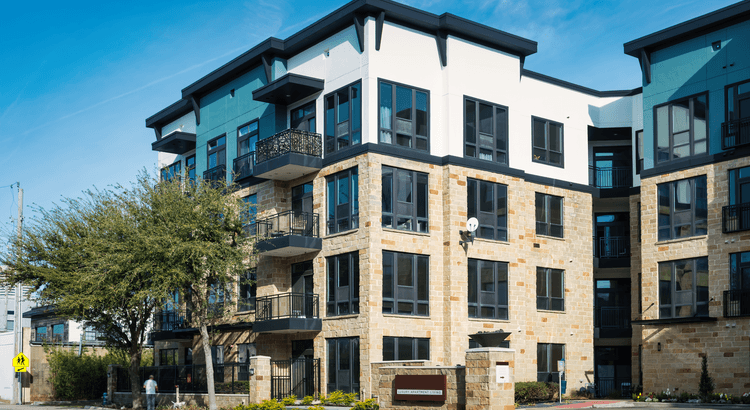
When you picture buying your first home, chances are you’re imagining a traditional single-family house with its own yard, maybe a garage, and little extra room to grow. But with affordability still tight, getting everything on that list right away may come with a higher price tag than you’re comfortable with right now.
So, if you’re running the numbers and buying a house like that feels like a stretch, there may be another way in. A condo.
Because in a lot of markets, condos come with a significantly lower price tag. And that could make them a smart way to get your foot in the door.
Condos Can Cost Less Than You Think
According to a recent study by Zillow:
“Condos are the most commonly affordable home type in virtually every metro. At the starter level, the savings can be pretty significant. Nationally, starter condos average $197,468 — that’s about 6% less than the typical starter home.”
And depending on where you live, the difference can be much bigger.
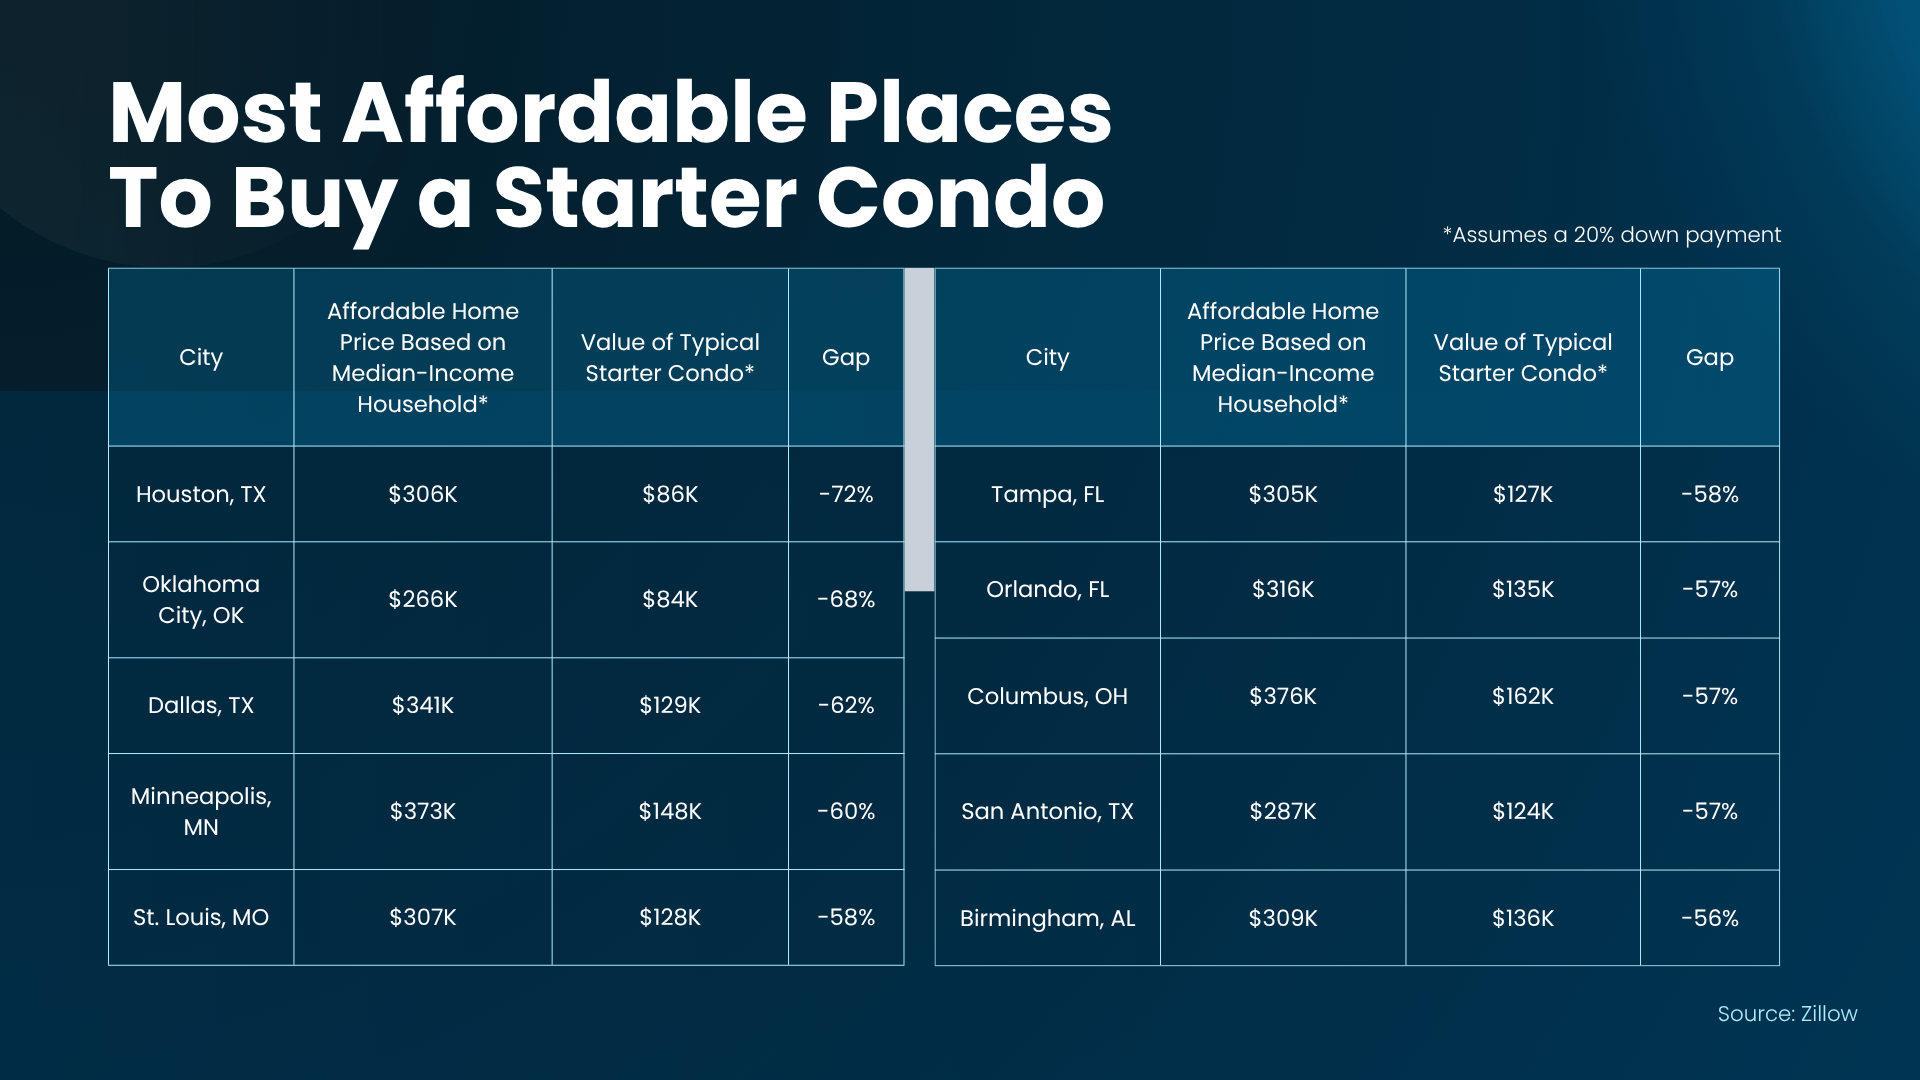
Zillow identified metro areas where typical starter condos are priced significantly below the estimated home price a median-income household could afford. Here are the top 10 according to that research (see chart below).
In Houston, the gap is at its widest. There, a typical starter condo was valued at about $85,600 – 72% below the price considered affordable based on the area’s median household income.
Of course, every market is different. But the bigger point is this: if you’ve only been searching for traditional single-family houses, you may be overlooking some of the more affordable options on the market.
And even if your city didn’t make this list, that’s okay. The trend holds true in many places across the country. Here’s why.
A Condo Could Give You a Different Way In
Part of the reason condos can cost less is pretty straightforward. They’re typically smaller. And less square footage can mean a lower purchase price.
So, if you can make do with a bit less space or you’re coming from a smaller apartment now, this can be a great way in. Plus, on the upside, you won’t have to buy a ton of furniture to fill out a bigger house. You can get a potentially lower price up front and spend less once you move in because you’ll need less new stuff to fill that empty space.
And more buyers are making that trade off on space to offset the current affordability challenges. Ali Wolf, Chief Economist for New Home Source, explains:
“In addition to favoring smaller floor plans, more consumers are showing a willingness to live in an attached home. This shift is not driven by a preference for shared walls, but by a pursuit of value.”
That’s really the heart of it. Looking at condos isn’t necessarily about wanting less. It’s about finding another way to make your move happen with the budget you have.
Don’t Rule Out an Option That Could Work
If you’ve been struggling to find a house you like at a price you can comfortably afford, talk to your agent about adding condos to your search.
You may find something in a neighborhood you thought was outside your budget. You could get access to amenities you wouldn’t otherwise have. And you may be able to become a homeowner sooner rather than waiting for the numbers on a single-family house to work.
While there are trade-offs like shared walls, less outdoor space, and an HOA fee to factor into your monthly budget, maybe that’s worth it if you finally get your own set of keys.
Plus, a lot of the times, a condo community comes with great amenities like pools, gyms, and the condo association handles at least some of the maintenance. Which is closer to what you’re used to from your apartment – it could make the transition to homeowner not just more affordable, but that much easier too.
Bottom Line
The first home you buy doesn’t have to be a single-family house. If affordability has been holding you back, talk to a local agent about expanding your search and see whether a condo could fit the price point you’re looking for.

Why More Buyers Are Turning To Adjustable-Rate Mortgages Today

To Sell or Rent? How To Choose the Best Path for Your House.

Confused by Home Price Headlines? Here’s Why.



-

 Buying Tips3 weeks ago
Hoping for (or Dreading) a Housing Crash? The Experts Just Weighed In.
-

 For Sellers3 weeks ago
What Higher Mortgage Rates Mean for Home Sellers
-

 Affordability4 weeks ago
Why So Many Sellers Are Cutting Their Price Right Now
-

 Affordability4 weeks ago
The Mortgage Rate You See Online Isn’t Necessarily the One You’d Get.
-

 Affordability3 weeks ago
Two Moves That Can Get You Into Your First Home Sooner
-
 Affordability2 weeks ago
Myth vs. Reality: Does the Fed Control Mortgage Rates?
-

 Downsize2 weeks ago
Renovate or Relocate? What To Know Before You Decide To Age in Place
-

 Affordability2 weeks ago
Why Most People Are Still Glad They Bought a Home
You must be logged in to post a comment Login