


For Buyers
Is Inventory Getting Back To Normal?

After years of it feeling almost impossible to find a home you want to buy, things are changing for the better.
Nationally, inventory is growing, and that gives you more options for your move. But here’s what you need to know. That level of growth is going to vary based on where you live. And that’s why you need an agent’s local market expertise.
Here’s a quick rundown of the current inventory situation, so you know what’s happening and what to expect.
Significant Growth Across the Nation
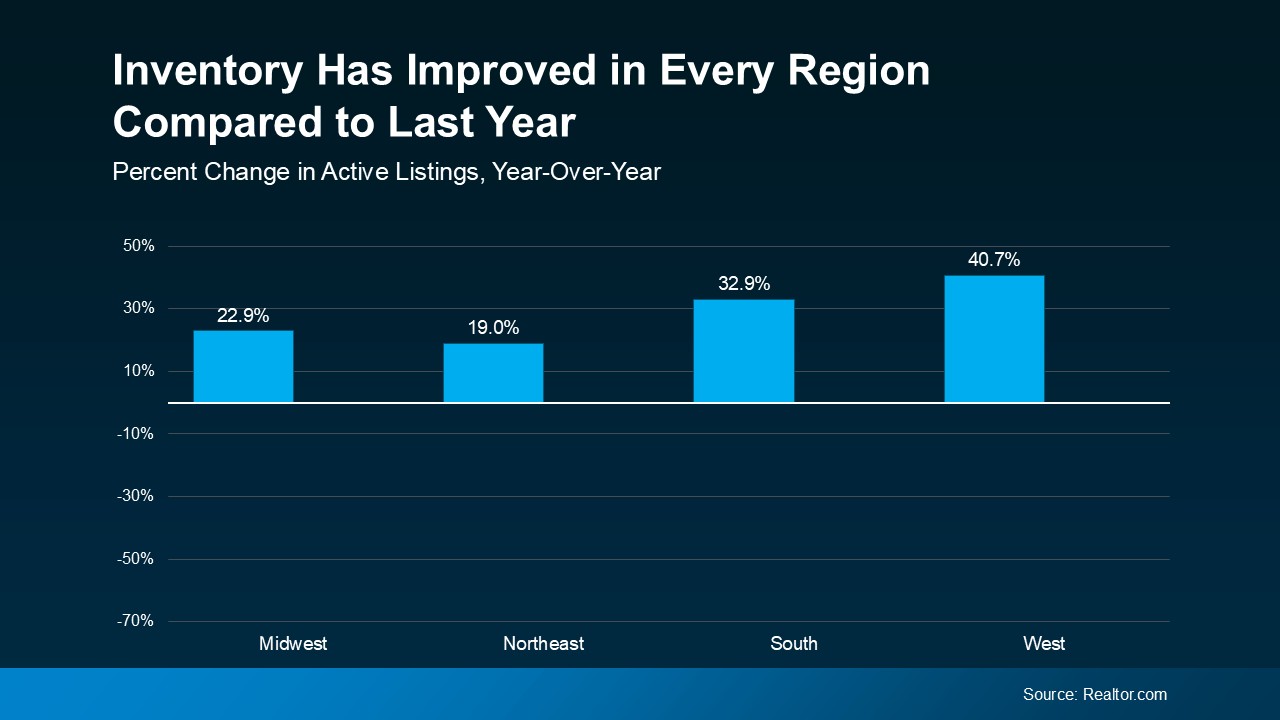
Nationally, the number of homes for sale is rising – and that’s true in all regions of the country. That’s shown in this data from Realtor.com. In each of the four regions, inventory is up at least 19% compared to the same time last year. In the West, it’s actually up almost 41% year-over-year (see graph below):
 There are two main reasons for this increase:
- More sellers are listing their homes. Many homeowners have been waiting for mortgage rates to drop before making a move. Now, some have decided they can’t wait any longer. May had more new listings than any May in the past three years.
- Homes are taking longer to sell. That means listings are staying on the market longer, which increases the total number of homes available. In May, the typical home took 51 days to sell – much closer to what’s more typical for the market.
More homes for sale helps the market become more balanced. For the past few years, sellers have had the upper hand. Now, things are shifting. Nationally, it’s not a full-on buyer’s market yet, but it’s heading toward a healthier place, especially for homebuyers. Danielle Hale, Chief Economist at Realtor.com, explains:
“The number of homes for sale is rising in many markets, giving shoppers more choices than they’ve had in years . . . the market is starting to rebalance.”
How Much Growth We’ve Seen Varies by Area
But, how long it’s going to take to achieve true balance is going to vary by area. Some parts of the country are seeing inventory bounce all the way back to normal levels, while others haven’t grown quite that much yet.
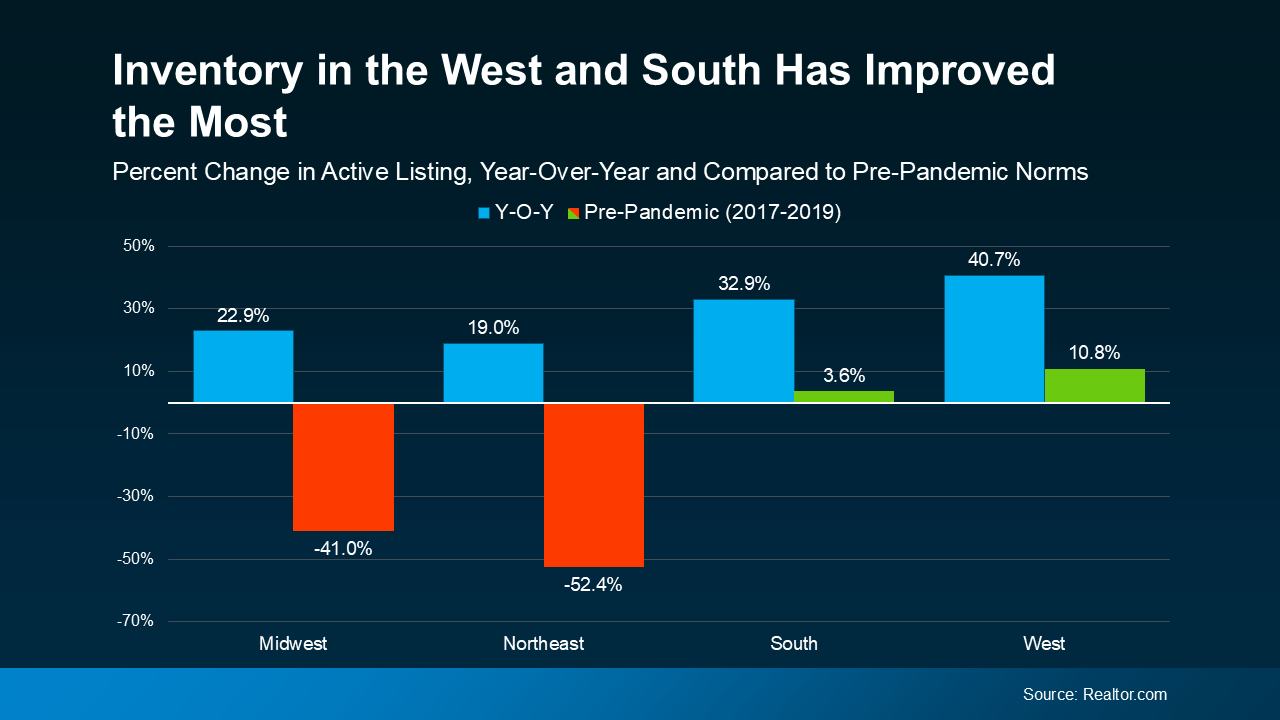
Let’s take a look at another graph. This time, we’ll compare the current data (what you already saw) to the last normal years in the housing market (2017-2019).
In this comparison, the green shows which regions are back at more typical levels for inventory based on the growth we’ve seen lately. The red shows where things have improved, but are still well below the norm (see graph below):
 Here’s what that means for you. Across the board, you have more options now than you would’ve just one year ago. And that’s a really good thing. More choices means it should be a bit easier to find a home you love.
But not all markets are the same – some will take a bit longer to get back to more typical levels. So, lean on a local agent to find out what the inventory situation looks like where you want to live. They’ll be able to tell you how much growth they’ve seen locally and how to tailor your home search based on what’s available in that area. This is just one of the reasons a local agent’s perspective matters.
Bottom Line
Inventory is getting better, but how long it takes to get back to normal is going to be different based on where you’re looking to buy. Talk with a local real estate agent about what’s happening in your local market and how it affects your next move.
What’s one thing you’ve noticed lately that makes the market feel different than it did a year or two ago?

Half the buyers out there are scared home prices are about to crash. The other half are hoping they will.
A recent survey from Clever found 58% of Gen Z buyers are actually rooting for a crash, just so homeownership feels within reach.
So, what do the forecasts actually say?
Every quarter, Fannie Mae surveys more than 100 housing experts on where prices are headed. The newest results are in. And spoiler alert: they’re not calling for a crash – not even the pessimists.
What the Newest Numbers Actually Say
The panel’s latest forecast has prices climbing every single year through at least 2030.
The panel’s average forecast is that prices will rise by 14.7% in the next 5 years. And here’s where it gets really interesting. If you split these experts into optimists and pessimists, even the pessimists still expect prices to increase about 6.6% by the end of 2030 (see graph below):
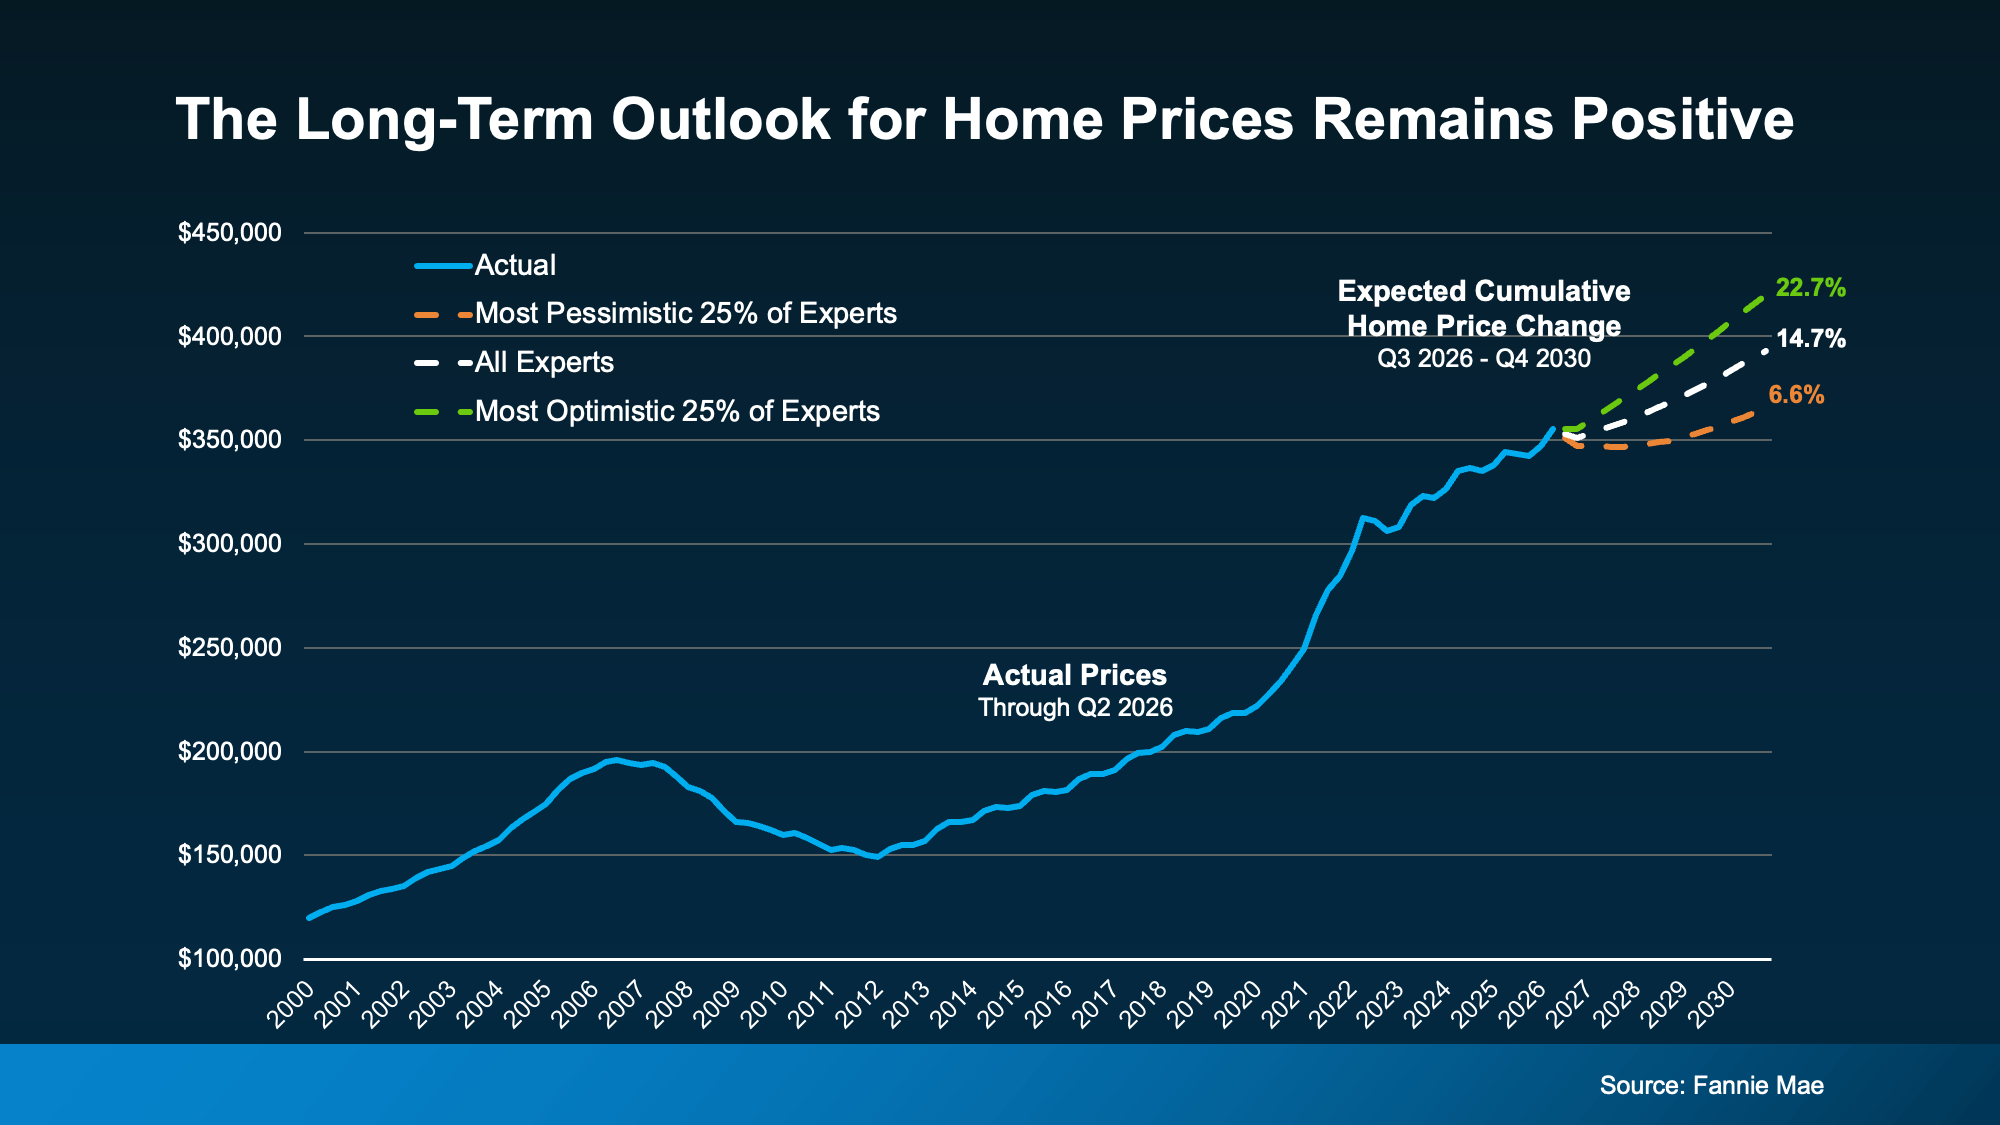
The takeaway? If you’ve been waiting for prices to fall, you may be waiting a while.
One thing to keep in mind though – these are national numbers. Prices in your area could run a little hotter or a little cooler than this, so it helps to know what’s happening locally, too. But the big picture is prices aren’t crashing. Historically prices usually rise.
How This Quarter Compares to the Past
Here’s something you probably don’t realize. This survey runs 4 times every year, so you can track the panel’s mood over time.
A year ago, the panel expected home prices to grow 2.1% this year. Now they’re forecasting 2.5%. That means the near-term outlook actually got more optimistic. But that’s only part of the story. The years after that shifted, too (see graph below):
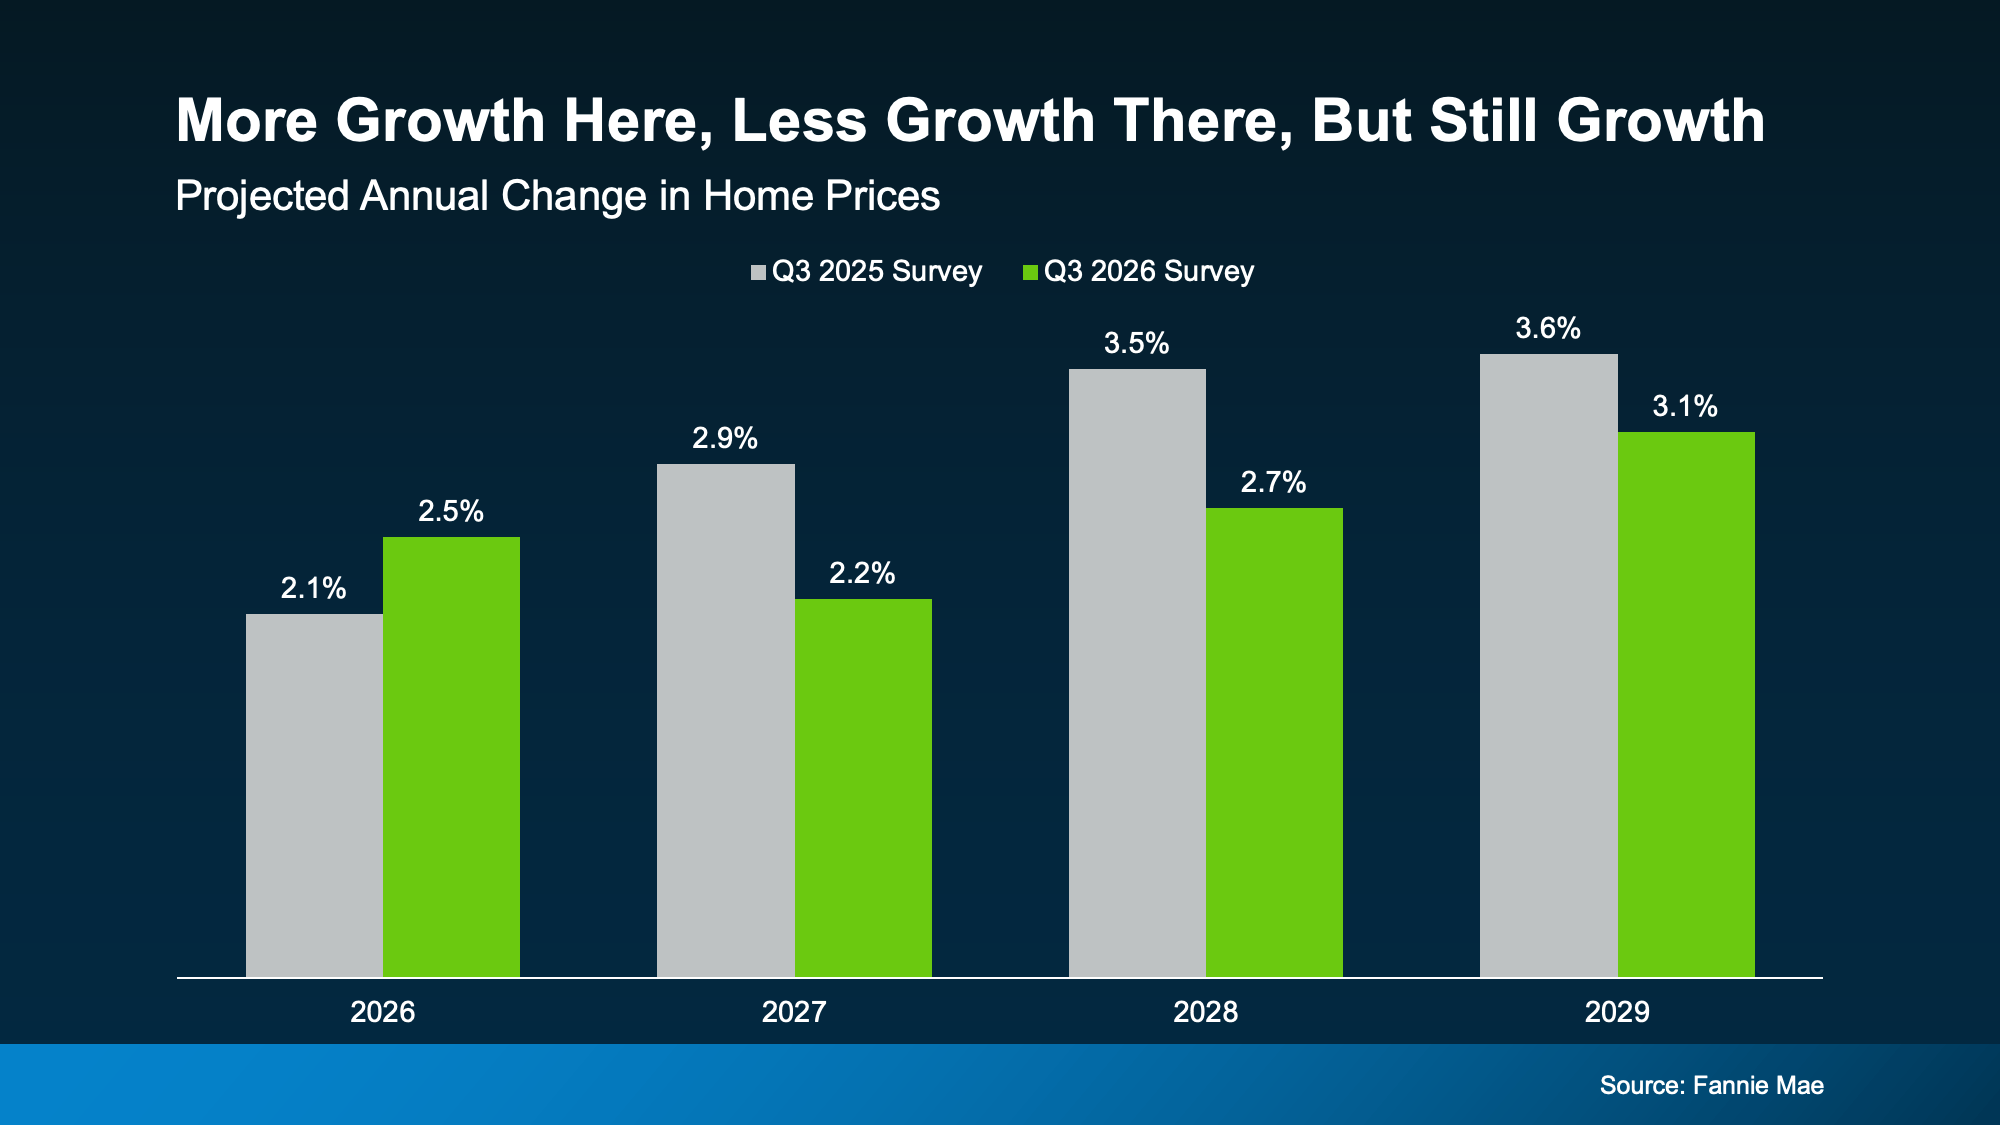
Zoom out to 2027 through 2029 and the mood has cooled a bit. Each of those years is now expected to see a little less growth than the panel thought a year ago. That’s likely a reflection of where we are right now with everything that’s impacting the housing market.
But again, the overall takeaway here is every bar shows an increase in prices – the size of that increase has just moderated due to some of the factors at play.
A slower climb isn’t a bad thing, though. It’s a sign the market is settling into a more normal pace after a few wild years.
A little more growth here, a little less growth there. What hasn’t budged once is the idea that home prices will keep growing.
What It Means for Your Next Move
Now, percentages are great, but you probably care more about the actual dollars and cents of your move, so let’s graph that out, too.
Run the numbers on a $400,000 home bought in January, and the panel’s latest forecast puts you up about $58,000 in equity in 5 years just from price growth (see graph below):
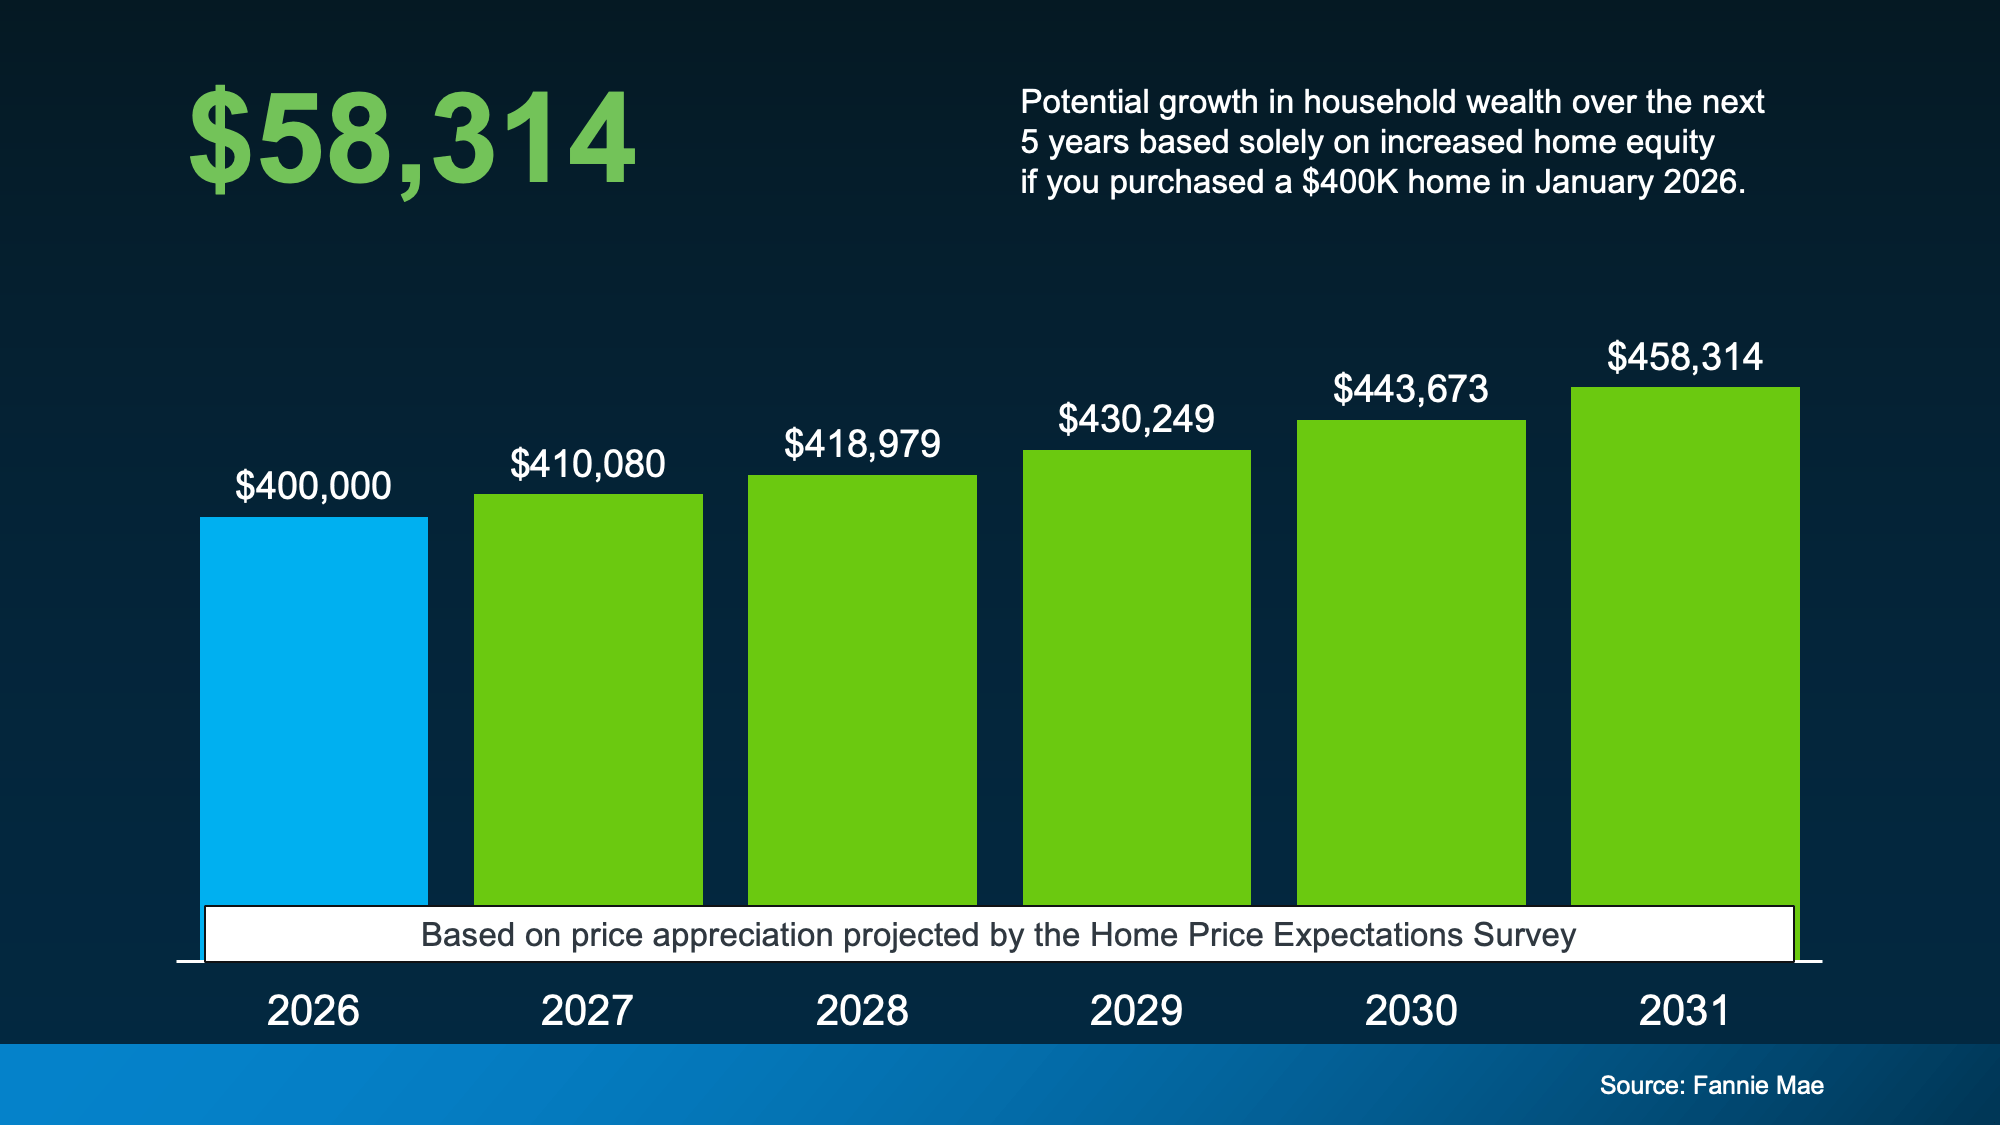
That’s real wealth you could be building while others sit on the sidelines, waiting for a crash the experts don’t see coming. And with prices expected to keep rising, waiting could mean paying more for the same home later.
Bottom Line
Whether you’re bracing for a crash or hoping for one, the verdict is the same – prices are still expected to rise, not fall. Talk with a local real estate agent about what that means for your market and your plans.

You may have seen the headlines saying mortgage rates have climbed to the highest point since January 2025. And if that’s left you reluctant to buy a home, here’s what you need to remember…
That’s not necessarily the number you’d get.
It’s a common misconception that the rate you see in the headlines is the same one you’d get when you buy. The truth is, mortgage rates shift often, and the rate you actually end up with can vary a lot from what you may see or hear about.
What Determines Your Real Rate?
Advertised rates and “real rates” aren’t always the same. That’s because real rates are based on your specific situation, which includes your overall finances and goals. The rates you see in the headlines can’t possibly reflect that.
That’s why only a lender can tell you what your real rate will be. To figure out your unique number, they’ll look at:
-
Your credit score: Your credit score includes your payment history (if you’ve made late payments – and how often), credit utilization (are your accounts maxed out, or do you have available credit?), and the length of your credit history (how long have your accounts been open?). For example, someone with an exceptional credit score may qualify for a better rate.
-
Your debt-to-income ratio (DTI): This is calculated by dividing your monthly debt payments by your monthly income before taxes to come up with a percentage. The higher your DTI, the higher your rate could be.
-
The down payment size and Loan-to-Value (LTV): Your down payment is the percentage of the home’s price you will put down. The LTV is the percentage of a home’s sales price that equals your mortgage.
-
The type and term of loan program options: Your loan officer will walk you through different loan options based on what you qualify for. Mortgage rates can vary between different loan products and programs.
Even after you find a home you love, other things can have an impact too. For example:
-
A mortgage rate buydown: This helps you get a lower mortgage rate, and by extension, a lower monthly payment, by paying an upfront cost. Sometimes a seller, builder, or another party may even offer to cover that cost themselves as an incentive for you to buy.
-
Seller concessions: Sellers are allowed to pay buyer closing costs according to most loan program guidelines. Seller-paid closing costs can add up to thousands of dollars, which can free up some cash for you to increase your down payment, pay down debt, or make other financial adjustments to try to get a better rate.
There’s a lot that can ultimately have an impact on your actual rate.
Your First Step? Getting Pre-Approved.
If you want to know if your number could be higher or lower than the headlines on social, you need to talk to an expert. A simple conversation with a loan officer can help you determine when you’ll be ready to buy, how much you can borrow, and of course, what your real rate will be.
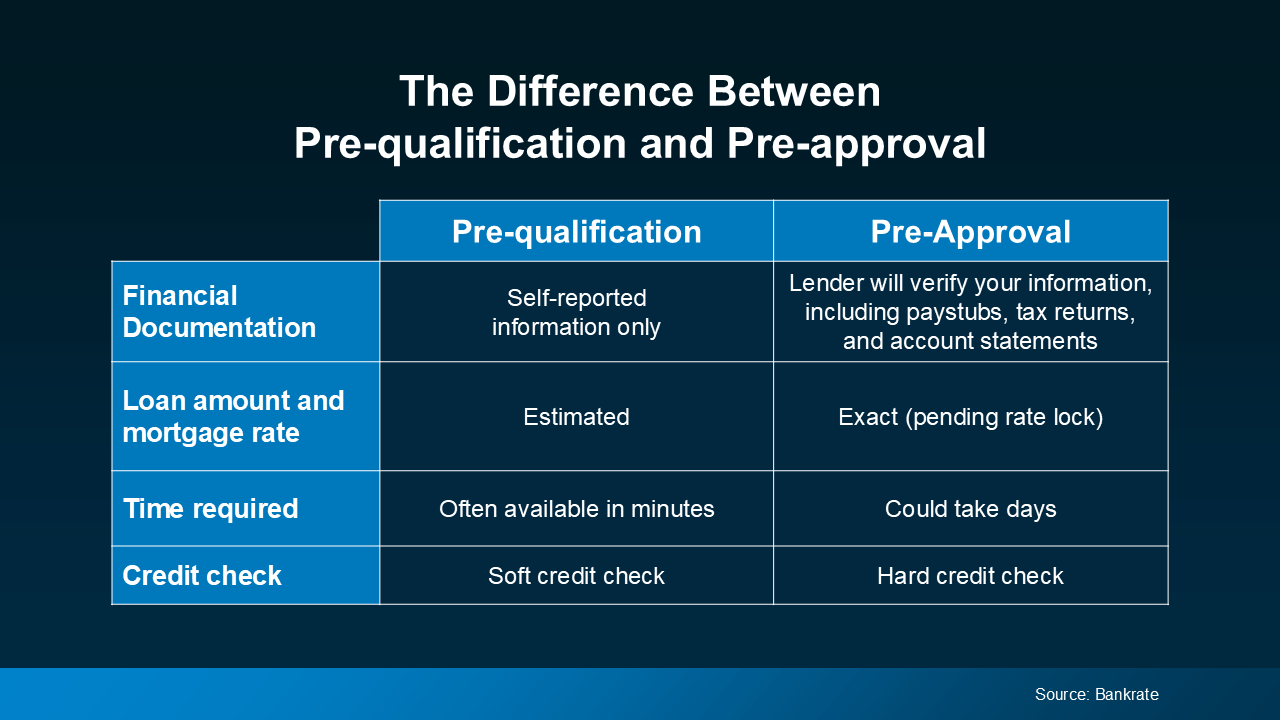
Your lender may recommend a pre-qualification and pre-approval:
-
Pre-qualification is a general estimate of what you might be able to borrow based on self-reported information.
-
On the flip side, pre-approval is actually a conditional commitment from a lender based on verified information.
Just know that, of the two, the pre-approval process gives you a more accurate picture of your options than pre-qualification. Bankrate gives a quick comparison so you can see why:
How To Get Ready for the Conversation
Ask your lender what documents you’ll need to gather for that conversation. And keep these questions in your pocket too. They’re good things to go over when you talk:
-
What will I gain or lose by waiting to buy a home for 3, 6, or 12 months?
-
Will I get any tax advantages by buying a home – and what are they?
-
What’s the benefit of buying a home and starting to build equity now versus waiting? And how does that impact my finances in the long run?
-
How will rate changes in either direction affect me?
Once you find out your rate, maybe you can buy now. Or maybe you still need to wait. But at least you’d know your options and can make an informed decision.
Bottom Line
Headlines and social media make today’s rates sound high. But you have to remember, the rate you’re seeing online and your actual rate could be different. The only way to know what your rate could be is to talk to a trusted lender.
With the right help, you can find out what your real rate is – and where it can take you.

Price cuts are turning up everywhere right now, and they read very differently depending on which side of the deal you’re on.
Sellers tend to worry a cut means walking away with less than they hoped. Sometimes that’s true, but more often it just means the market moved faster than the listing did.
Buyers, for their part, often assume a cut means something’s wrong with the house. Most of the time, that’s not it.
This is what’s actually driving all those price cuts, and why it matters no matter which side of the deal you’re on.
42% of Homes for Sale Are Now Carrying a Price Cut
According to HousingWire Data, the share of sellers cutting their asking price has climbed every month for 7 straight months (see chart below):
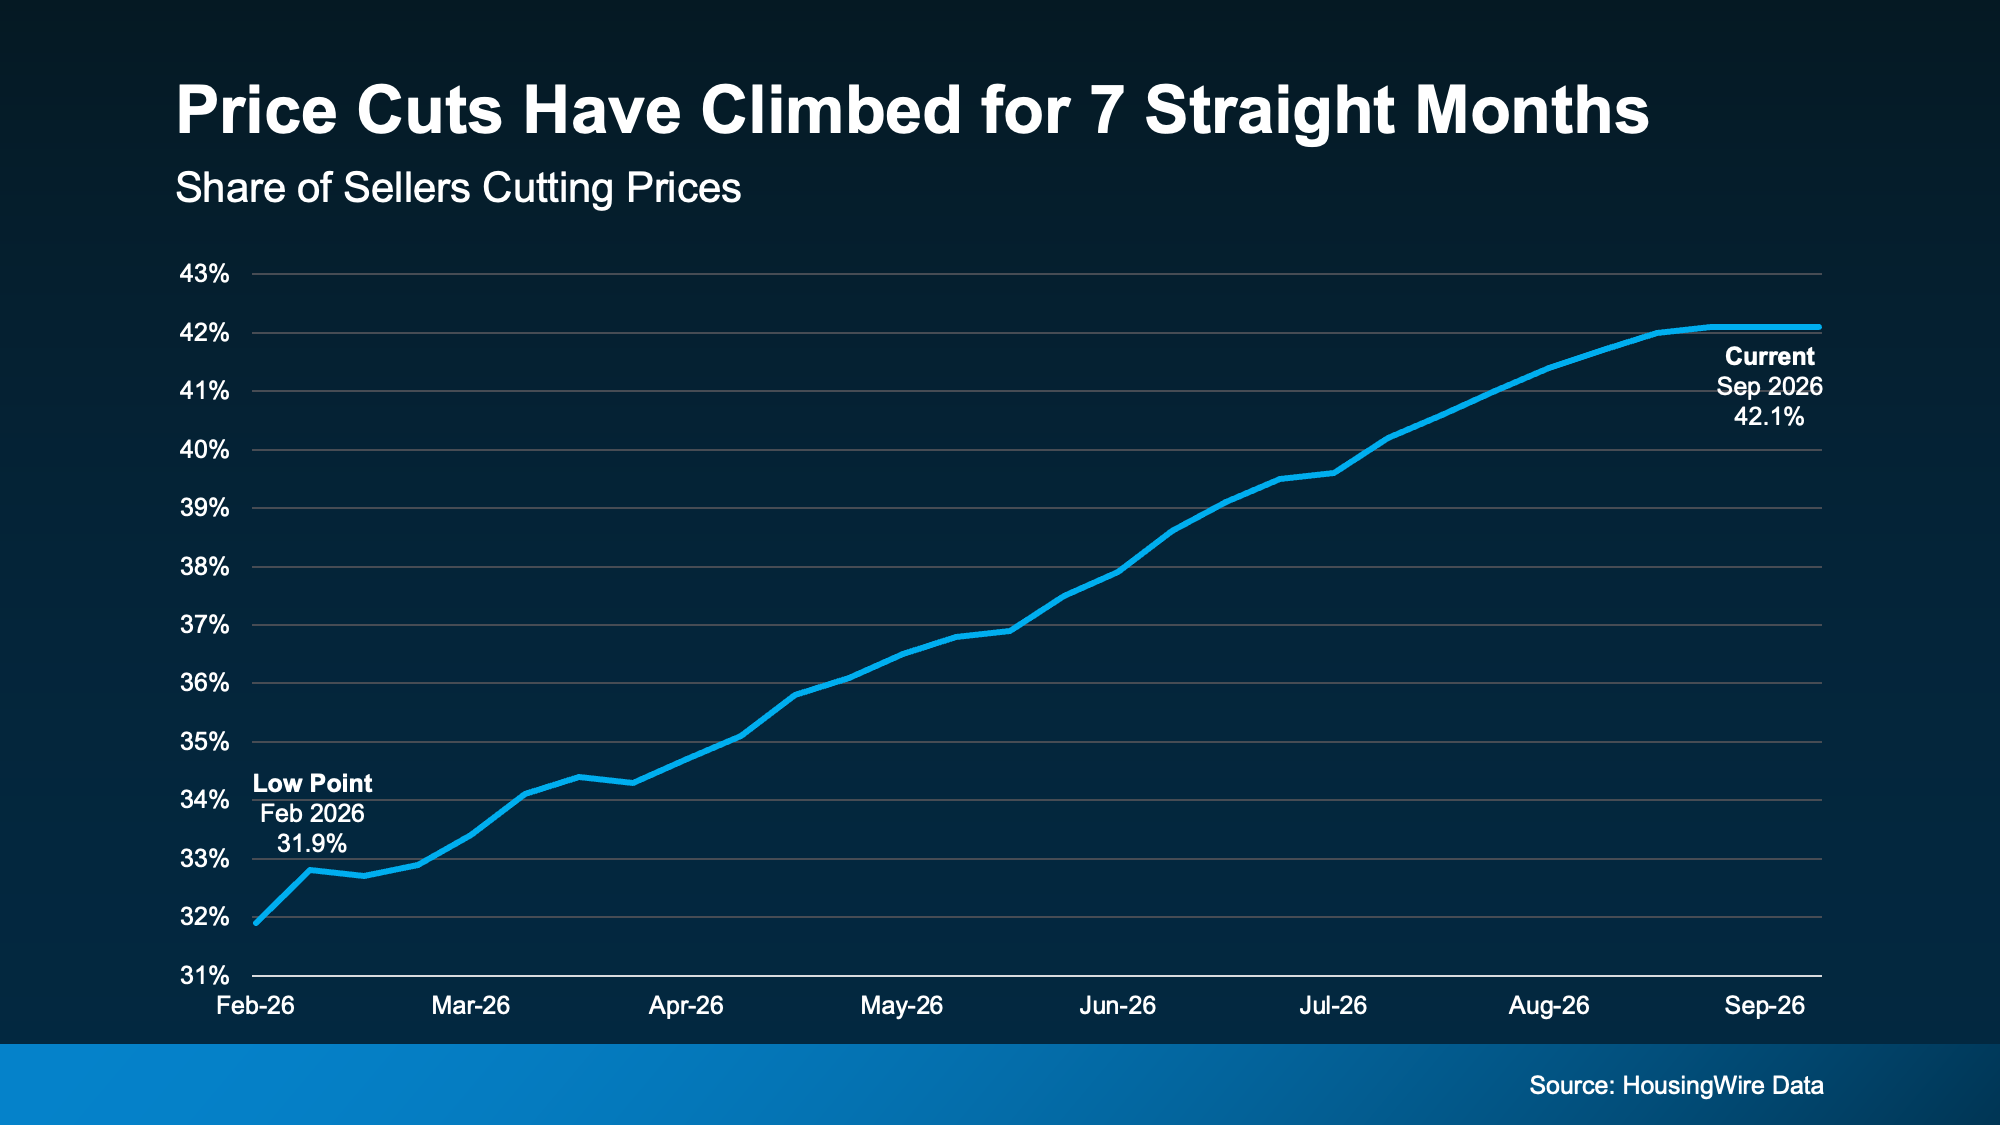
Today, more than 4 in 10 active listings have had at least 1 price cut, and the typical seller is cutting about $17,560 off their original number.
Here’s why that’s happening. With rates still elevated and more homes to choose from, buyers can afford to wait for the right number. So, sellers who don’t start there often end up adjusting anyway.
What does that mean for you?
-
If you’re selling, this isn’t a red flag. But it is a sign that pricing it right from day 1 is your best bet. Just know that the market’s been shifting fast enough this year that sometimes even a well-priced house can fall behind within a matter of weeks. If that happens to you, dropping your price to catch up to where pricing actually stands today tends to bring in more buyers and helps you sell closer to true market value.
-
If you’re buying, it’s easy to assume a price cut means something’s wrong with the house. But with cuts happening on more than 4 in 10 homes right now, the reality is sellers are just catching up to where the market already is. And with affordability still tight, that’s exactly the kind of opening you need to get a better deal.
Why Sellers Are Adjusting Faster than Before
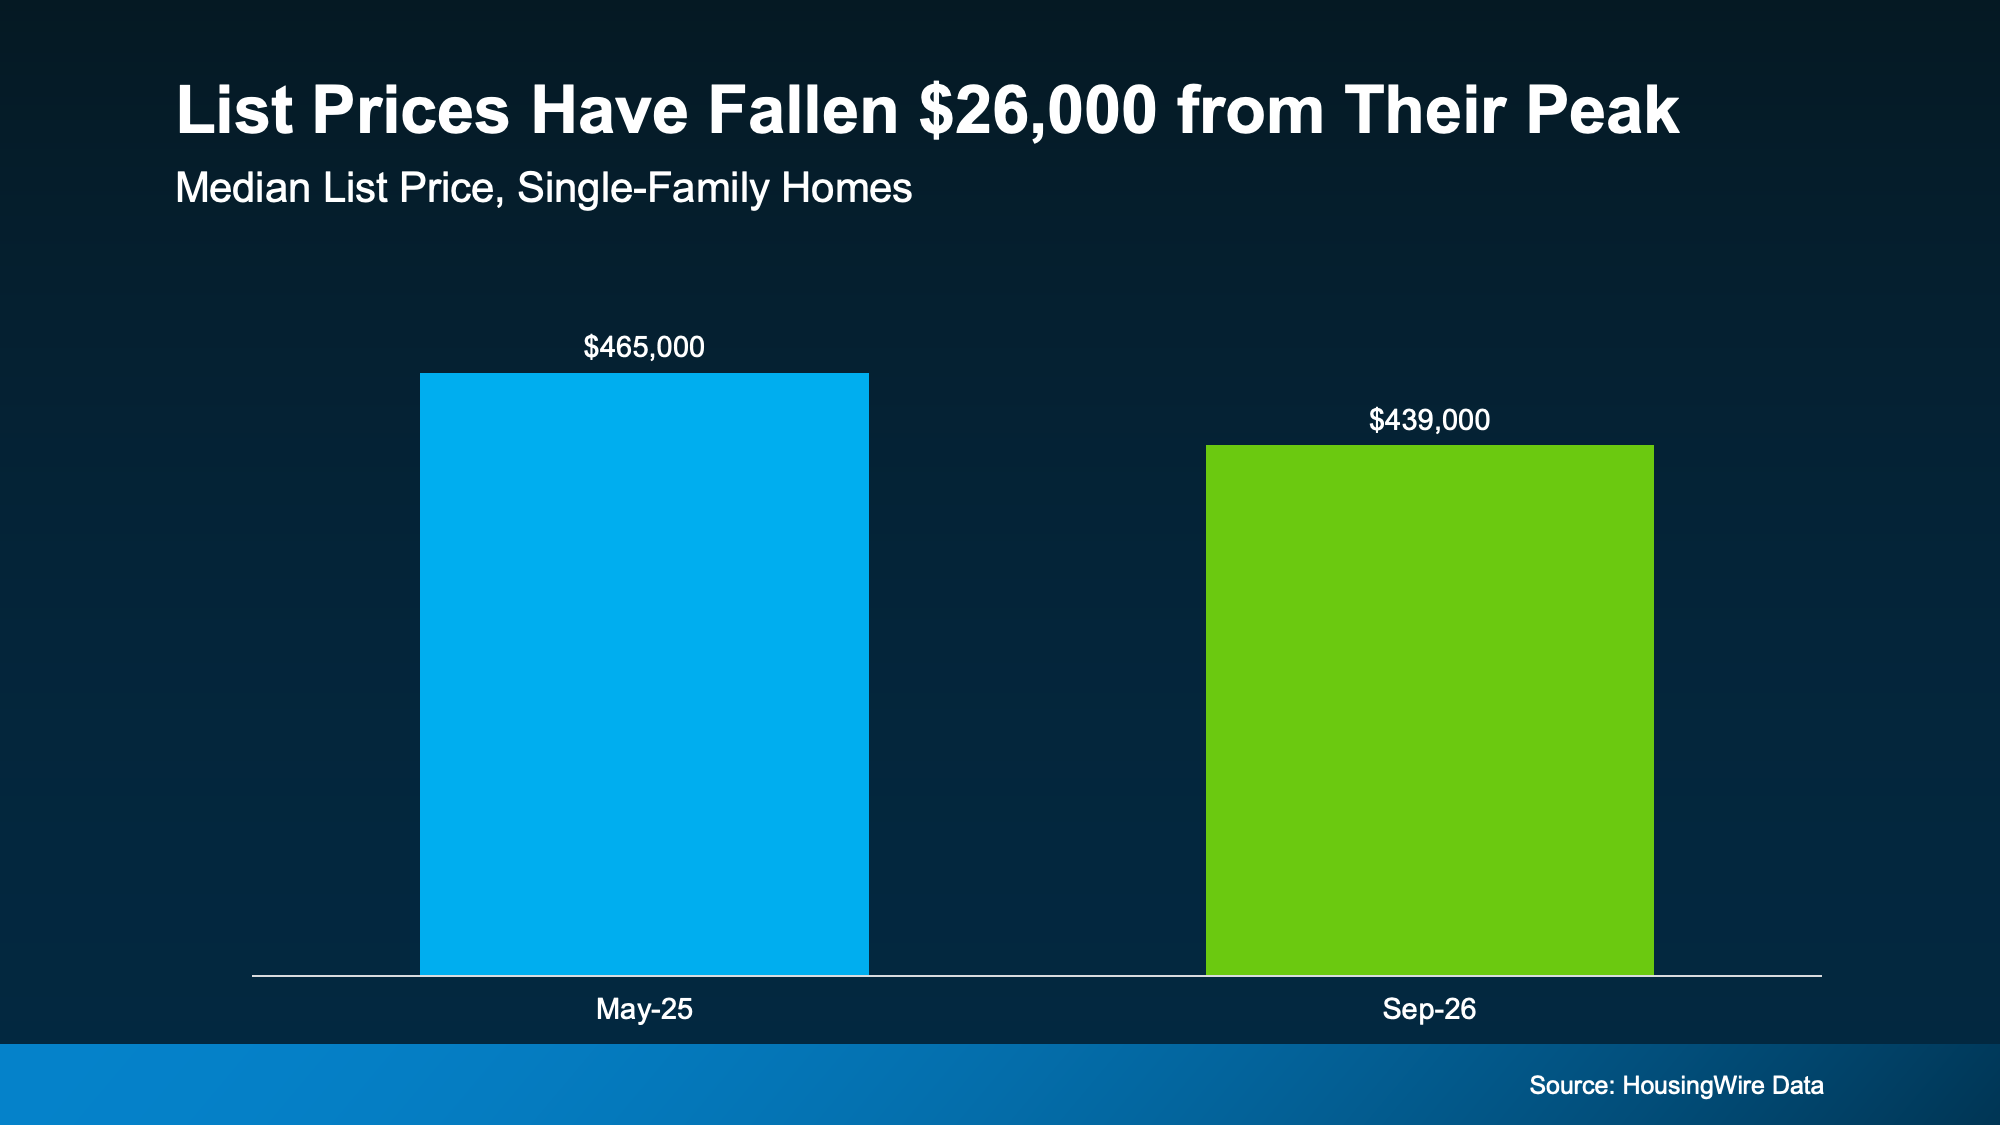
HousingWire Data also shows list prices are trending down nationally. That’s often a sign sellers are pricing more realistically from the start instead of listing high and getting stuck cutting later. List prices have fallen about $26,000 from last year’s peak.
Some of that decline is seasonal, since list prices typically soften each winter before rebounding in the spring. So, expect asking prices to keep drifting a little lower before turning back around (see chart below):
Jake Krimmel, Senior Economist at Realtor.com, explains:
“That is good news for buyers, who are seeing lower asking prices and more room to negotiate, but it is also good news for sellers: Pricing to today’s demand is helping homes move and keeping more transactions alive in a high-rate environment.”
Translation – with rates still elevated, buyers can only stretch so far. Sellers who meet them where they are instead of holding out for unrealistic prices are the ones actually getting to closing. And doing that up front is always better than chasing the market later.
Buyers, You’ve Got Room To Negotiate Again
At the same time, Redfin data shows sellers now outnumber buyers by about 58%, the widest gap on record (see chart below):
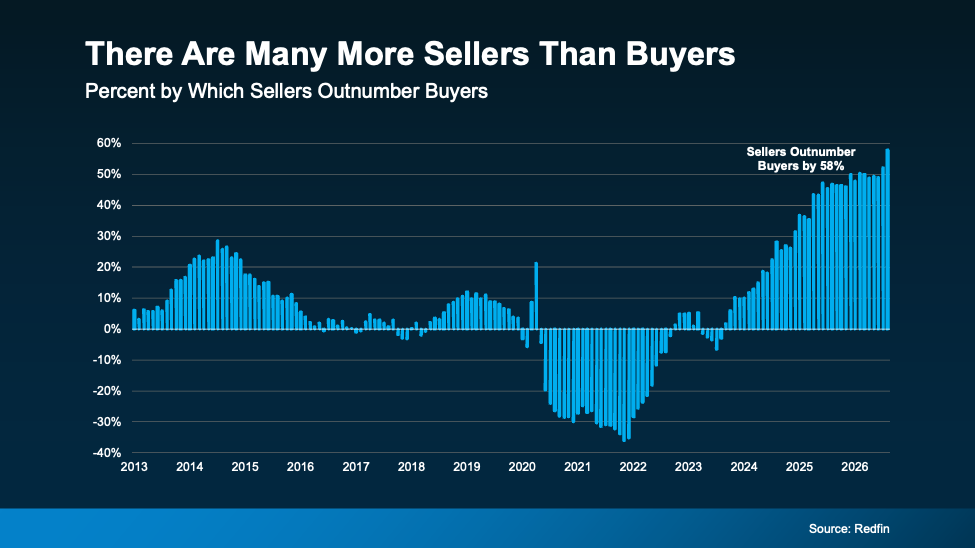
That changes the power dynamics of the market – and impacts how homeowners should price their house. Nationally, about 7 in 10 markets now favor buyers or are trending that way.
-
For sellers, that means standing out matters as much as pricing. With more homes to choose from, buyers are comparing you directly against the competition. So, a little flexibility, like covering closing costs or being open on timing, can be what gets your house picked over another.
-
For buyers, it means more room to ask for a lower price, help with closing costs, repairs after inspection, or some combination of all 3. That’s especially true for homes that have already sat for weeks, where sellers are often the most willing to talk.
Bottom Line
Price cuts are a normal part of today’s housing market, and both buyers and sellers can use them to their advantage. Connect with a local real estate agent to look at what’s actually happening with prices in your neighborhood, so you know exactly where you stand before you list or make an offer.

Hoping for (or Dreading) a Housing Crash? The Experts Just Weighed In.

The Mortgage Rate You See Online Isn’t Necessarily the One You’d Get.

Why So Many Sellers Are Cutting Their Price Right Now



-

 Affordability4 weeks ago
Why Buyers Shouldn’t Overlook a Fall Move
-
 Affordability4 weeks ago
Think New Homes Cost More? Not Right Now.
-

 Affordability3 weeks ago
Remote Work Could Be Your Affordability Answer
-
 For Buyers3 weeks ago
Data Centers Are Moving Closer to Homes. What Does That Mean for You?
-
 Agent Value3 weeks ago
The Housing Market Split in 2. Which Side Is Your House On?
-

 Agent Value2 weeks ago
Selling This Fall? You Haven’t Missed Your Window
-

 For Sellers2 weeks ago
Selling This Fall? You Want To Get These 4 Things Right.
-

 Affordability2 weeks ago
The Best Time To Buy a Home in 2026 Is Almost Here
You must be logged in to post a comment Login