Connect with us

For Buyers

The Best Way To Keep Track of Mortgage Rate Trends

Published

on

If you’re thinking about buying a home, chances are you’ve got mortgage rates on your mind. You’ve heard about how they impact how much you can afford in your monthly mortgage payment, and you want to make sure you’re factoring that in as you plan your move.

The problem is, with all the headlines in the news about rates lately, it can be a bit overwhelming to sort through. Here’s a quick rundown of what you really need to know.

The Latest on Mortgage Rates

Rates have been volatile – that means they’re bouncing around a bit. And, you may be wondering, why? The answer is complicated because rates are affected by so many factors.

Things like what’s happening in the broader economy and the job market, the current inflation rate, decisions made by the Federal Reserve, and a whole lot more have an impact. Lately, all of those factors have come into play, and it’s caused the volatility we’ve seen. As Odeta Kushi, Deputy Chief Economist at First American, explains:

“Ongoing inflation deceleration, a slowing economy and even geopolitical uncertainty can contribute to lower mortgage rates. On the other hand, data that signals upside risk to inflation may result in higher rates.”

Professionals Can Help Make Sense of it All

While you could drill down into each of those things to really understand how they impact mortgage rates, that would be a lot of work. And when you’re already busy planning a move, taking on that much reading and research may feel a little overwhelming. Instead of spending your time on that, lean on the pros.

They coach people through market conditions all the time. They’ll focus on giving you a quick summary of any broader trends up or down, what experts say lies ahead, and how all of that impacts you.

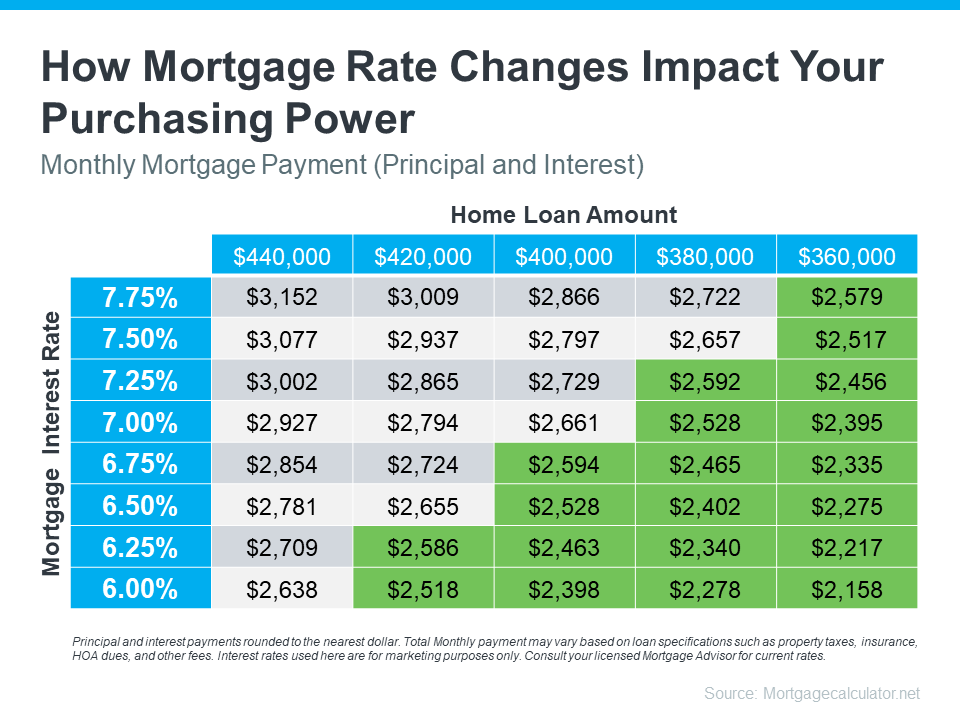
Take this chart as an example. It gives you an idea of how mortgage rates impact your monthly payment when you buy a home. Imagine being able to make a payment between $2,500 and $2,600 work for your budget (principal and interest only). The green part in the chart shows payments in that range or lower based on varying mortgage rates (see chart below):

No Caption Received

As you can see, even a small shift in rates can impact the loan amount you can afford if you want to stay within that target budget.

It’s tools and visuals like these that take everything that’s happening and show what it actually means for you. And only a pro has the knowledge and expertise needed to guide you through them.

You don’t need to be an expert on real estate or mortgage rates, you just need to have someone who is, by your side.

Bottom Line

Have questions about what’s going on in the housing market? Connect with a real estate professional to take what’s happening right now and figure out what it really means for you. 

Continue Reading
Click to comment

You must be logged in to post a comment Login

Leave a Reply

For Buyers

Why Home Prices Aren’t Actually Flat

Published

on

If you’ve been following real estate news lately, you’ve probably seen headlines saying home prices are flat. And at first glance, that sounds simple enough. But here’s the thing. The reality isn’t quite that straightforward.

In most places, prices aren’t flat at all.

What the Data Really Shows

While we’ve definitely seen prices moderate from the rapid and unsustainable climb in 2020-2022, how much they’ve changed is going to be different everywhere.

If you look at data from ResiClub and Zillow for the 50 largest metros, this becomes very clear. The real story is split right down the middle. Half of the metros are still seeing prices inch higher. The other half? Prices are coming down slightly (see graph below).

a graph of prices on a dark backgroundThe big takeaway here is “flat” doesn’t mean prices are holding steady everywhere. What the numbers actually show is how much price trends are going to vary depending on where you are.

One factor that’s driving the divide? Inventory. The Joint Center for Housing Studies (JCHS) of Harvard University explains:

“ . . . price trends are beginning to diverge in markets across the country. Prices are declining in a growing number of markets where inventories have soared while they continue to climb in markets where for-sale inventories remain tight.”

When you average those very different trends together, you get a number that looks like it’s flat. But it doesn’t give you the real story and it’s not what most markets are feeling today. You deserve more than that.

And just in case you’re really focusing on the declines, remember those are primarily places where prices rose too much, too fast just a few years ago. Prices went up roughly 50% nationally over the past 5 years, and even more than that in some of the markets that are experiencing a bigger correction today. So, a modest drop in some local pockets still puts most of those homeowners ahead when it comes to the overall value of their home. And based on the fundamentals of today’s housing market, experts are not projecting a national decline going forward.

So, what’s actually important for you to know?

If You’re Buying…

You need to know what’s happening in your area because that’s going to influence everything from how quickly you need to make an offer to how much negotiating power you’ll have once you do.

  • In a market where prices are still inching up, waiting around could mean paying more down the line.
  • In a market where they’re easing, you may be able to ask for things like repairs or closing cost help to sweeten the deal.

The bottom line? Knowing your local trend puts you in the driver’s seat. 

If You’re Selling…

You’ll want to be aware of local trends, so you’ll know how to price your house and how much you can expect to negotiate.

  • In a market where prices are still rising, you may not need to make many compromises to get your home sold.
  • But if you’re in a market where prices are coming down, setting the right price from the start and being willing to negotiate becomes much more important.

The big action item for homeowners? Sellers need to have an agent’s local perspective if they want to avoid making the wrong call on pricing – and homes that are priced right are definitely selling.

The Real Story Is Local

The national averages can point to broad trends, and that’s helpful context. But sometimes you’re going to need a local point of view because what’s happening in your zip code could look different. As Anthony Smith, Senior Economist at Realtor.com, article puts it:

“While national prices continued to climb, local market conditions have become increasingly fragmented…This regional divide is expected to continue influencing price dynamics and sales activity as the fall season gets underway.

That’s why the smartest move, whether you’re buying or selling, is to lean on a local agent who’s an expert on your market.

They’ll have the data and the experience to tell you whether prices in your area are holding steady, moving up, or softening a bit – and how that could impact your move.

Bottom Line

Headlines calling home prices flat may be grabbing attention, but they’re not giving you the full picture.

Has anyone taken the time to walk you through what’s happening in your market?

If you want the real story about what prices are doing in your area, connect with a local agent.

Continue Reading

Affordability

Why Experts Say Mortgage Rates Should Ease Over the Next Year

Published

on

You want mortgage rates to fall – and they’ve started to. But is it going to last? And how low will they go?

Experts say there’s room for rates to come down even more over the next year. And one of the leading indicators to watch is the 10-year treasury yield. Here’s why.

The Link Between Mortgage Rates and the 10-Year Treasury Yield

For over 50 years, the 30-year fixed mortgage rate has closely followed the movement of the 10-year treasury yield, which is a widely watched benchmark for long-term interest rates (see graph below):

a graph of a graph showing the rise of a mortgage rateWhen the treasury yield climbs, mortgage rates tend to follow. And when the yield falls, mortgage rates typically come down.

It’s been a predictable pattern for over 50 years. So predictable, that there’s a number experts consider normal for the gap between the two. It’s known as the spread, and it usually averages about 1.76 percentage points, or what you sometimes hear as 176 basis points.

The Spread Is Shrinking

Over the past couple of years, though, that spread has been much wider than normal. Why? Think of the spread as a measure of fear in the market. When there’s lingering uncertainty in the economy, the gap widens beyond its usual norm. That’s one of the reasons why mortgage rates have been unusually high over the past few years.

But here’s a sign for optimism. Even though there’s still some lingering uncertainty related to the economy, that spread is starting to shrink as the path forward is becoming clearer (see graph below):

a graph of a chartAnd that opens the door for mortgage rates to come down even more. As a recent article from Redfin explains:

“A lower mortgage spread equals lower mortgage rates. If the spread continues to decline, mortgage rates could fall more than they already have.”

The 10-Year Treasury Yield Is Expected To Decline

It’s not just the spread, though. The 10-year treasury yield itself is also forecast to come down in the months ahead. So, when you combine a lower yield with a narrowing spread, you have two key forces potentially pushing mortgage rates down going into next year.

This long-term relationship is a big reason why you see experts currently projecting mortgage rates will ease, with a fringe possibility they’ll hit the upper 5s toward the end of next year.

Here’s how it works. Take the 10-year treasury yield, which is sitting at about 4.09% at the time this article is being written, and then add the average spread of 1.76%. From there, you’d expect mortgage rates to be around 5.85% (see graph below):

a graph of a chartBut remember, all of that can change as the economy shifts. And know for certain that there will be ups and downs along the way. 

How these dynamics play out will depend on where the economy, the job market, inflation, and more go from here. But the 2026 outlook is currently expected to be a gradual mortgage rate decline. And as of now, things are starting to move in the right direction.

Bottom Line

Keeping up with all of these shifts can feel overwhelming. That’s why having an experienced agent or lender on your side matters. They’ll do the heavy lifting for you.

If you want real-time updates on mortgage rates, reach out to a trusted agent or lender who can keep you in the loop and help you plan your next move.

Continue Reading

Buying Tips

Why October Is the Best Time To Buy a Home in 2025

Published

on

If you’ve been watching from the sidelines, now’s the time to lean in. It’s officially the best time to buy this year. According to Realtor.com, this October will have the most buyer-friendly conditions of any month in 2025:

“By mid-October, buyers across much of the country may finally find the combination of inventory, pricing, and negotiating power they’ve been waiting for—a rare opportunity in a market that has been tight for most of the past decade.”

So, if you’re ready and able to buy right now, shooting for this month means you should see:

  • More homes to choose from
  • Less competition from other buyers
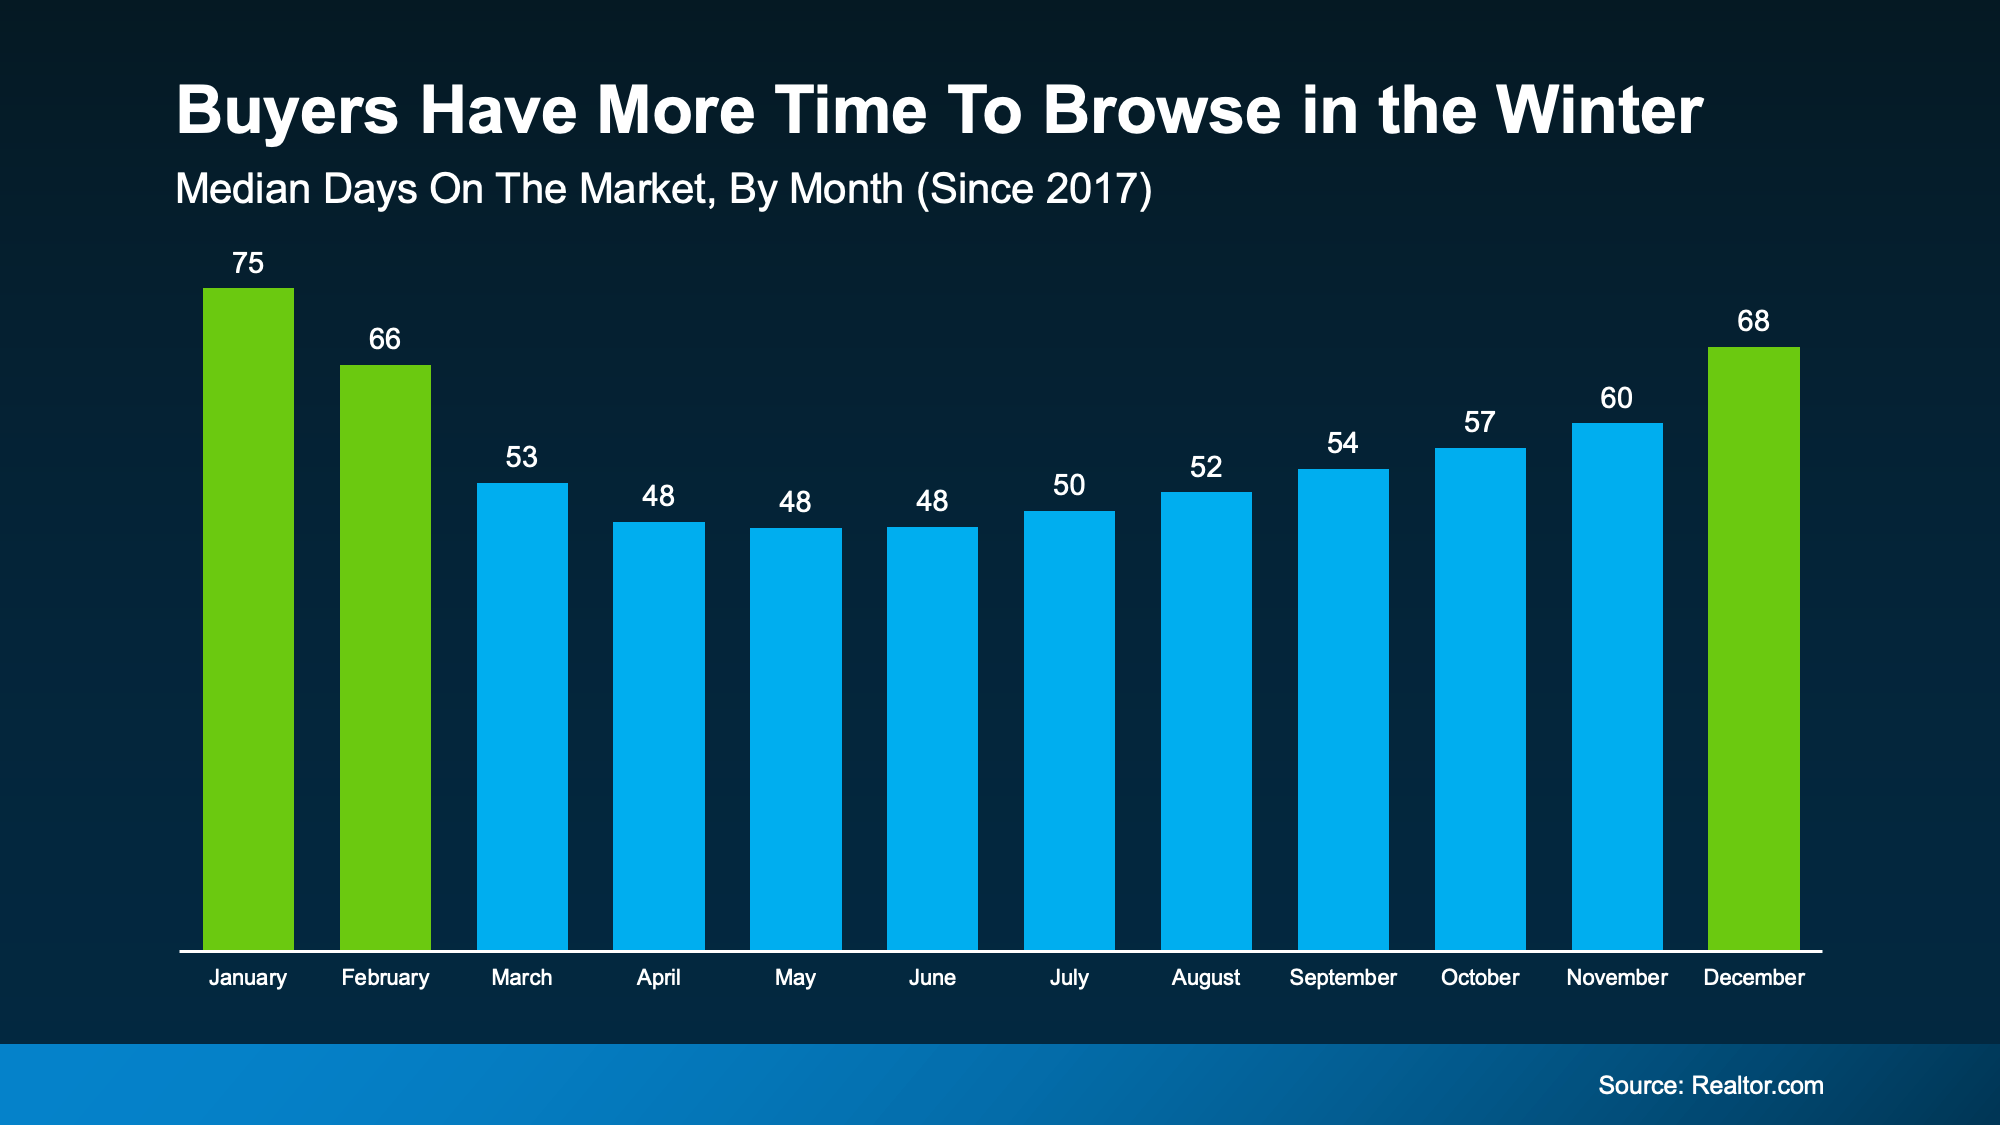
  • More time to browse
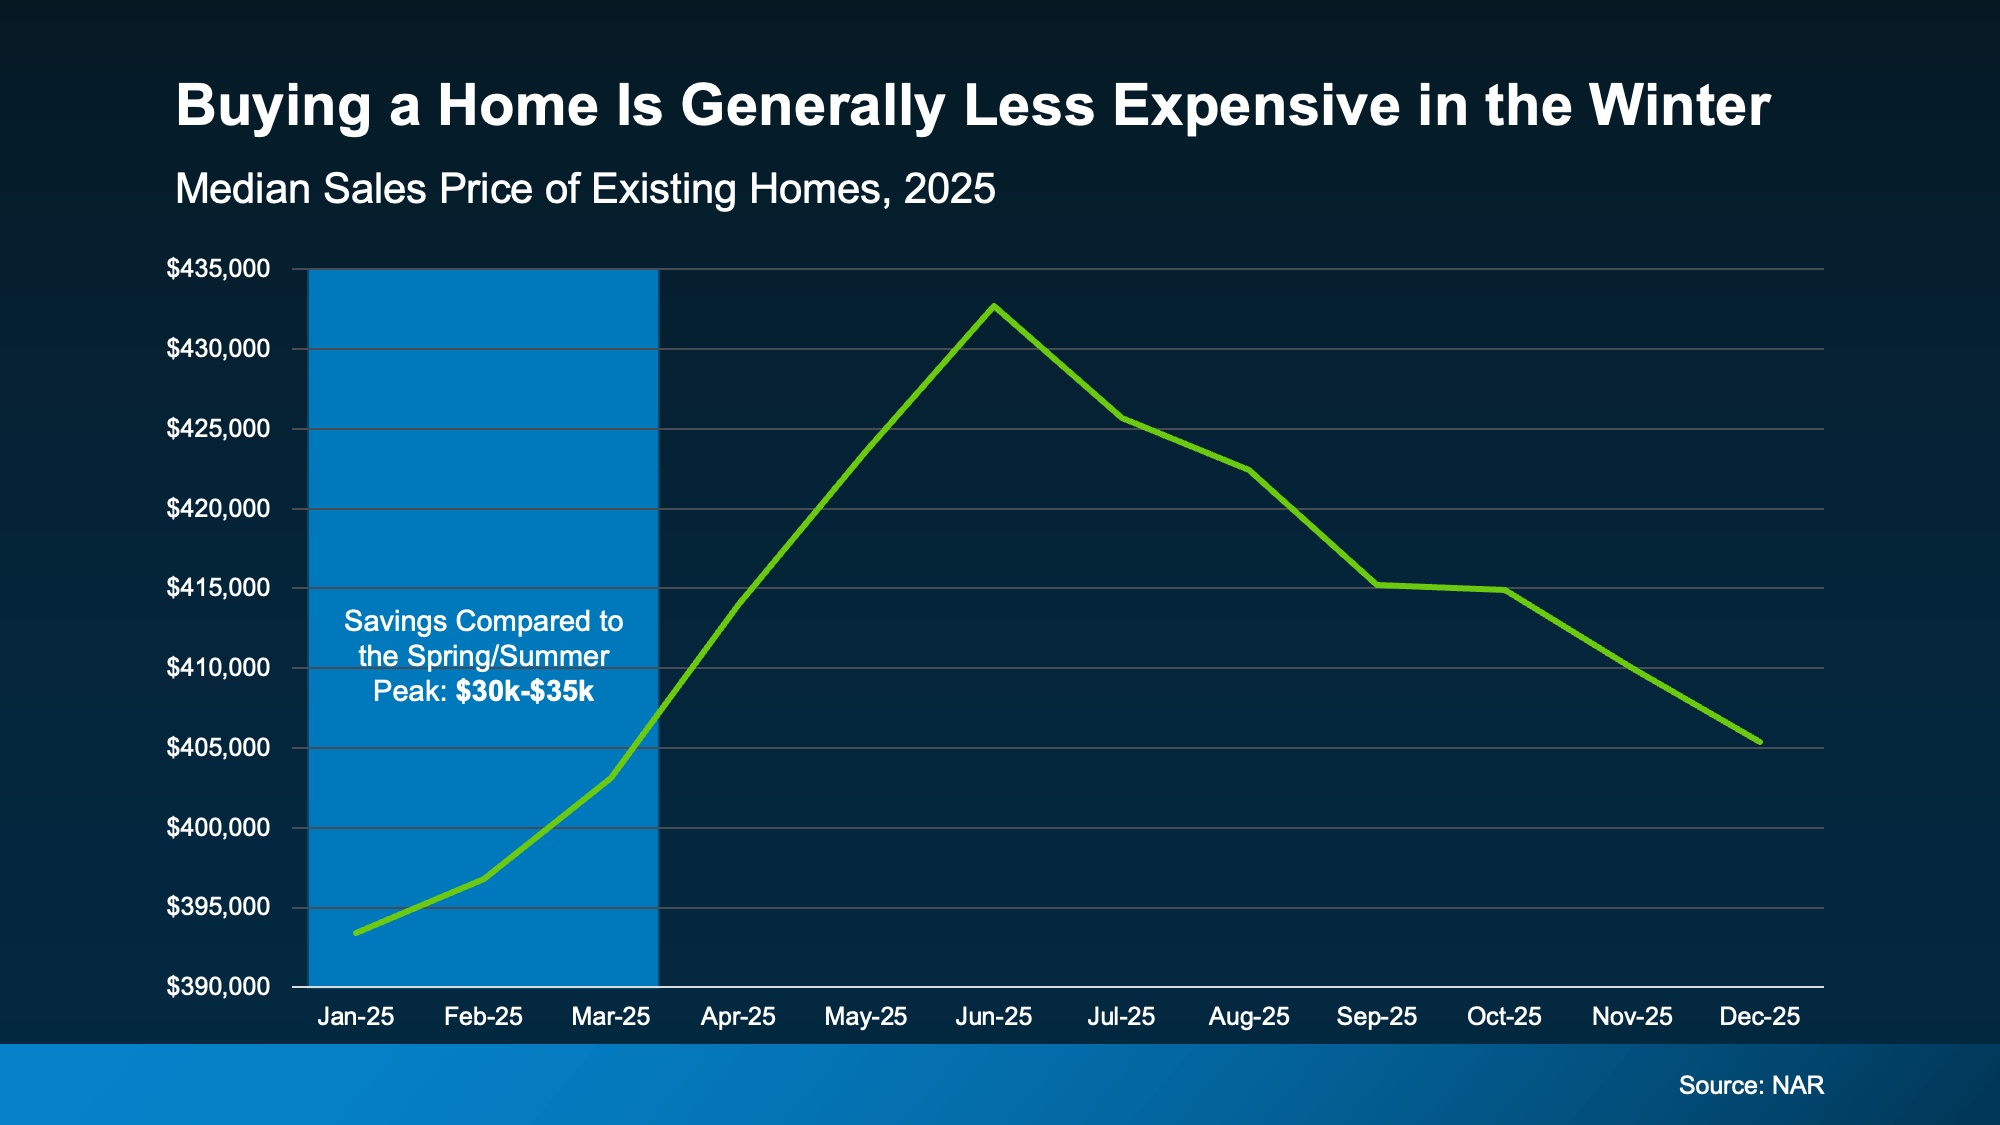
  • Better home prices
  • Sellers who are more willing to negotiate

Just remember, every market is different. For most of the top 50 largest metros, that sweet spot falls in October. But the peak time to buy may be slightly earlier or later, depending on where you live. As Realtor.com explains:

“While Oct. 12–18 is the national “Best Week,” timing can shift depending on the local markets. . .”

Best Week To Buy for the Top 50 Largest Metro Areas

  • Atlanta-Sandy Springs-Roswell, GA: September 28 – October 4
  • Austin-Round Rock-San Marcos, TX: September 28 – October 4
  • Baltimore-Columbia-Towson, MD: October 12 – 18
  • Birmingham, AL: October 19 – 25
  • Boston-Cambridge-Newton, MA-NH: October 26 – November 1
  • Buffalo-Cheektowaga, NY: October 12 – 18
  • Charlotte-Concord-Gastonia, NC-SC: November 2 – 8
  • Chicago-Naperville-Elgin, IL-IN: September 28 – October 4
  • Cincinnati, OH-KY-IN: October 12 – 18
  • Cleveland, OH: October 12 – 18
  • Columbus, OH: October 12 – 18
  • Dallas-Fort Worth-Arlington, TX: September 28 – October 4
  • Denver-Aurora-Centennial, CO: October 12 – 18
  • Detroit-Warren-Dearborn, MI: October 12 – 18
  • Grand Rapids-Wyoming-Kentwood, MI: September 28 – October 4
  • Hartford-West Hartford-East Hartford, CT: September 21 – 27
  • Houston-Pasadena-The Woodlands, TX: October 12 – 18
  • Indianapolis-Carmel-Greenwood, IN: October 26 – November 1
  • Jacksonville, FL: October 26 – November 1
  • Kansas City, MO-KS: October 12 – 18
  • Las Vegas-Henderson-North Las Vegas, NV: October 5 – 11
  • Los Angeles-Long Beach-Anaheim, CA: October 12 – 18
  • Louisville/Jefferson County, KY-IN: November 2 – 8
  • Memphis, TN-MS-AR: September 21 – 27
  • Miami-Fort Lauderdale-West Palm Beach, FL: November 30 – December 6
  • Milwaukee-Waukesha, WI: September 7 – 13
  • Minneapolis-St. Paul-Bloomington, MN-WI: October 26 – November 1
  • Nashville-Davidson–Murfreesboro–Franklin, TN: October 12 – 18
  • New York-Newark-Jersey City, NY-NJ: September 14 – 20
  • Oklahoma City, OK: October 12 – 18
  • Orlando-Kissimmee-Sanford, FL: October 26 – November 1
  • Philadelphia-Camden-Wilmington, PA-NJ-DE-MD: September 7 – 13
  • Phoenix-Mesa-Chandler, AZ: November 2 – 8
  • Pittsburgh, PA: October 12 – 18
  • Portland-Vancouver-Hillsboro, OR-WA: October 26 – November 1
  • Providence-Warwick, RI-MA: October 19 – 25
  • Raleigh-Cary, NC: October 12 – 18
  • Richmond, VA: October 26 – November 1
  • Riverside-San Bernardino-Ontario, CA: September 28 – October 4
  • Sacramento-Roseville-Folsom, CA: October 12 – 18
  • San Antonio-New Braunfels, TX: October 12 – 18
  • San Diego-Chula Vista-Carlsbad, CA: October 12 – 18
  • San Francisco-Oakland-Fremont, CA: October 12 – 18
  • San Jose-Sunnyvale-Santa Clara, CA: October 19 – 25
  • Seattle-Tacoma-Bellevue, WA: October 19 – 25
  • St. Louis, MO-IL: October 12 – 18
  • Tampa-St. Petersburg-Clearwater, FL: November 30 – December 6
  • Tucson, AZ: October 12 – 18
  • Virginia Beach-Chesapeake-Norfolk, VA-NC: September 21 – 27
  • Washington-Arlington-Alexandria, DC-VA-MD-WV: October 12 – 18

What the Experts Are Saying

And Realtor.com isn’t the only one saying you’ve got an opportunity if you move now. Lawrence Yun, Chief Economist at the National Association of Realtors (NAR), explains:

Homebuyers are in the best position in more than five years to find the right home and negotiate for a better price. Current inventory is at its highest since May 2020, during the COVID lockdown.”

Daryl Fairweather, Chief Economist at Redfin, puts it like this:

Nationally, now is a good time to buy, if you can afford it . . . with falling mortgage rates and significantly more inventory, buyers have an upper hand in negotiations.”

And NerdWallet says:

“This fall just might be the best window for home buyers in the past five years.”

How To Get Ready for this Golden Window

To make sure you’re ready to jump in whenever your market’s best time to buy arrives, talk to a local agent now. They’ll be able to give you more information on your market’s peak time, why it’s good for you, and the steps you’ll need to take to get ready.

Bottom Line

If you’re serious about buying, getting prepped for this October window is a smart play.

Want help lining up your strategy? Have a quick conversation with a local agent so you’ve got the information you need to be ready for this prime buying time.

Continue Reading

Subscribe for Weekly

Real Estate Insights

Advertisement

Trending

Copyright © 2020-2025 Mark Sincavage. All rights reserved.  
The information contained, and the opinions expressed, in these article are not intended to be construed as investment advice. Let's Talk Real Estate, Mark Sincavage, and Keeping Current Matters, Inc. do not guarantee or warrant the accuracy or completeness of the information or opinions contained herein. Nothing herein should be construed as investment advice. You should always conduct your own research and due diligence and obtain professional advice before making any investment decision. Let's Talk Real Estate, Mark Sincavage and Keeping Current Matters, Inc. will not be liable for any loss or damage caused by your reliance on the information or opinions contained herein.