

For Buyers
Are We Heading into a Balanced Market?
If you’ve been keeping an eye on the housing market over the past couple of years, you know sellers have had the upper hand. But is that going to shift now that inventory is growing? Here’s a breakdown of what you need to know.
What Is a Balanced Market?
A balanced market is generally defined as a market with about a five-to-seven-month supply of homes available for sale. In this type of market, neither buyers nor sellers have a clear advantage. Prices tend to stabilize, and there’s a healthier number of homes to choose from. And after many years when sellers had all the leverage, a more balanced market would be a welcome sight for people looking to move. The question is – is that really where the market is headed?
After starting the year with a three-month supply of homes nationally, inventory has increased to four months. That may not sound like a lot, but it means the market is getting closer to balanced – even though it’s not quite there yet. It’s important to note this increase in inventory is not leading to an oversupply that would cause a crash. Even with the growth lately, there’s still nowhere near enough supply for that to happen.
The graph below uses data from the National Association of Realtors (NAR) to give you an idea of where inventory has been in the past, and where it’s at today:
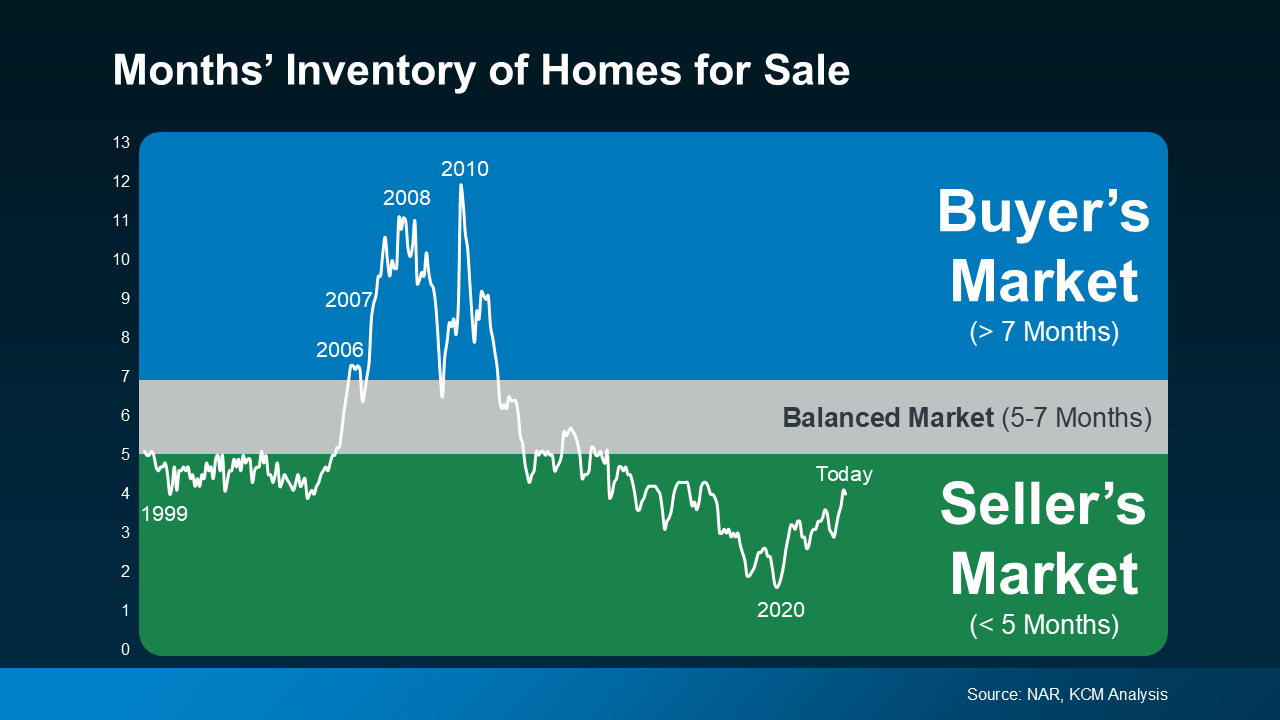 For now, this is still seller’s market territory – it’s just not as frenzied of a seller’s market as it’s been over the past few years. As Mark Fleming, Chief Economist at First American, says:
“The faster housing supply increases, the more affordability improves and the strength of a seller’s market wanes.”
What This Means for You and Your Move
Here’s how this shift impacts you and the market conditions you’ll face when you move. Lawrence Yun, Chief Economist at NAR, explains:
“Homes are sitting on the market a bit longer, and sellers are receiving fewer offers. More buyers are insisting on home inspections and appraisals, and inventory is definitively rising on a national basis.”
The graphs below use the latest data from NAR and Realtor.com to help show examples of these changes:
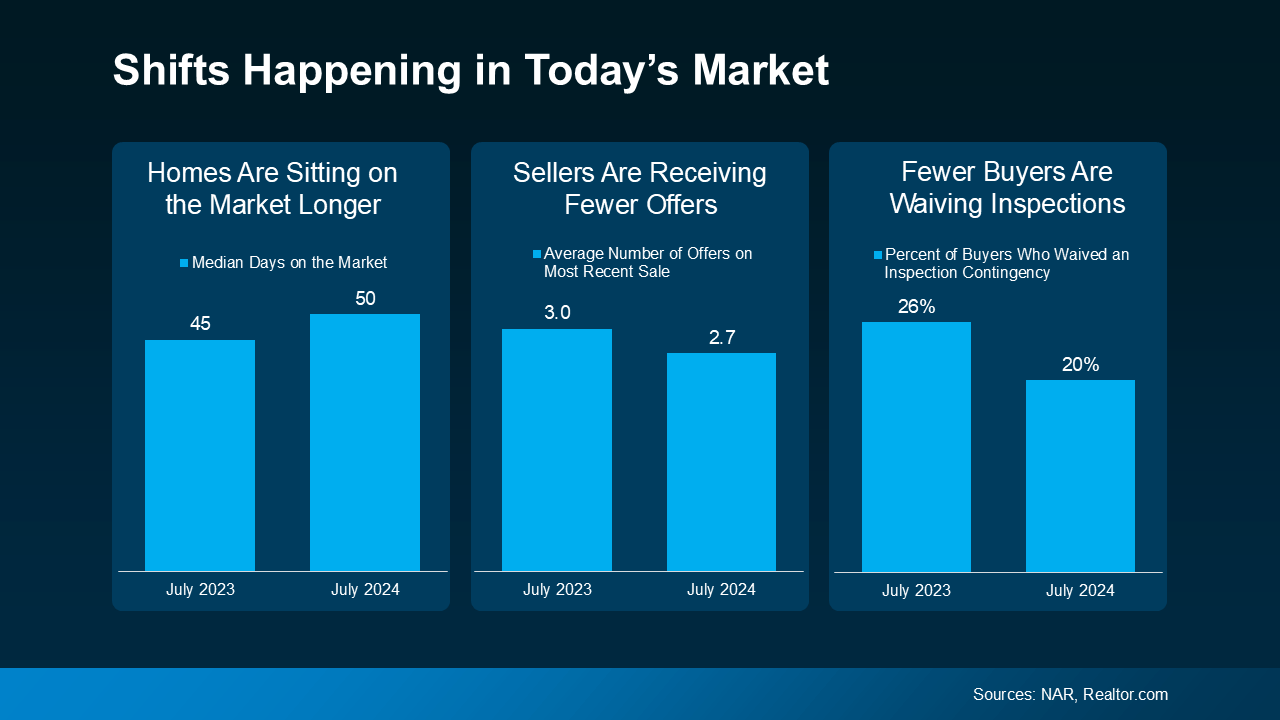 Homes Are Sitting on the Market Longer: Since more homes are on the market, they’re not selling quite as fast. For buyers, this means you may have more time to find the right home. For sellers, it’s important to price your house right if you want it to sell. If you don’t, buyers might choose better-priced options.
Sellers Are Receiving Fewer Offers: As a seller, you might need to be more flexible and willing to compromise on price or terms to close the deal. For buyers, you could start to face less intense competition since you have more options to choose from.
Fewer Buyers Are Waiving Inspections: As a buyer, you have more negotiation power now. And that’s why fewer buyers are waiving inspections. For sellers, this means you need to be ready to negotiate and address repair requests to keep the sale moving forward.
How a Real Estate Agent Can Help
But this is just the national picture. The type of market you’re in is going to vary a lot based on how much inventory is available. So, lean on a local real estate agent for insight into how your area stacks up.
Whether you’re buying or selling, understanding how the market is changing gives you a big advantage. Your agent has the latest data and local insights, so you know exactly what’s happening and how to navigate it.
Bottom Line
The real estate market is always changing, and it’s important to stay informed. Whether you’re buying or selling, understanding this shift toward a balanced market can help. If you have any questions or need expert advice, don’t hesitate to reach out to a local real estate agent.

If you’ve been looking for a home lately, you’ve probably felt how tough affordability still is. And that’s exactly why more buyers are opting for adjustable-rate mortgages, or ARMs.
Here’s what you need to understand about how they work, and whether they make sense for you.
What Is an Adjustable-Rate Mortgage?
Since a lot of people aren’t familiar with this type of loan, let’s start with a definition. This is how Business Insider explains the main difference between a fixed-rate mortgage and an adjustable-rate mortgage:
“With a fixed-rate mortgage, your interest rate remains the same for the entire time you have the loan. This keeps your monthly payment the same for years . . . adjustable-rate mortgages work differently. You’ll start off with the same rate for a few years, but after that, your rate can change periodically. This means that if average rates have gone up, your mortgage payment will increase. If they’ve gone down, your payment will decrease.”
Basically, one doesn’t change much over the life of your loan.
And one could change… either by a little, or a lot.
Of course, things like taxes or homeowner’s insurance can still have an impact on a fixed-rate loan, but the baseline of your mortgage payment is fairly steady. But the big difference is that with an ARM, your monthly payment could change over time.
Why Adjustable-Rate Mortgages Are Getting More Attention
So, why do some buyers choose this option? It’s simple. It’s because of the upfront savings. Business Insider explains it like this:
“Because ARM rates are typically lower than fixed mortgage rates, they can help buyers find affordability when rates are high. With a lower ARM rate, you can get a smaller monthly payment or afford more house than you could with a fixed-rate loan.”
And right now, according to Mortgage News Daily and the Wall Street Journal, the upfront rate on an ARM is lower than a 30-year fixed mortgage (see graph below):
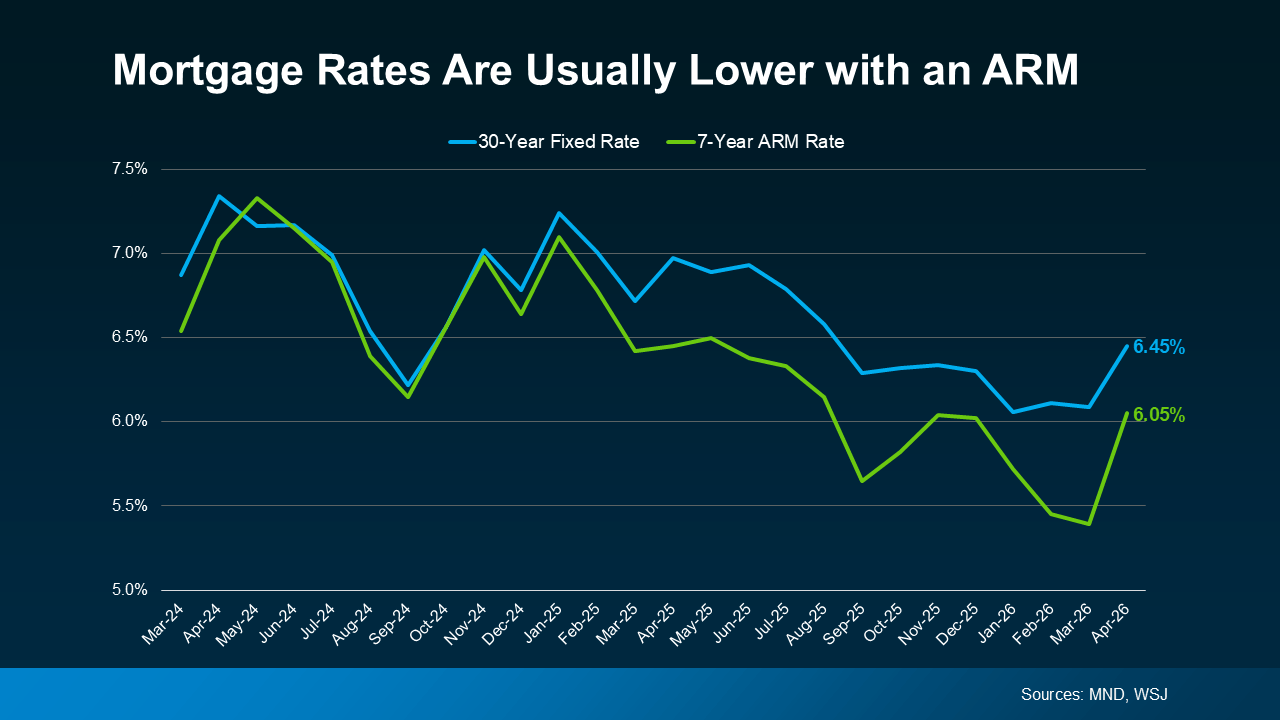 If you’re wondering how that shakes out in real dollars and cents, here’s what Redfin says. According to their research, the typical buyer could save about $150 per month by taking out an ARM instead of a 30-year fixed mortgage.
For some people, that’s enough to make a difference.
More Buyers Are Choosing Adjustable-Rate Mortgages Today
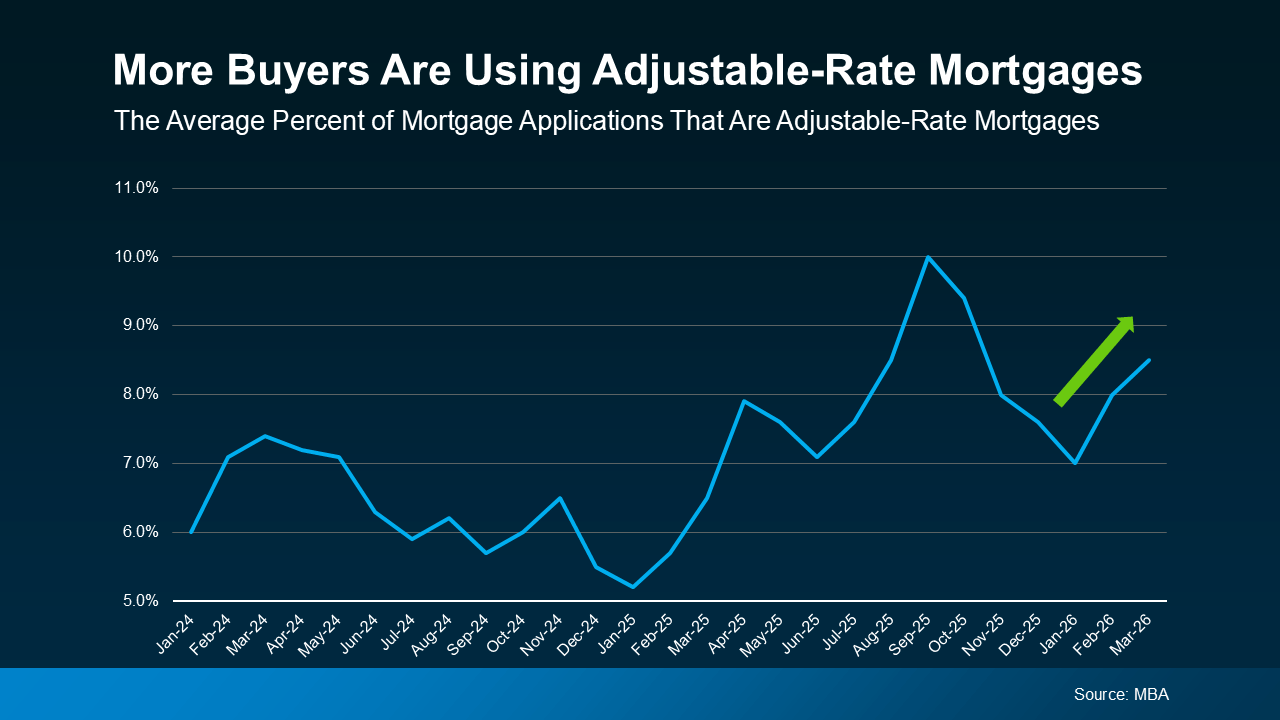
A growing number of buyers are willing to trade the uncertainty later for a lower payment now. Data from the Mortgage Bankers Association (MBA) shows the share of buyers choosing ARMs has increased, especially over the last few years (see graph below).
This doesn’t mean ARMs are becoming the go-to option for everyone. It only means some buyers are opting for this type of mortgage, so they can still buy today.
 And if you remember the housing crash, seeing ARMs gain popularity again may raise concerns. But rest easy. Today’s ARMs aren’t the same.
Back then, some buyers were given loans they couldn’t afford once rates adjusted.
Today, lending standards are stricter, and lenders evaluate whether borrowers could still handle the payment if rates rise. So, the return of ARMs doesn’t signal another widespread crash. It just reflects how some buyers are adapting to today’s affordability challenges.
The Trade-Off – What You Need To Consider
If you’re considering an adjustable-rate mortgage yourself, just remember it really all depends on your situation and your risk tolerance.
An ARM may make sense if you plan to move before your rate would adjust or if you expect you’ll make a higher income in the future. But there are trade-offs you need to think through.
For example, once the fixed period ends, your rate can adjust, and your payment could increase, potentially by a meaningful amount depending on where rates are at that time.
And keep in mind, there’s also no guarantee mortgage rates will come down in the future, which means refinancing later isn’t always an option. That’s why it’s important to think through your plan, understand your long-term earning potential, and work closely with a trusted lender before you choose an ARM.
Bottom Line
ARMs are getting more attention again because they can make buying a home more affordable in the short term. But they’re not right for everyone.
The key is understanding how they work, what the risks are, and whether they fit your plan. And that’s why you need to talk to a trusted lender and financial advisor before you make any decisions.


Spend about 5 minutes online searching for news about the housing market, and odds are you’ll see something pop up about home prices. You may even stumble onto social media influencers saying we’re headed for a crash. Let’s get you the context you need.
The truth is prices are going to vary depending on where you live. But they’re not crashing.
Here’s what you need to know.
The Local Perspective: Home Price Trends by Area
The biggest thing feeding into the confusion online is how different home price trends are by area right now. Take a look at this data from ResiClub and Zillow (see graph below).
About half of the largest metros are seeing prices go up.
The other half are seeing some declines.
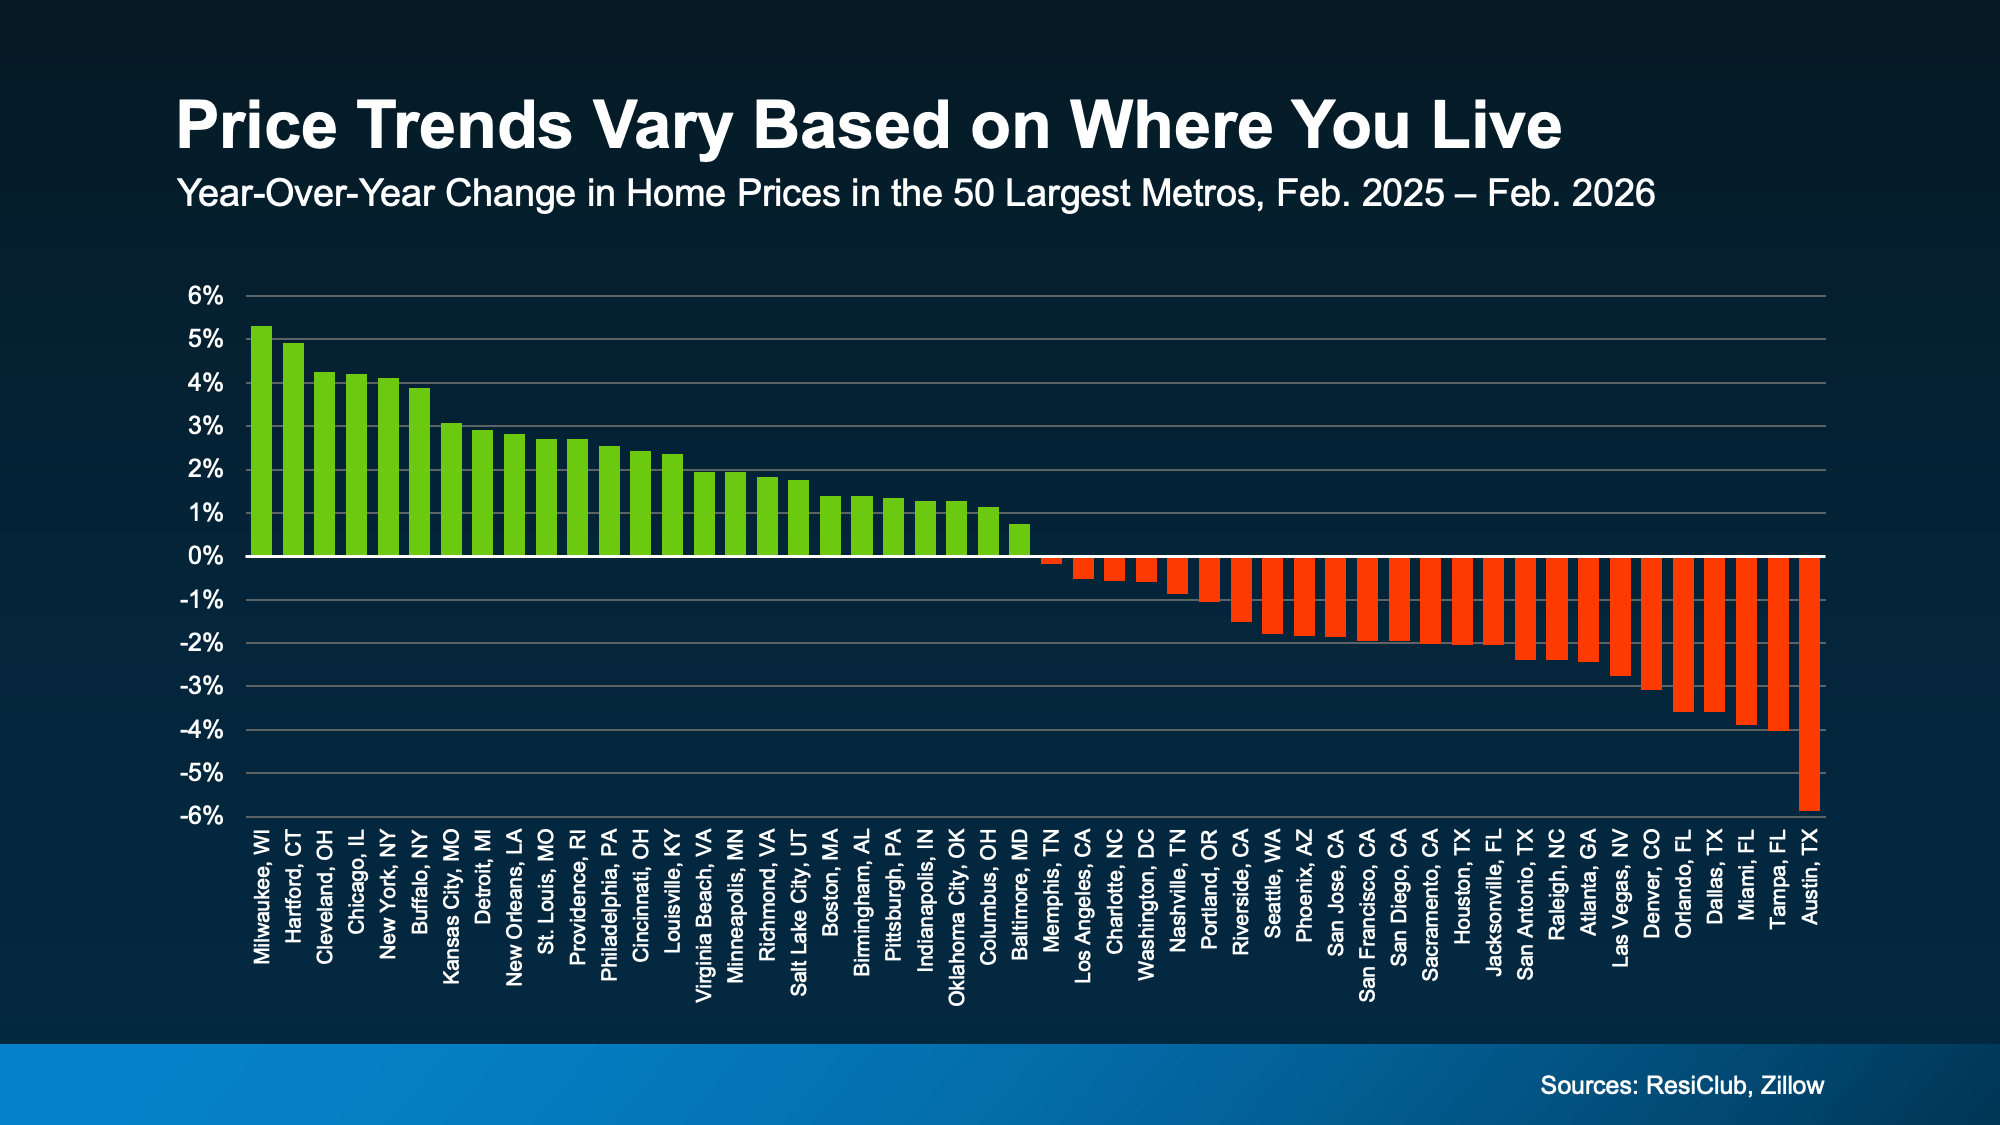 Unfortunately, the online chatter only focuses on the markets where prices are down – and that makes it sound like something bigger is happening.
But, as you can see in this graph, that’s only one side of the story. The full picture is different.
The National Perspective: Moderate Price Growth
As a country, when you average it all together to get a true baseline, one thing becomes clear, home prices are still net positive at the national level.
According to the Redfin, national home prices were up about 1% year-over-year in February. So, what we’re seeing right now isn’t a collapse. It’s a market that’s normalizing after a period of unusually fast growth. And that impacts some local markets more than others – particularly those where prices rose too far, too fast during the pandemic.
A true crash, like what happened in 2008, would mean prices dropping sharply across the entire country. That’s just not what the data shows today. And it’s not where things are going either.
Experts Agree This Isn’t 2008
In fact, Fannie Mae surveyed over 100 housing market experts to ask their opinions on where prices are headed from here. And the experts agree, nationally, prices are expected to keep rising over the next five years:
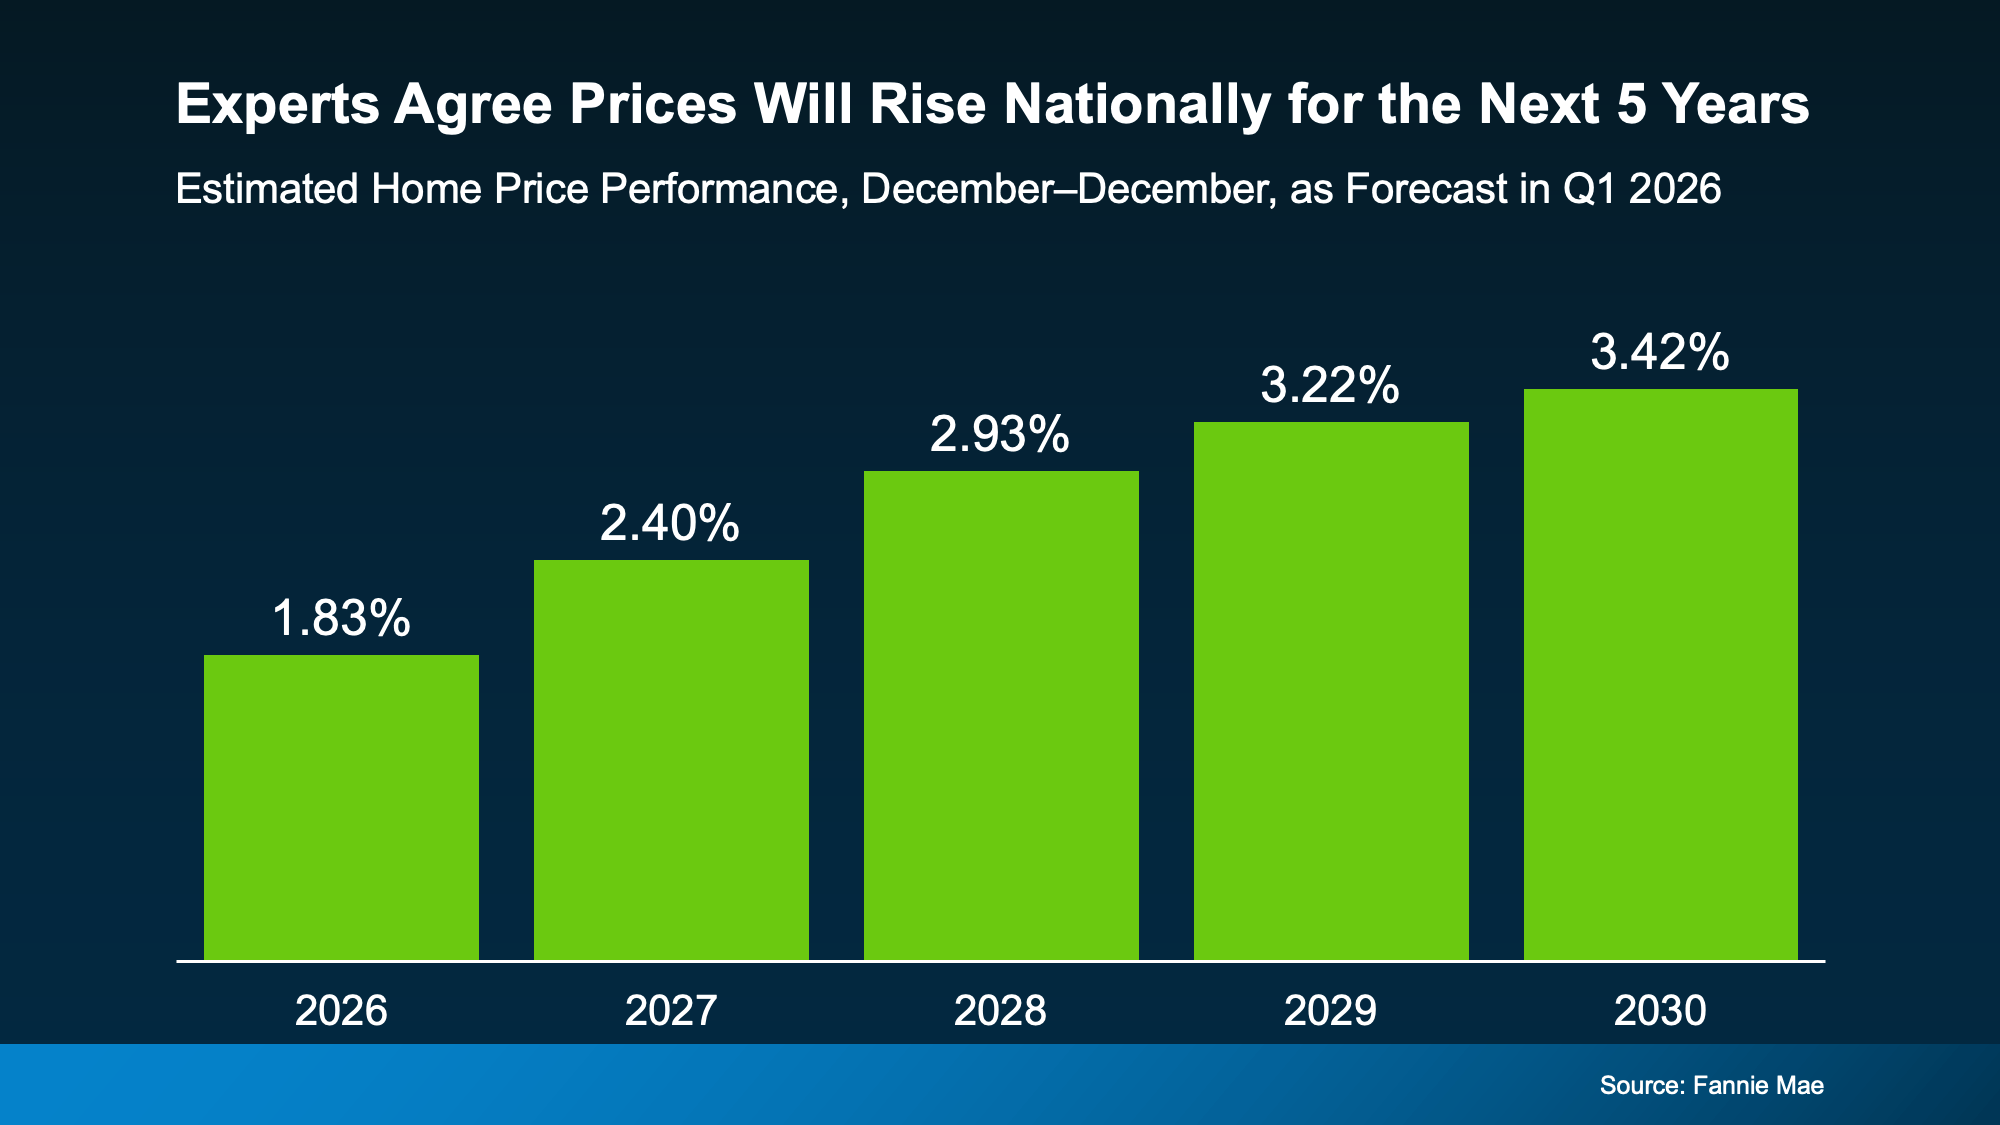 That rise will be moderate, particularly this year, but the trend is clear. Nationally, prices are forecast to grow every year now through at least 2030 – and that’s normal. Daryl Fairweather, Chief Economist, at Redfin explains:
“House prices aren’t going to fall on a national scale any time soon—and that’s actually a good thing. It’s normal for house prices to rise gradually over time . . .”
That’s why even in the select areas where prices have dropped slightly this year, the decline is expected to be temporary. According to that same quarterly Fannie Mae survey mentioned above, 85% of the experts say the markets that are seeing mild declines right now will return to positive price growth before the end of 2027.
The main takeaway? This isn’t a crash. And prices aren’t expected to fall nationally. If anything, the few areas experiencing declines are expected to rebound in the next year or so.
Bottom Line
It’s easy to get caught up in headlines that make it sound like something big is about to happen. But don’t be fooled. The housing market isn’t crashing. It’s just shifting.
The key is understanding what’s actually happening in your market, so you can make the right move for you. Connect with a real estate agent if you want the local perspective.

Thinking About an Adjustable-Rate Mortgage? Here’s What You Need To Know.

Your House Hasn’t Sold Yet. Should You Rent It Out Instead?

Before You Fall in Love with a House, Do This First.


-

 Agent Value4 weeks ago
If Your House Isn’t Getting Offers, Read This.
-

 For Buyers4 weeks ago
One Key Sign We’re Not Headed for a Wave of Foreclosures
-

 Agent Value3 weeks ago
The #1 Reason Buyers Walk Away (And How To Get Ahead of It)
-

 For Buyers1 week ago
Don’t Let Home Prices Headlines Fool You
-

 Affordability3 weeks ago
Affordability Has Improved in All 50 States
-

 Agent Value3 weeks ago
3 Must-Do’s for First-Time Home Buyers
-

 Buying Tips2 weeks ago
You Can’t Control What’s Happening with Mortgage Rates. But You Can Control This.
-

 Equity2 weeks ago
The Remodel You’ve Been Dreaming About May Be Closer Than You Think
You must be logged in to post a comment Login