For Buyers
Home Values Rise Even as Median Prices Fall
Recent headlines have been buzzing about the median asking price of homes dropping compared to last year, and that’s sparked plenty of confusion. And as a buyer or seller, it’s easy to assume that means prices are coming down. But here’s the catch: those numbers don’t tell the full story.
Nationally, home values are actually rising, even if the median price is down a bit. Let’s break down what’s really happening so you can make sense of the market without getting caught up in the fear the headlines create.
Homes on the Market Right Now Are Smaller
The biggest reason for the dip in median price is the size of homes being sold. The median price reflects the middle point of all the homes for sale at any given time. And that’ll be affected by the mix of homes on the market.
To show you how this works, here’s a simple explanation of a median (see visual below). Let’s say you have three coins in your pocket, and you decide to line them up according to their value from low to high. If you have one nickel and two dimes, the median (the middle one) is 10 cents. If you have two nickels and one dime, the median is now five cents.
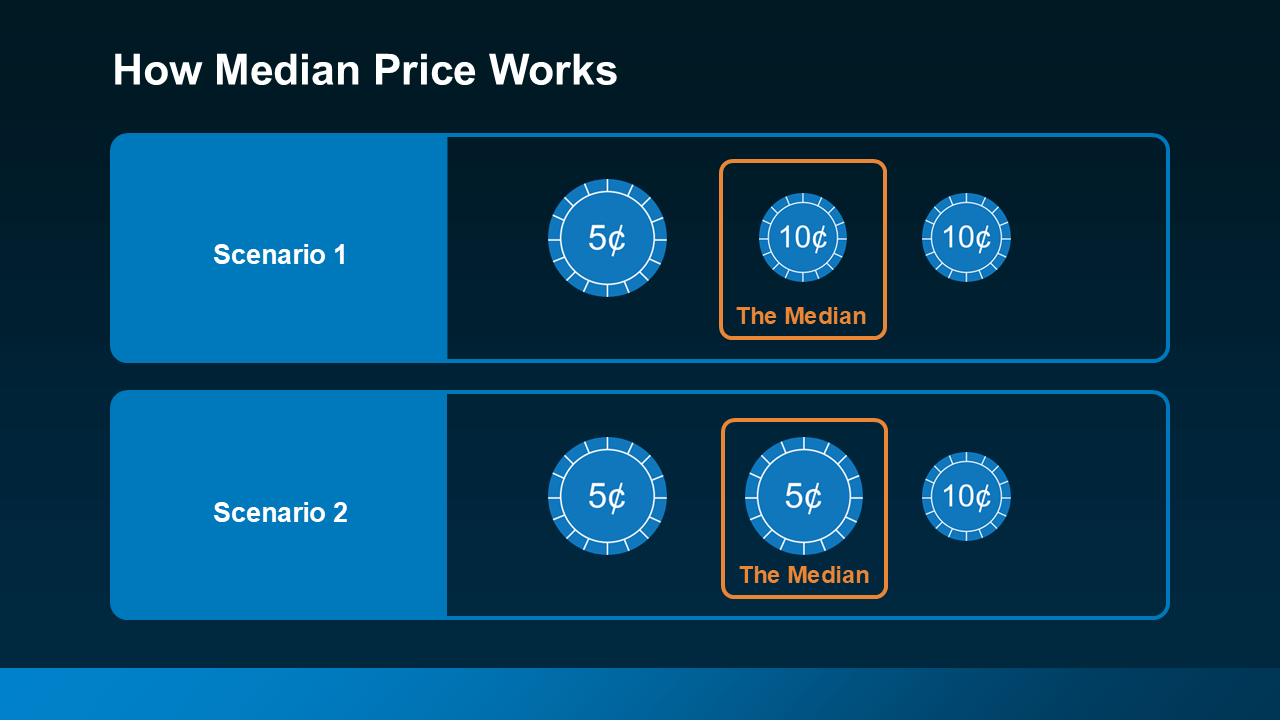 In both cases, a nickel is still worth five cents and a dime is still worth 10 cents. The value of each coin didn’t change. The same is true for housing.
Right now, there’s a greater number of smaller, less expensive homes on the market, and that’s bringing the overall median price down. But that doesn’t mean home values are declining.
As Danielle Hale, Chief Economist at Realtor.com, explains:
“The share of inventory of smaller and more affordable homes has grown, which helps hold down the median price even as per-square-foot prices grow further.”
And here’s the data to prove it.
Price Per Square Foot Is Still Rising
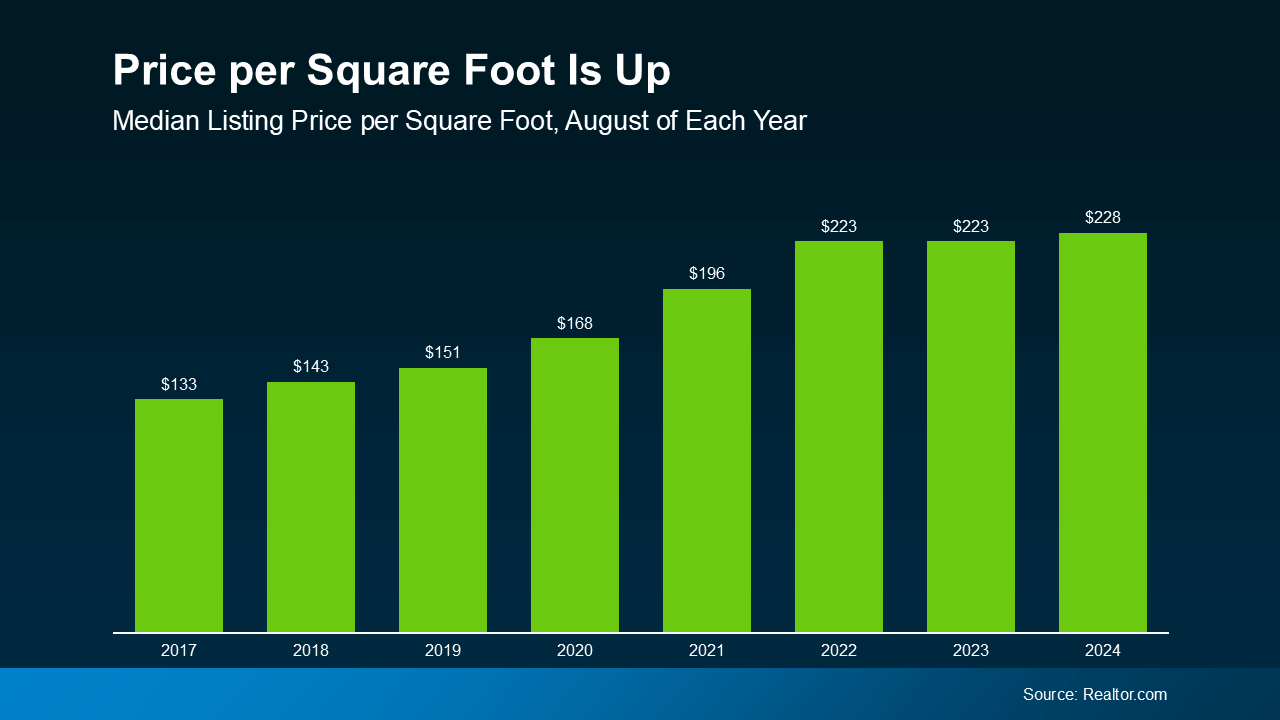
One of the best ways to measure home values is by looking at the price per square foot. That’s because it shows how much you’re paying for the space inside the home.
The median asking price doesn’t take into account the size of different homes, so it may not always reflect the true value. And the latest national price per square foot data shows home values are still increasing, even though the median asking price has dropped (see graph below).
 As Ralph McLaughlin, Senior Economist at Realtor.com, explains:
“When a change in the mix of inventory toward smaller homes is accounted for, the typical home listed this year has increased in asking price compared with last year.”
This means that while smaller homes are affecting the median price, the average home’s value is still rising. According to the Federal Housing Finance Agency (FHFA):
“Nationally, the U.S. housing market has experienced positive annual appreciation each quarter since the start of 2012.”
So, while headlines may make it sound like prices are crashing, you don’t have to worry. With a closer look and more reliable data, you can see that prices are still climbing nationally.
But it’s important to remember that home prices can vary by region. While national trends provide a big-picture view, local markets may be experiencing different conditions. A trusted agent is the best resource to explain what’s happening in your area.
Bottom Line
The decrease in median price is not the same as a decrease in home values. The median asking price is down mostly due to the mix of smaller, less expensive homes on the market.
The important thing to focus on is the price per square foot, which is a better indicator of overall market value—and those prices are still going up. If you have questions about what home prices are doing in your area, reach out to a local real estate agent who can provide insights on your specific market.
Quick gut reaction. Which investment do Americans trust more than stocks, gold, savings accounts, and bonds? The answer hasn’t changed in 14 years.
It’s real estate. And this year, that answer comes with even more conviction behind it. New data shows people aren’t just saying homeownership is a smart move, they’re feeling better about it than they have in years. Let’s dig into why.
Real Estate Takes the Top Spot – Again
Every year, Gallup asks Americans to name the best long-term investment. And for the 14th year in a row, real estate came out on top (see graph below):
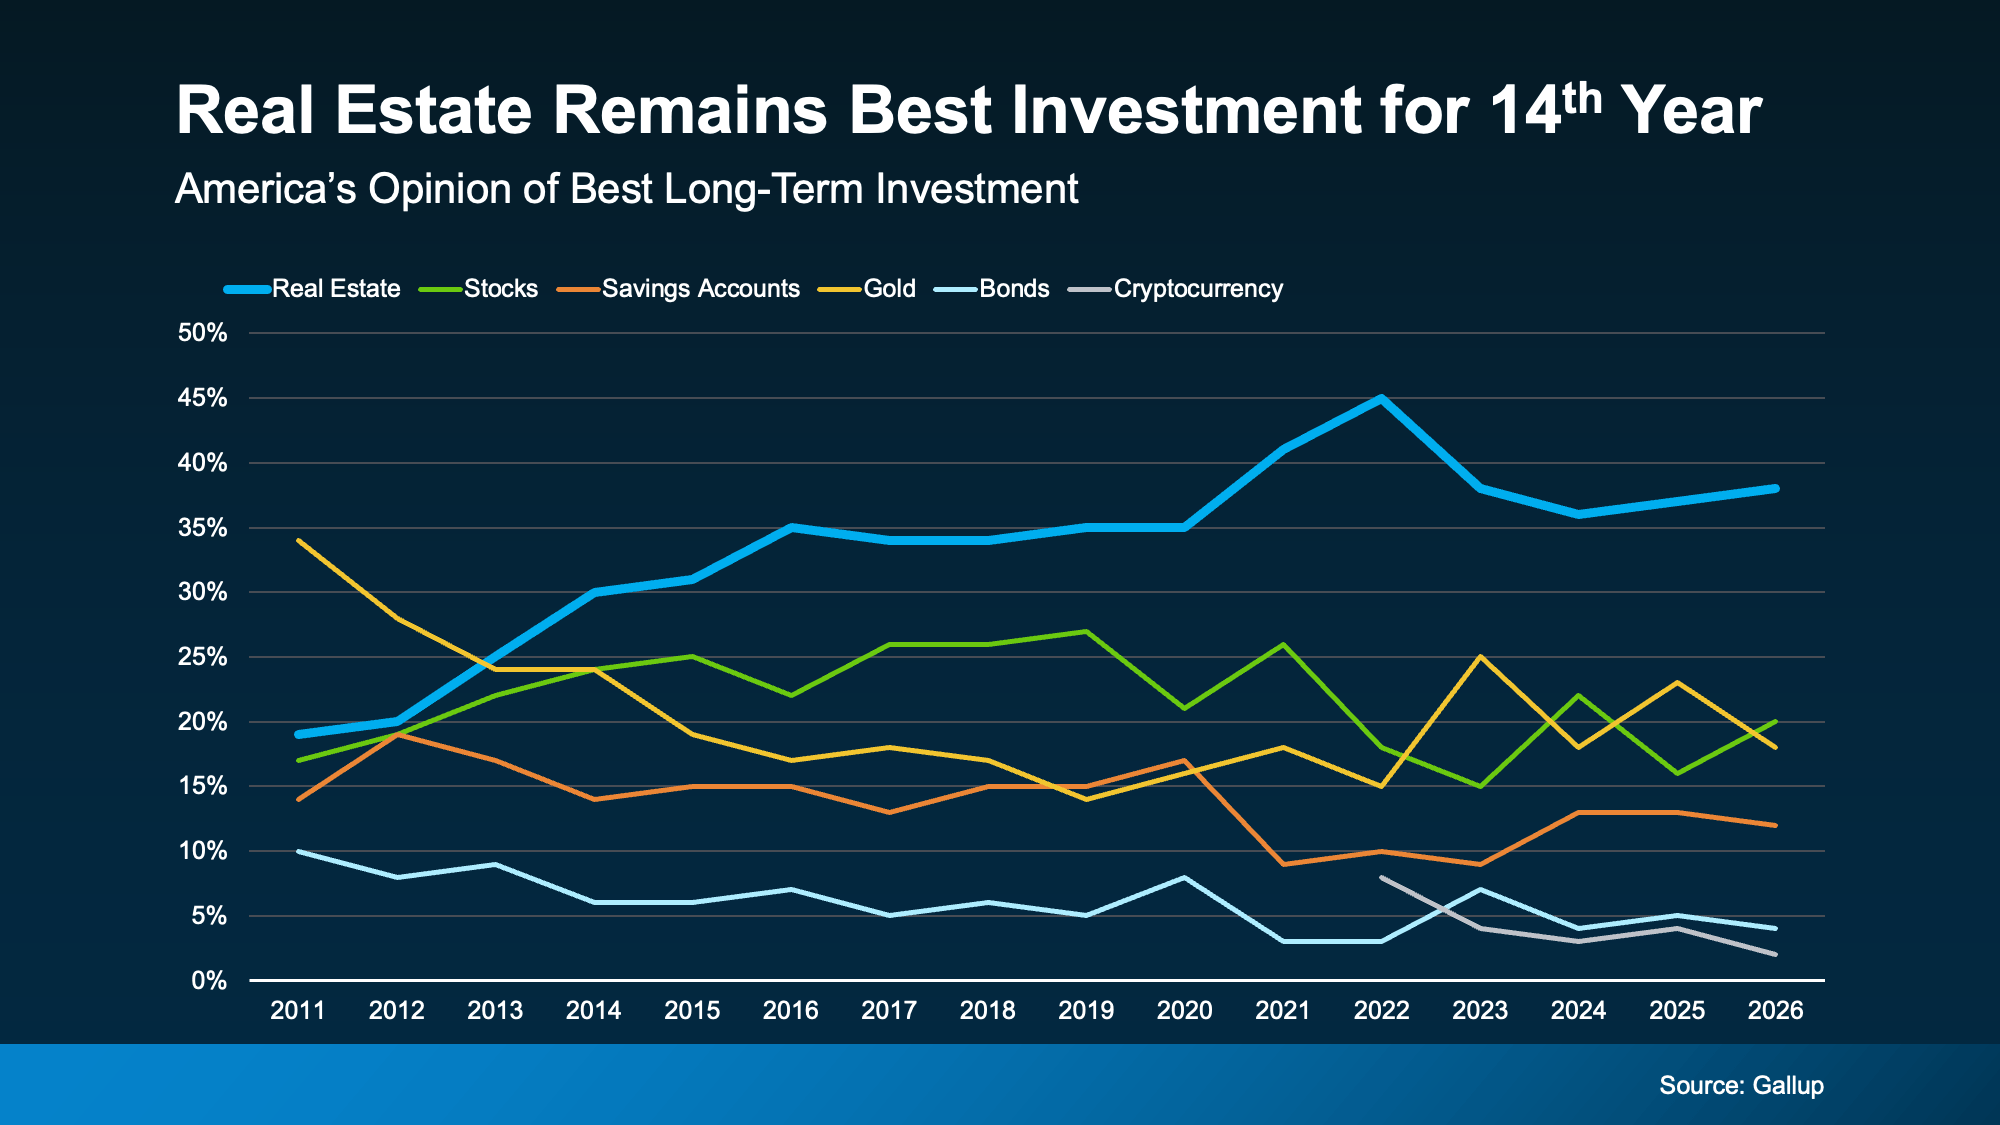
That’s not a fluke or a hot streak. That’s 14 straight years of beating out stocks, gold, and everything else.
Think about everything that’s happened in that stretch – rising rates, market swings, election years, you name it. Through all of it, Americans kept picking real estate. That kind of staying power says something about how people view homeownership – and it makes sense. Historically, it’s one of the best ways to build wealth in this country.
As Michelle Egan, Head of Credit Solutions, Impact Finance at JPMorgan Chase, explains:
“Owning a home has long been considered one of the most reliable ways to build wealth. Beyond providing shelter, a home is a valuable asset that can appreciate over time, build equity, and serve as a financial resource for generations.”
Now, you may have seen chatter online saying home prices are falling and wondered if that changes the math. It really shouldn’t. Nationally, home prices are still rising – just at a slower pace than a few years ago.
Yes, some local markets are seeing slight dips, but those dips are small compared to how much home values have grown over the past 5 years. Generally speaking, home prices almost always rise. As long as you plan to live there for a good length of time, you should still have the chance to build equity.
More People Say Buying Beats Renting
And while it’s true homeownership has been seen as a worthwhile pursuit for years now, something interesting is happening. It may actually be gaining a bit more popularity again.
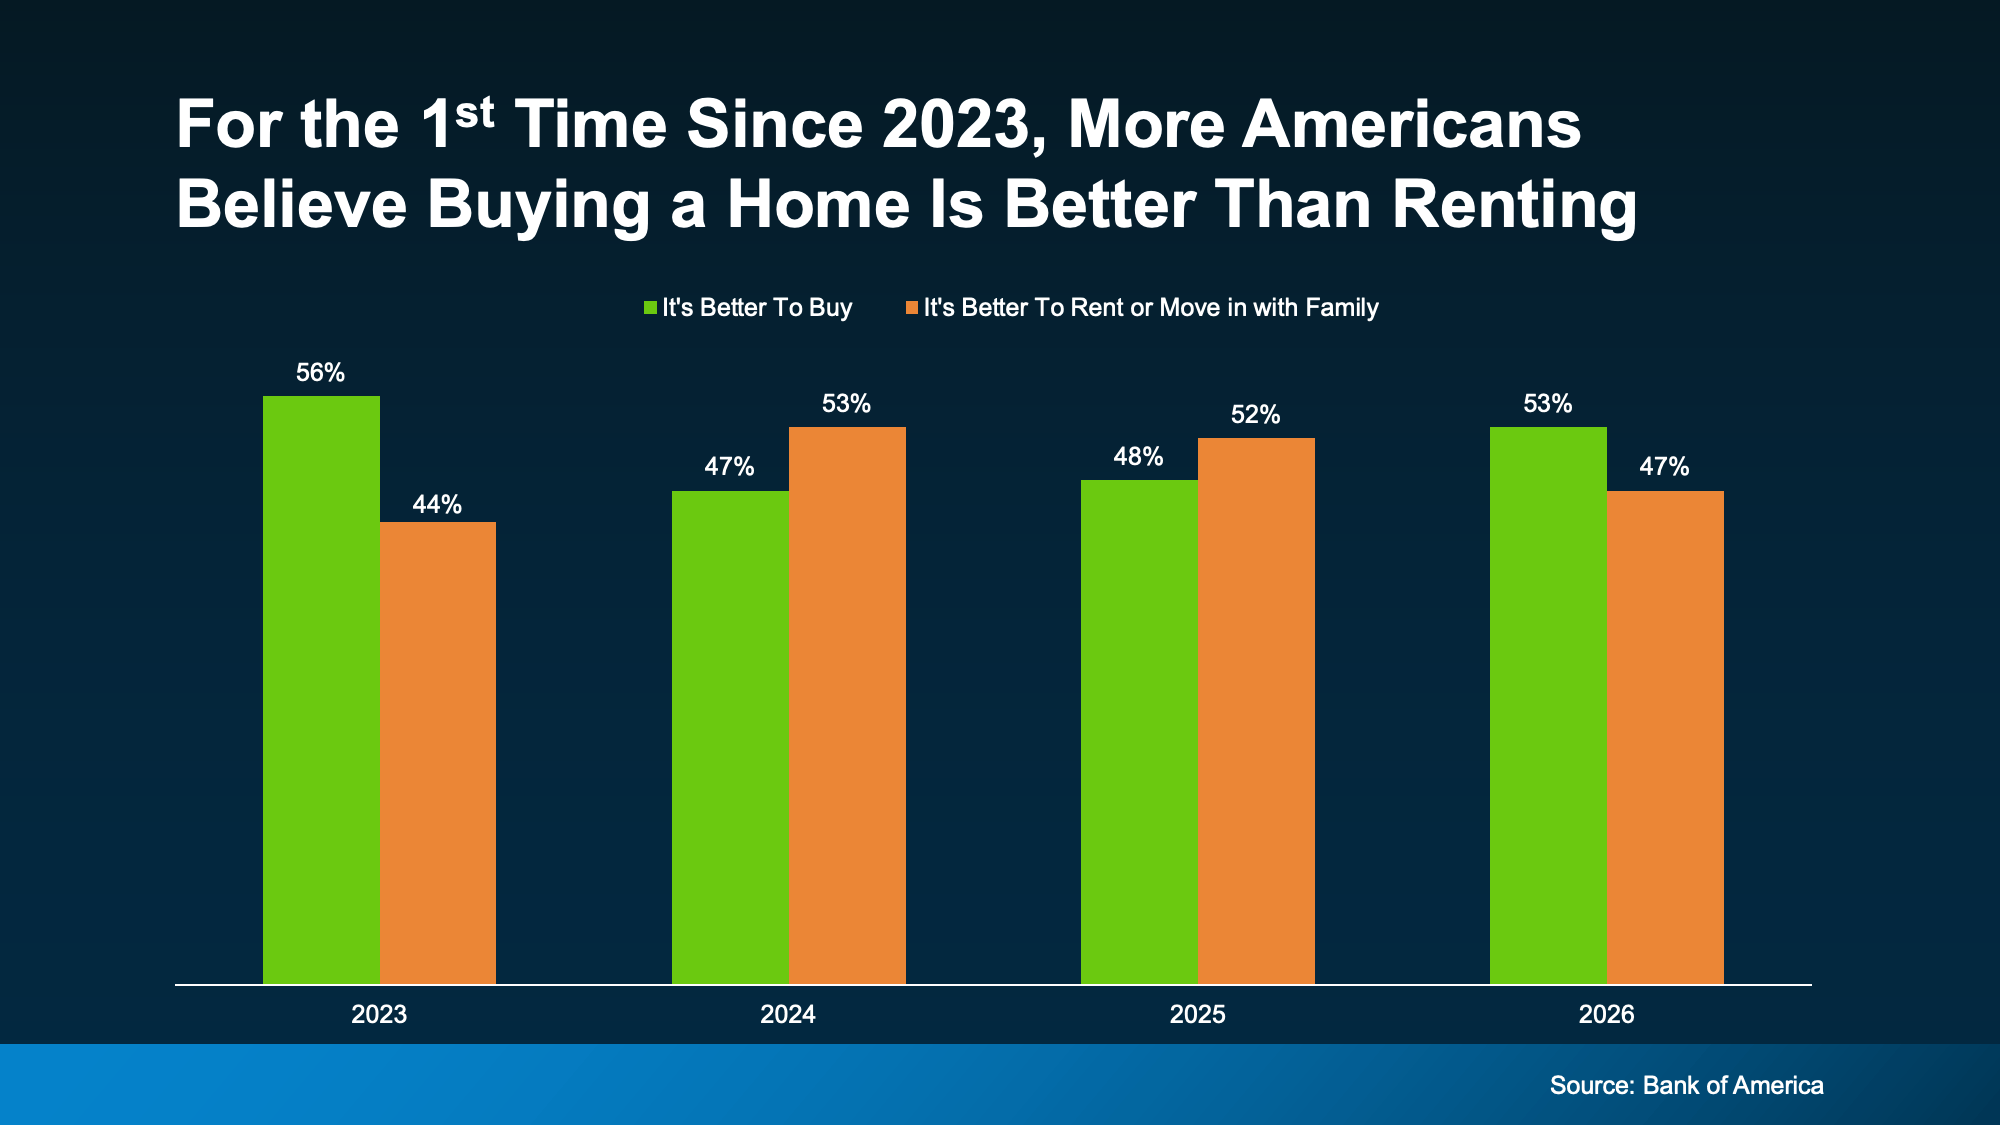
According to Bank of America‘s latest Homebuyer Insights Report, 53% of people now say it’s better to buy a home than to rent or move in with family. That’s the first time buying has taken the lead since 2023 (see graph below):
In that same report, here are a few other signals that confidence in homeownership is on the rise:
-
90% of people say a home is a valuable investment, up from 79% just last year.
-
And 94% say owning a home provides stability, up from 83% the year prior.
Those are relatively big jumps in a short amount of time. And here’s what may be driving it.
It’s About More Than Money
Sure, affordability is still tight and some markets are still hard to break into, but that hasn’t changed what people feel about homeownership as a goal. And the reason why is simple – it’s not just a financial decision. It’s a lifestyle choice.
A home pays you back in ways stocks never could. As Sheharyar Bokhari, Principal Economist at Redfin, says:
“For many homeowners, a home is more than a place to sleep and store belongings—it’s a reflection of who they are. Homeownership can help people put down roots, build relationships and create a space that feels uniquely their own.”
You can’t get that from a brokerage account. A home is the one investment that grows your wealth and gives you a place to build your life. And that means something.
Bottom Line
For 14 years straight, Americans have called real estate the best long-term investment, and confidence in owning a home is on the rise. If you’ve been weighing whether buying is worth it, connect with a local real estate agent and talk through what that first step could look like for you.

Negotiations are back. More buyers are asking for better deals, and more sellers are giving them. Builders are throwing in extras, too.
That’s why whether you’re buying or selling today, there are two terms you’ll hear a lot: concession and incentive.
-
A concession is something a seller agrees to during negotiations to get a deal done.
-
An incentive is a perk a builder (or a seller) advertises upfront to attract buyers.
Let’s run through what you need to know about both and how they could play a role in your move.
More Sellers Are Agreeing to Concessions
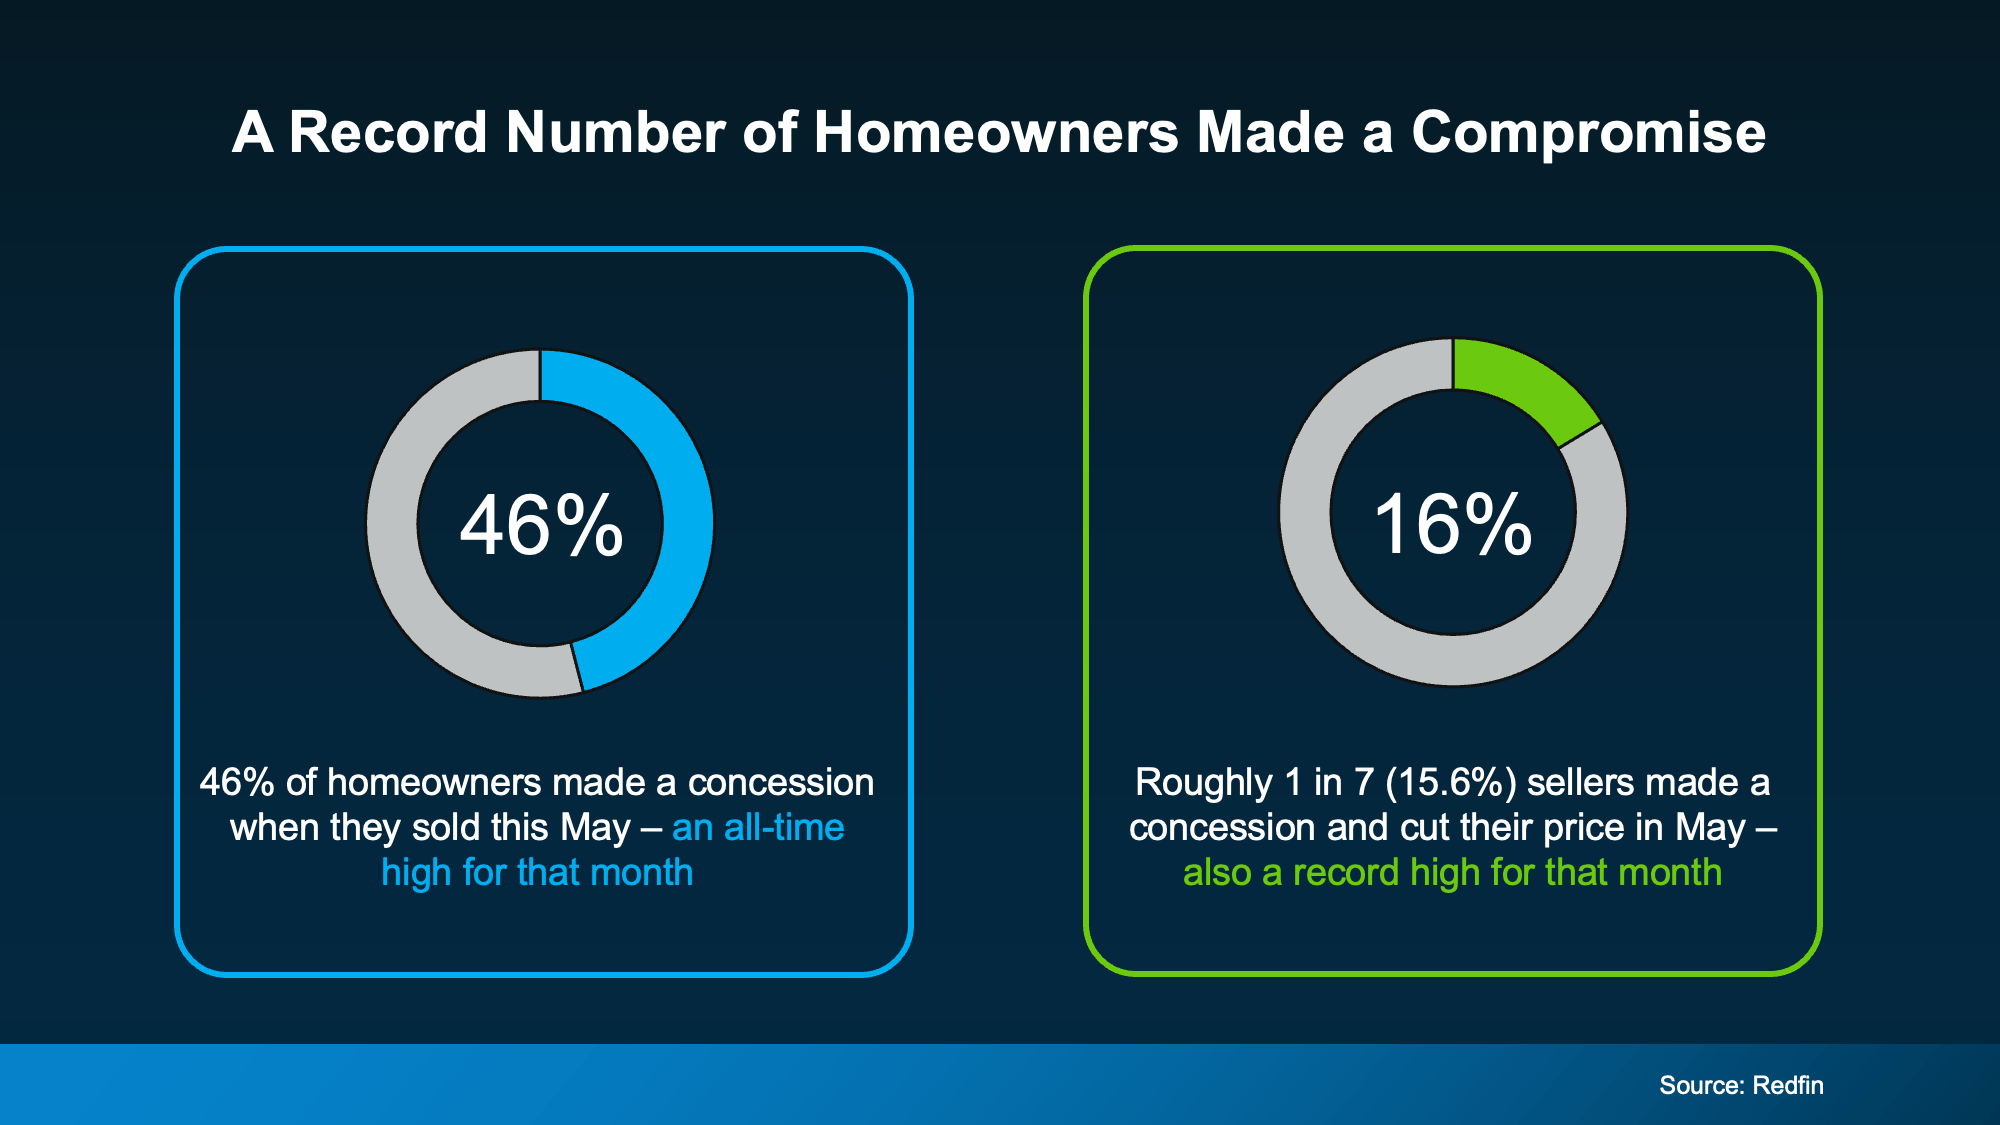
Almost half (46%) of homeowners who sold recently gave the buyer a concession, according to Redfin. That’s the highest share on record for this time of year. And roughly 1 in 7 (16%) sellers went a step further, cutting their asking price and offering a concession on top (see chart below):
So, what kind of concessions are we talking about?
A seller might cover part of your closing costs, take care of a repair, or offer a credit that trims your upfront costs. It’s how they keep a deal on track when buyers have more options to choose from – and homeowners aren’t the only ones compromising.
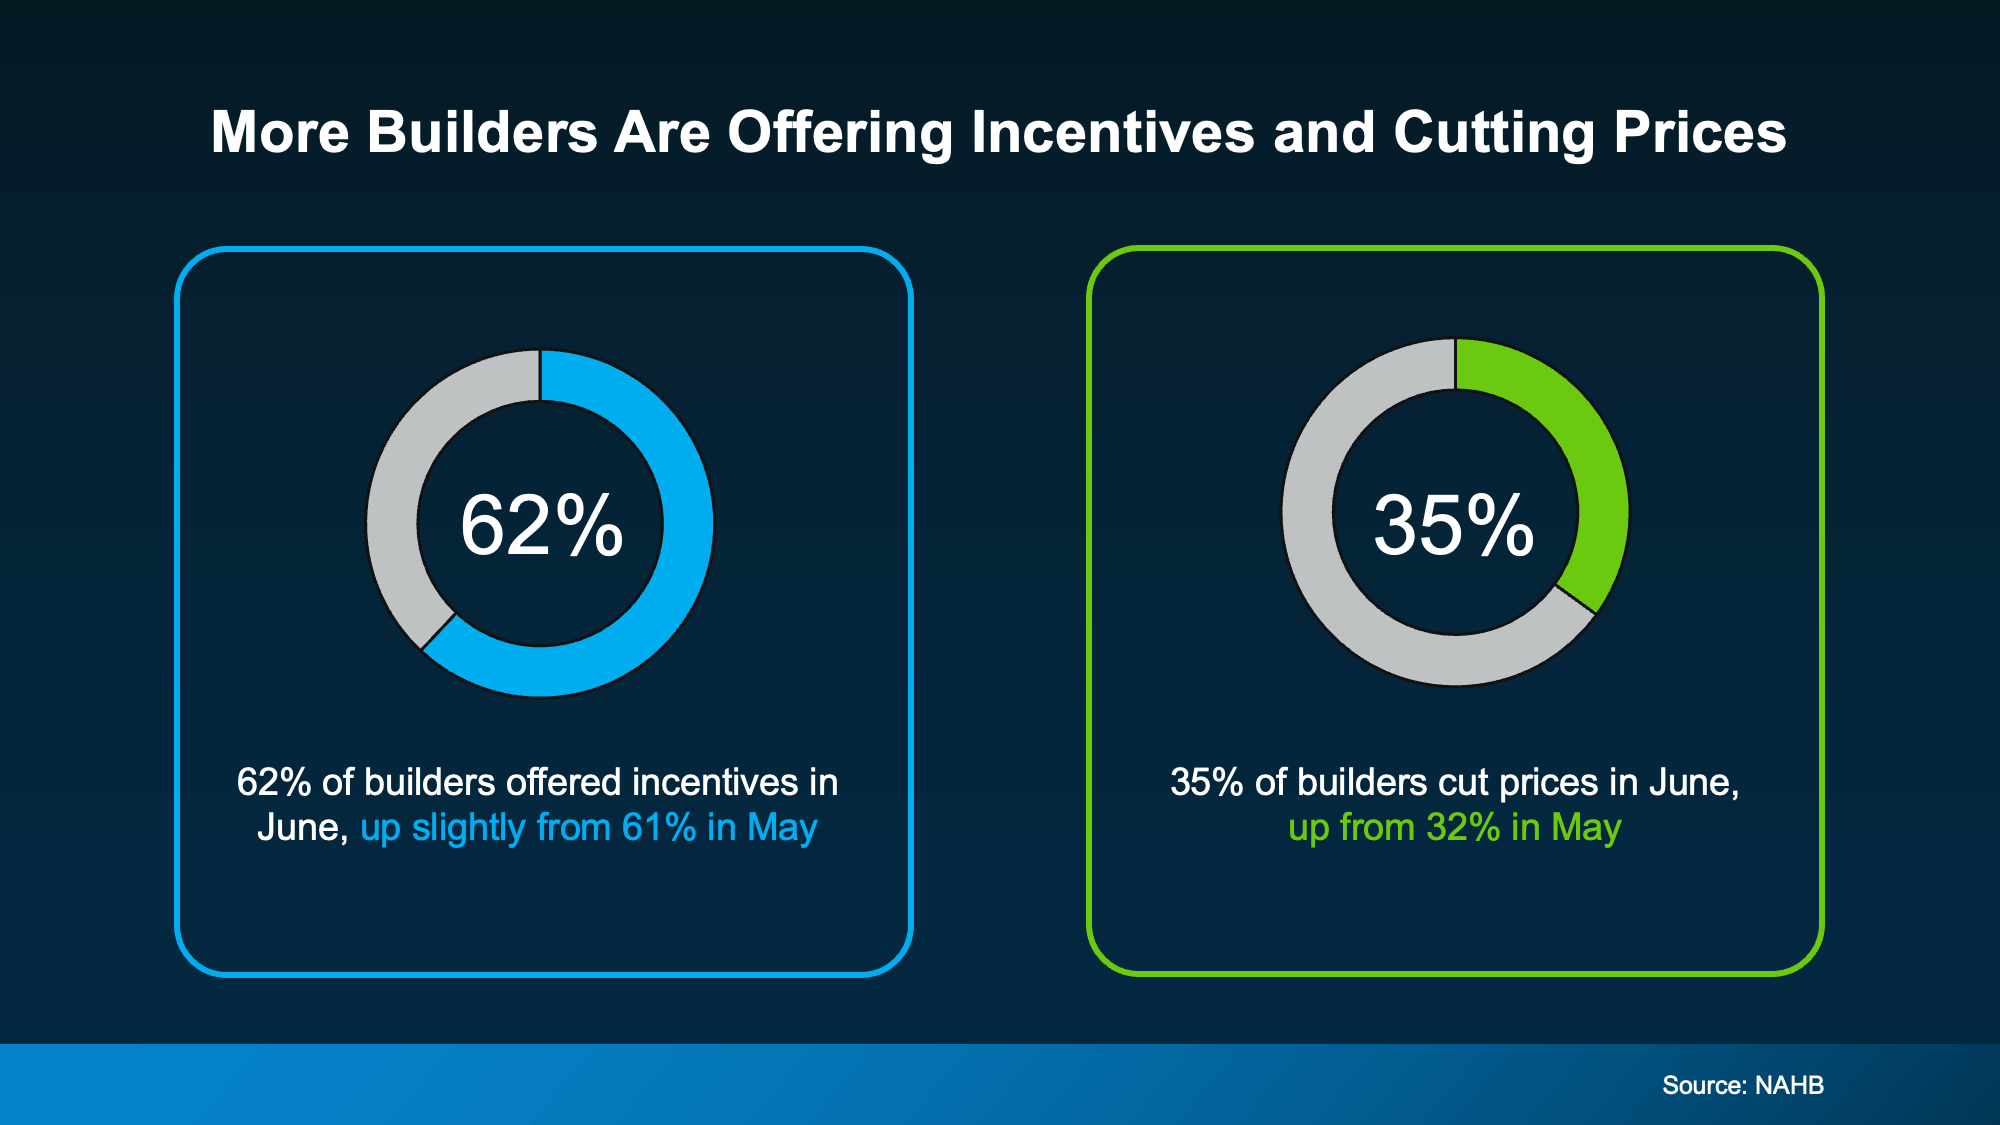
Builders Are Cutting Prices, Too
Newly built homes are seeing the same push and pull. According to the National Association of Home Builders (NAHB), 62% of builders are offering incentives right now. And about 35% are cutting prices outright (see chart below):
Those incentives often look like:
-
Mortgage rate buydowns
-
Free upgrades, like nicer finishes or appliances
Danielle Hale, Chief Economist at Realtor.com, explains why:
“New construction has been one of the steadiest parts of the housing market over the past few years, but builders are clearly responding to today’s affordability pressures and higher levels of existing-home inventory.”
Even builders, who many people think rarely negotiate, are competing on price and perks. They have been for over a year now. The same data shows this is the 15th straight month where more than 60% of builders have offered incentives to sweeten the deal. And that’s significant.
What This Means for Your Move
If you’re buying, this is a good time to ask. Whether you have your eye on an existing house or a newly built home, there’s a chance the seller or builder will meet you partway on price, terms, or both.
If you’re selling, expect buyers to ask. Even builders of brand-new homes are making concessions more often than not right now. Holding firm on every term could mean more time on the market, or a lost sale altogether.
Bottom Line
Sellers and builders are both giving buyers more to work with this year. A local agent can tell you what to expect in concessions and incentives based on inventory and competition in your local market.

If the first half of this year has left you feeling stuck, you’re not the only one. Mortgage rates stayed higher than people wanted. Affordability remained tight. And uncertainty overseas added another layer of pressure nobody saw coming.
That’s why so many people are asking the same question: Will the second half of the year be any better for the housing market?
While nobody has a crystal ball, there are a few encouraging signs things could start moving in a better direction. Here’s what to watch.
Mortgage Rates Could Be Near a Turning Point
One of the biggest reasons mortgage rates haven’t come down yet is inflation. And higher energy prices and uncertainty overseas are at least part of the reason inflation is still elevated. The encouraging news?
Oil prices have already started coming back down.
That may not sound like it has much to do with buying a home. But historically, mortgage rates and oil prices tend to move in the same direction.
Take a look at the graph below. Generally, they rise and fall together. Both went up in February when the conflict began. While there’s been some volatility lately, experts at the U.S. Energy Information Administration (EIA) say oil prices are forecast to come down. And since oil prices have been on an overall downward trend lately, mortgage rates could come down too:
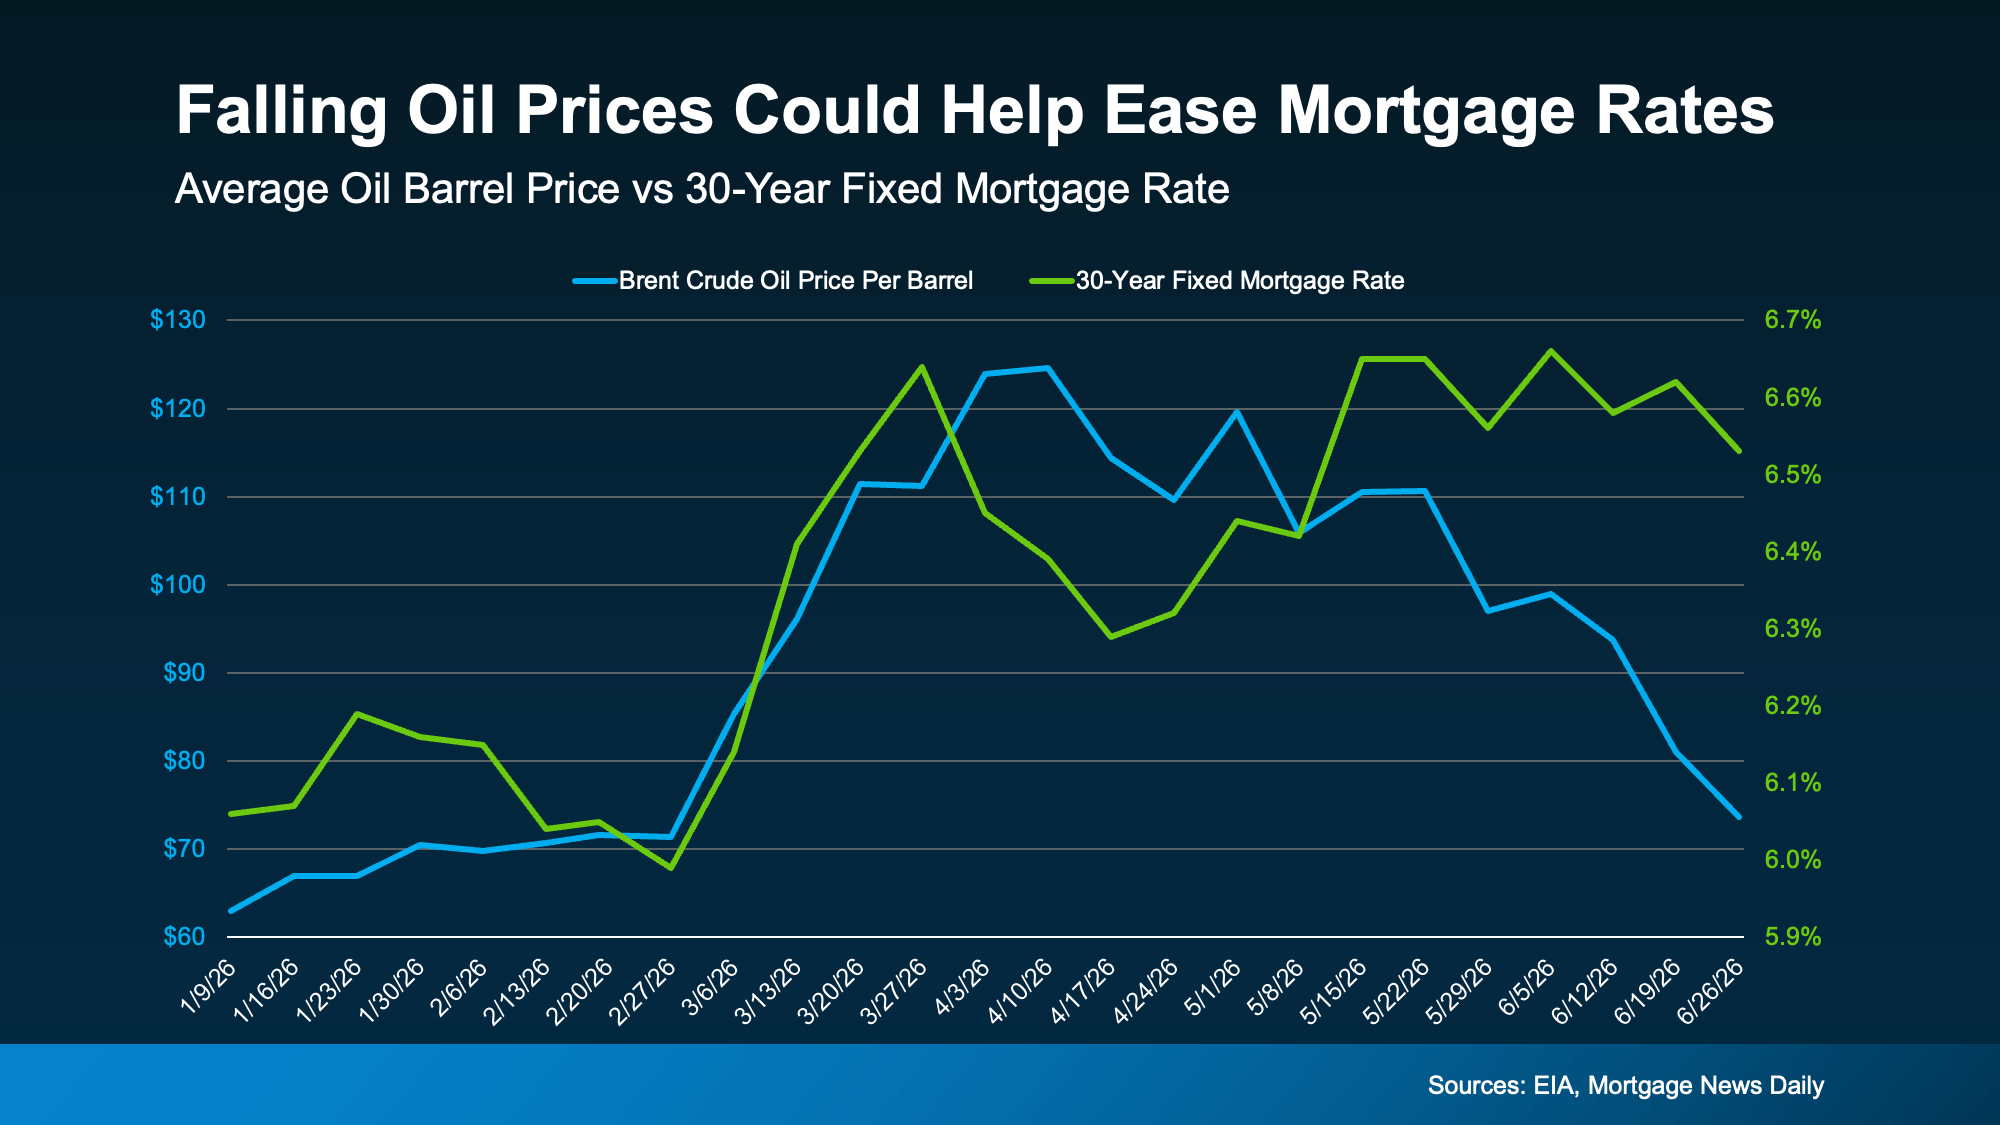
It’s too soon to say exactly when that will happen (or by how much they’ll fall), but if energy prices go down, inflation cools off, and tensions overseas ease, mortgage rates could come down in the second half of the year.
And that’s good news for anyone thinking about moving. The first half of the year tested everyone’s patience. The second half may finally reward it.
Home Prices Could Pick Back Up
A lot of people want home prices to fall too. But that’s not what most forecasts show.
While price trends are going to vary by area, and some places are seeing mild declines, experts still expect home prices to net positive this year at the national level.
In fact, they’re projecting prices will rise by an average of 2.3% in 2026 (see graph below):
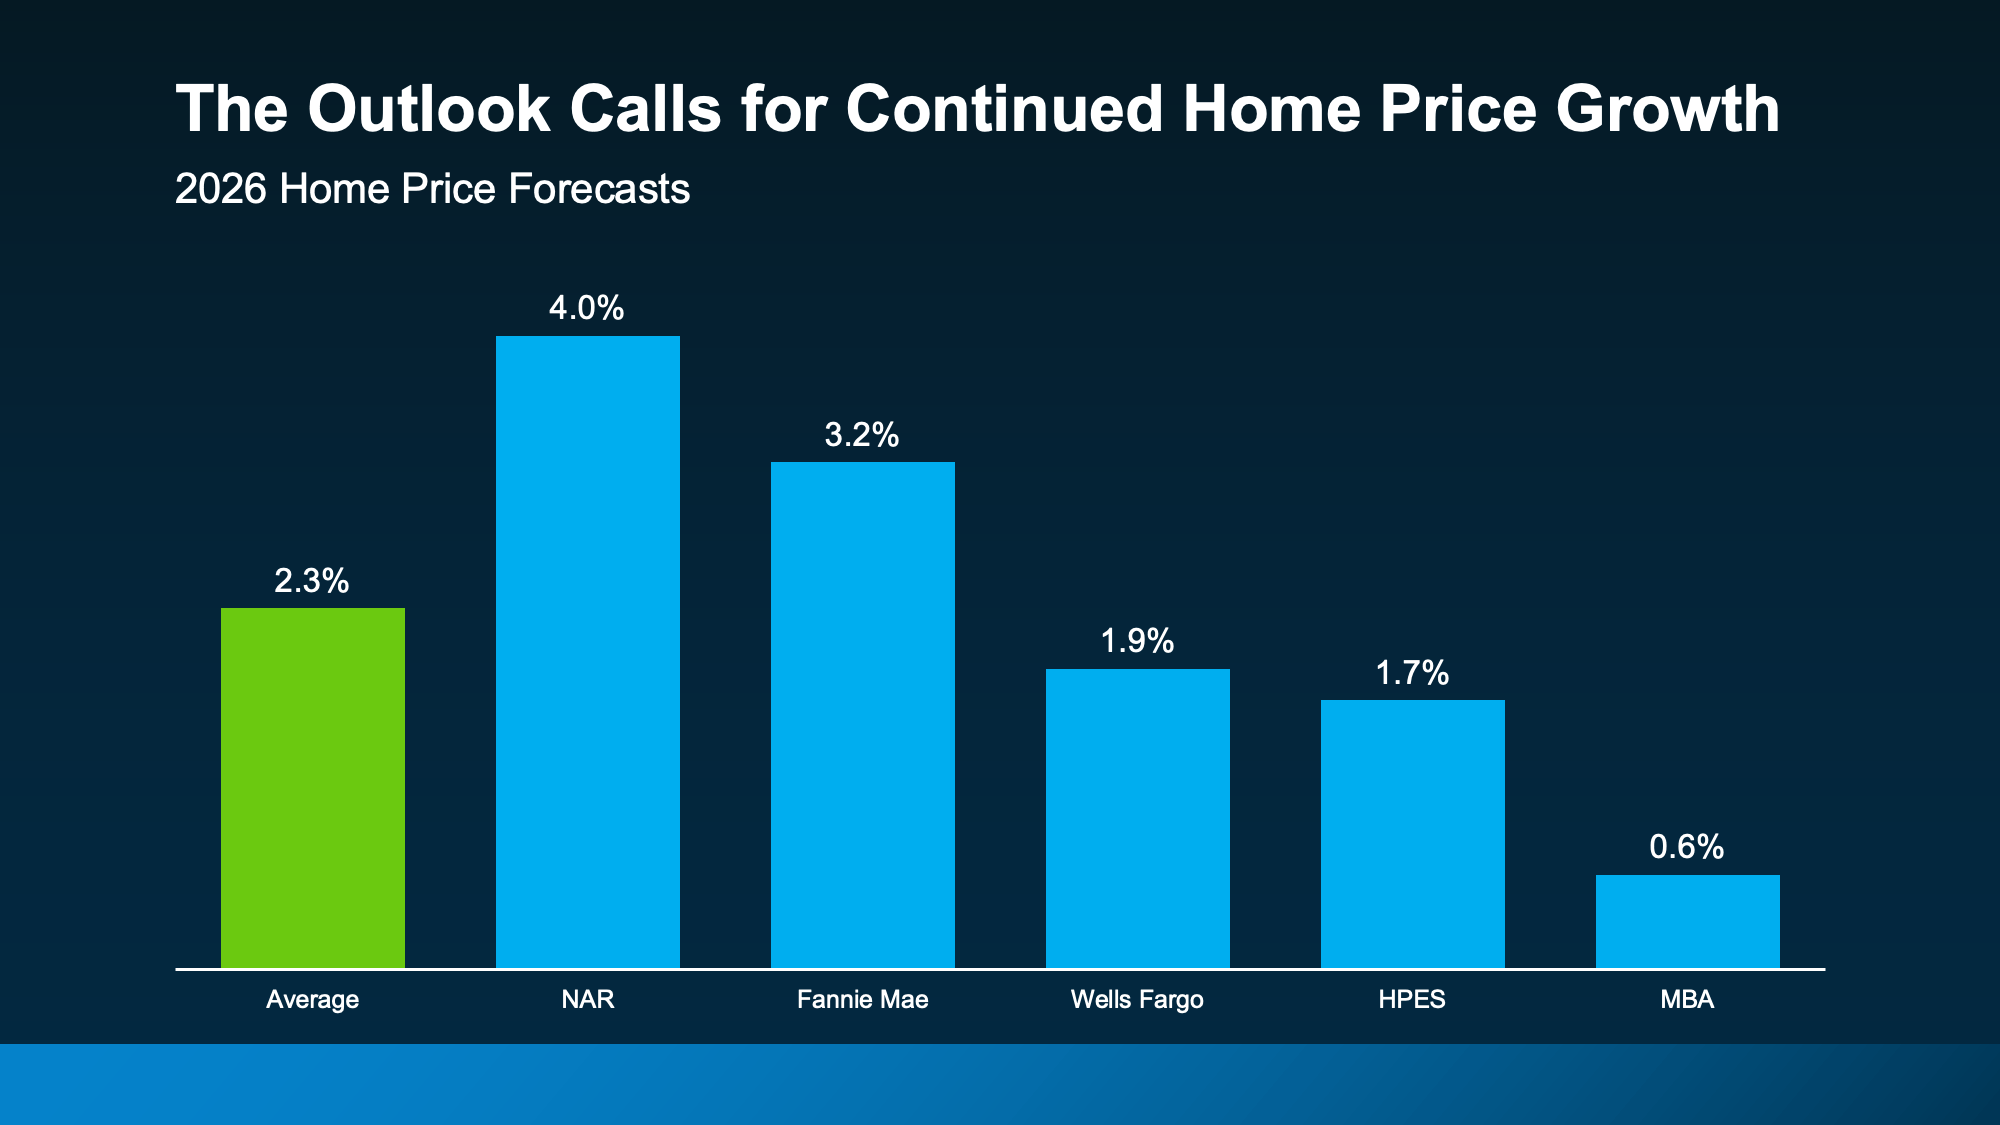
What does that mean for you? Right now, Federal Housing Finance Agency (FHFA)data shows prices are up about 1.7% nationally year-over-year. The average forecast for all of 2026? 2.3%.
Based on those projections, home price growth would have to pick up a bit during the second half of the year. Nothing dramatic, just enough to finish the year around that projected 2.3% gain.
Here’s why that’s possible.
The number of homes for sale has grown, but that growth may be starting to slow down. And if rates improve, more buyers could jump back into the market. More buyers competing could put modest upward pressure on prices, especially if inventory’s not growing as fast.
That’s why buyers shouldn’t assume waiting will guarantee a lower price later. And for sellers, that’s great news if you’ve been worried about your home’s value.
More Homes Are Expected To Sell
If you’ve been wondering why the housing market has felt quieter lately, you’re not imagining it. Home sales have been slower than many experts expected. But that doesn’t mean people have stopped wanting to move.
A lot of people still want or need to make a change. They’ve just been waiting for more certainty, better affordability, or a clearer read on where the market is headed. And early signs show that may be on the horizon.
If rates ease and confidence improves, more people may finally move. As Odeta Kushi, Deputy Chief Economist at First American, explains:
“Overall, we expect pent-up demand to continue emerging gradually. But the pace of recovery will vary significantly across markets and will depend on the path of rates, labor market conditions and inventory growth.”
Based on the latest forecasts, to hit the number of sales expected this year, here’s what would have to happen. The second half of the year would need to outperform the first in sales (see graph below):
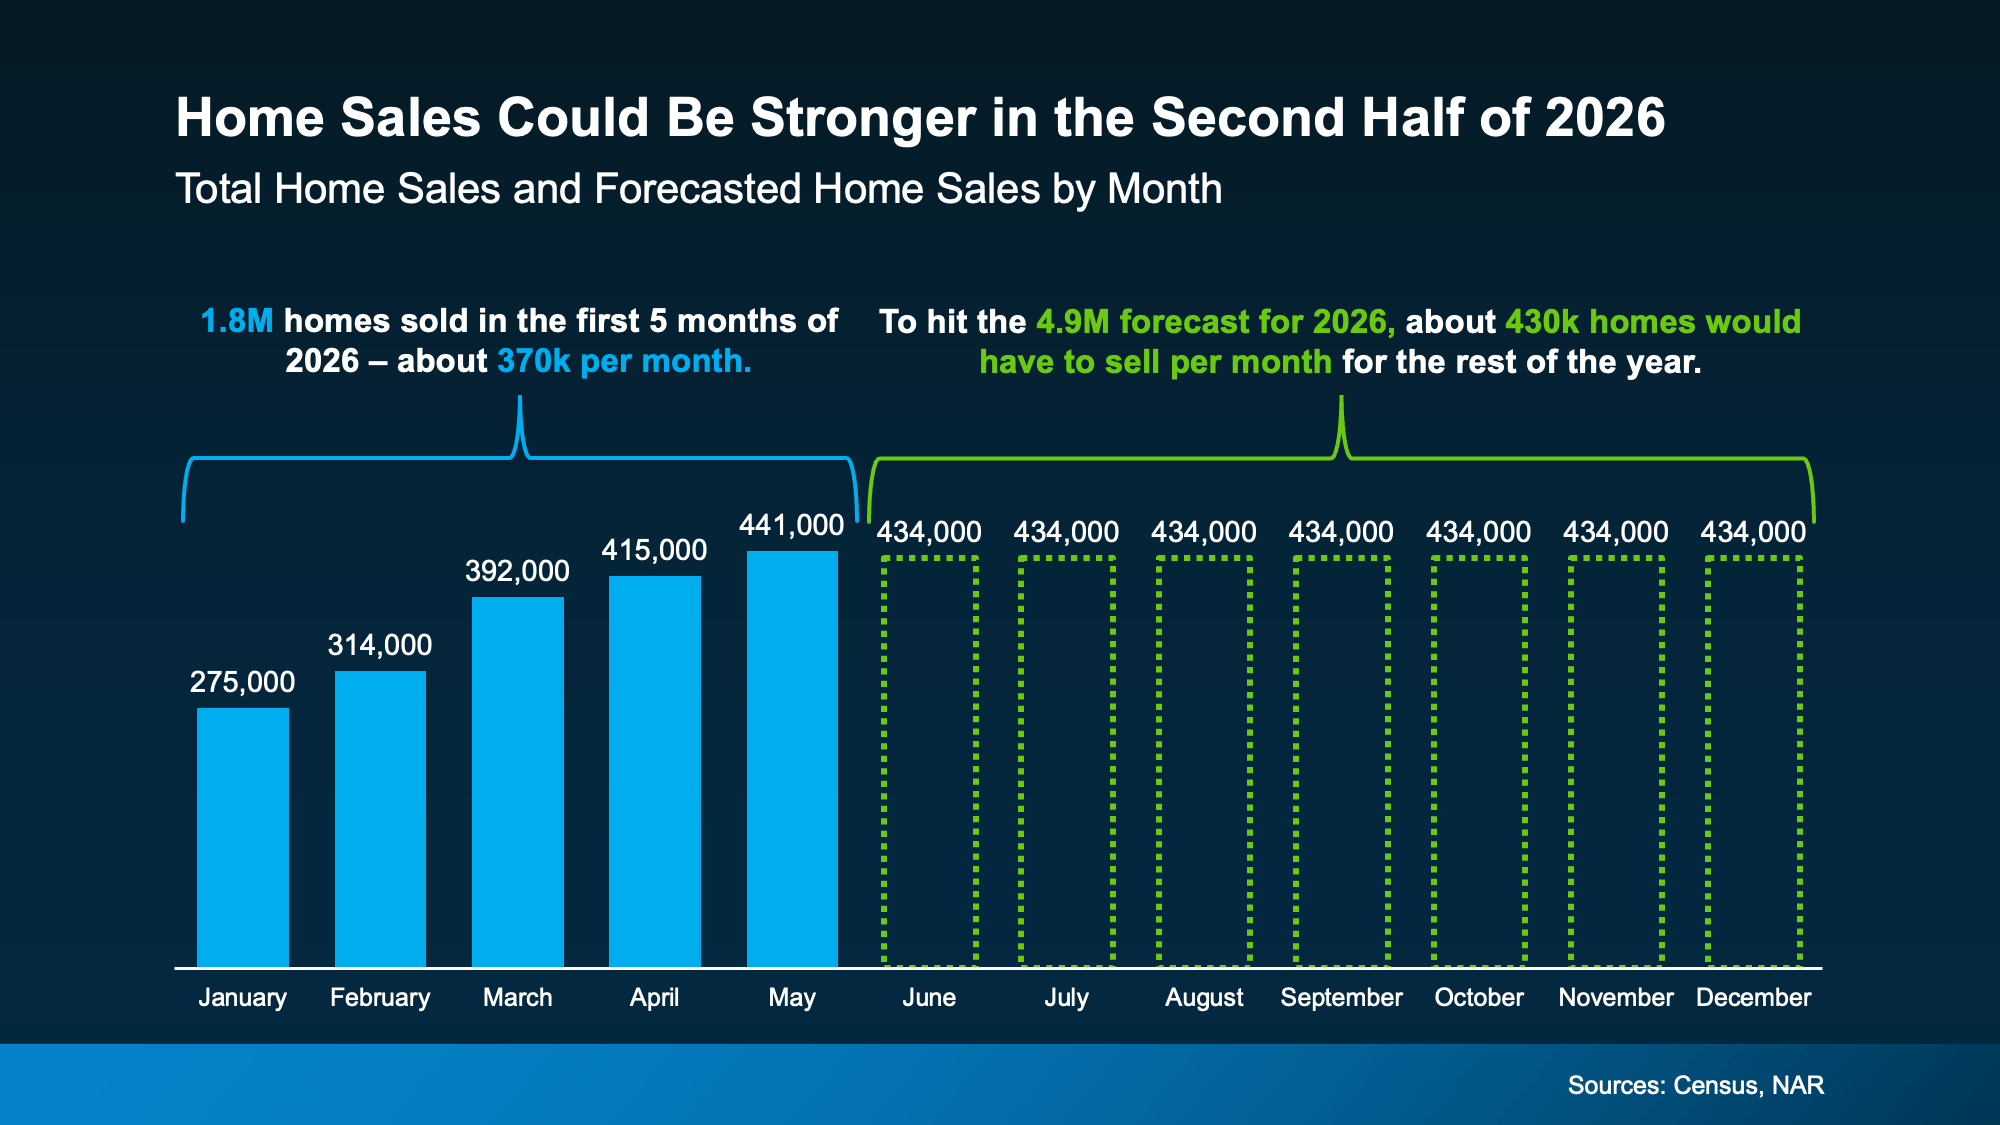
In fact, each month for the rest of 2026 would have to come close to matching the best month we’ve had so far this year (May). That’s a sign the experts are calling for more momentum headed into the second half.
More people will finally make their move happen – and you’ve got the chance to be one of them.
Bottom Line
The second half of the year probably won’t be perfect. But it could be better.
Mortgage rates may ease. Home sales could pick up. And prices are expected to continue rising at a healthier, more sustainable pace. If you’ve been waiting for signs of progress, this is it.
If you want to understand what these forecasts mean for your plans and what’s happening in your local market, connect with an agent.

14 Years Running: Why Real Estate Is Still America’s Favorite Investment

Think Nobody’s Buying Homes Right Now? Think Again.

The “Take It or Leave It” Attitude Is Fading from the Market – What That Means for You


-

 For Buyers4 weeks ago
Think Home Prices Will Crash? Here’s What the Experts Actually Expect.
-

 Economy3 weeks ago
More Sellers Are Taking Their Homes off the Market. Here’s What You Need To Know.
-
 Affordability3 weeks ago
That House That’s Been Sitting Could Be Your Best Shot at a Deal
-

 Agent Value4 weeks ago
Is It Still a Seller’s Market? Here’s What the Data Says.
-
 Agent Value3 weeks ago
Your House Didn’t Sell. Here’s How To Turn It Around.
-
 Equity2 weeks ago
The Housing Market Is Stronger Than You Think
-

 Buying Tips2 weeks ago
The 1 Factor That Explains Everything Happening with Home Prices Right Now
-
 Economy1 week ago
What Buying or Selling a Home Gives Back to Your Community
You must be logged in to post a comment Login