
For Buyers
The 2020 Real Estate Projections That May Surprise You

This will be an interesting year for residential real estate. With a presidential election taking place this fall and talk of a possible recession occurring before the end of the year, predicting what will happen in the 2020 U.S. housing market can be challenging. As a result, taking a look at the combined projections from the most trusted entities in the industry when it comes to mortgage rates, home sales, and home prices is incredibly valuable – and they may surprise you.
Mortgage Rates
Projections from the experts at the National Association of Realtors (NAR), the Mortgage Bankers Association (MBA), Fannie Mae, and Freddie Mac all forecast mortgage rates remaining stable throughout 2020:
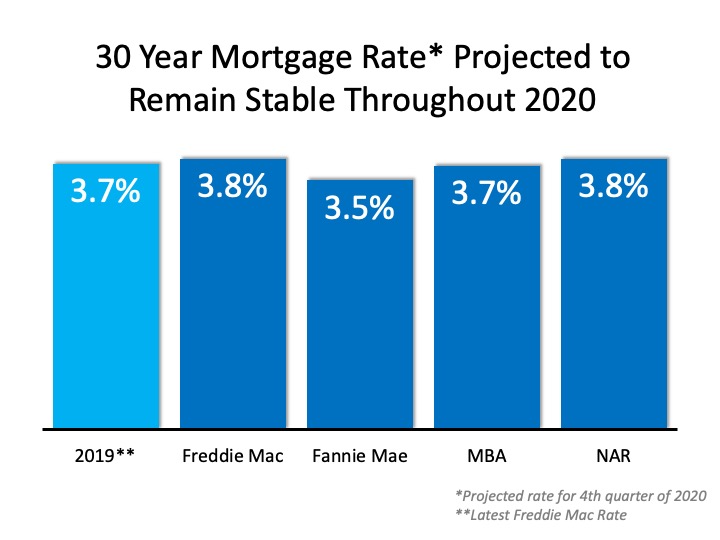
have right now.
Here are the average mortgage interest rates over the last several decades:
- 1970s: 8.86%
- 1980s: 12.70%
- 1990s: 8.12%
- 2000s: 6.29%
Home Sales
Three of the four expert groups noted above also predict an increase in home sales in 2020, and the fourth sees the transaction number remaining stable:
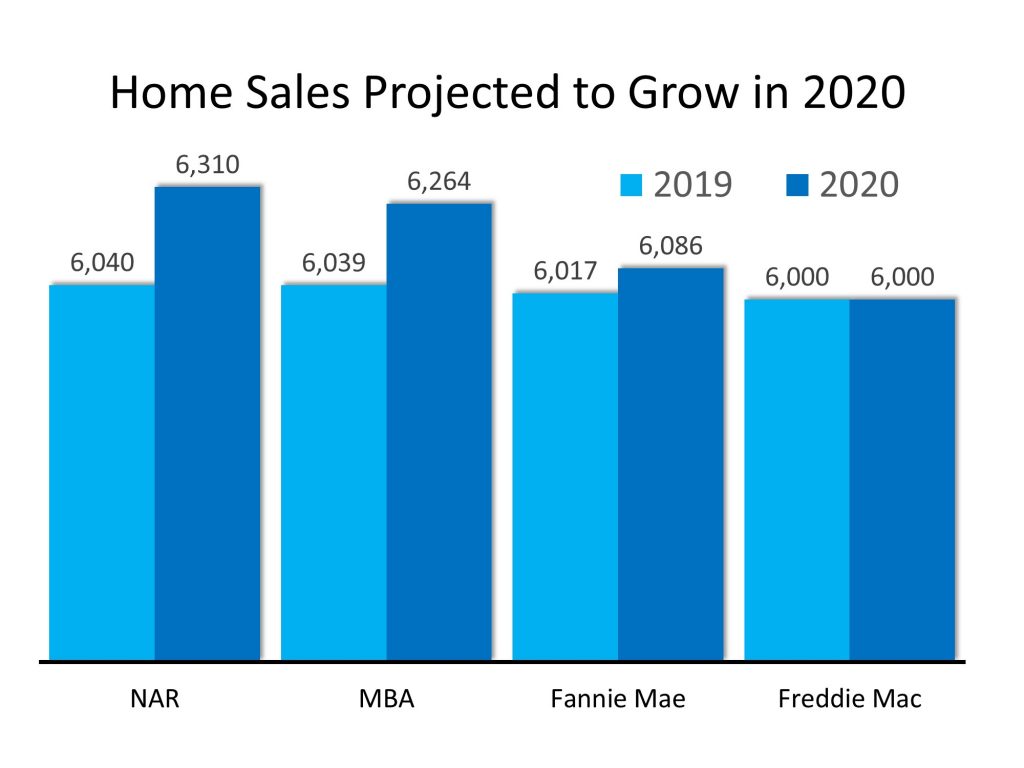
With mortgage rates remaining near all-time lows, demand should not be a challenge. The lack of available inventory, however, may moderate the increase in sales.
Home Prices
Below are the projections from six different expert entities that look closely at home values: CoreLogic, Fannie Mae, Ivy Zelman’s “Z Report”, the National Association of Realtors (NAR), Freddie Mac, and the Mortgage Bankers Association (MBA).
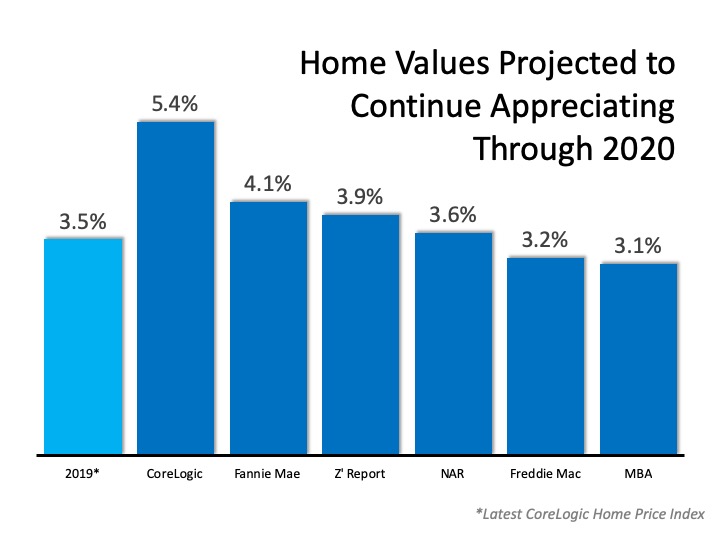
Each group has home values continuing to improve through 2020, with four of them seeing price appreciation increasing at a greater pace than it did in 2019.
Is a Recession Possible?
In early 2019, a large percentage of economists began predicting a recession may occur in 2020. In addition, a recent survey of potential home purchasers showed that over 50% agreed it would occur this year. The economy, however, remained strong in the fourth quarter, and that has caused many to rethink the possibility.
For example, Goldman Sachs, in their 2020 U.S. Outlook, explained:
“Markets sounded the recession alarm this year, and the average forecaster now sees a 33% chance of recession over the next year. In contrast, our new recession model suggests just a 20% probability. Despite the record age of the expansion, the usual late-cycle problems—inflationary overheating and financial imbalances—do not look threatening.”
Bottom Line
Mortgage rates are projected to remain under 4%, causing sales to increase in 2020. With growing demand and a limited supply of inventory, prices will continue to appreciate, while the threat of an impending recession seems to be softening. It looks like 2020 may be a solid year for the real estate market.


Here’s something most homebuyers don’t think about. When the housing market slows down, homeowners and builders don’t always respond the same way.
Think about it. If you’re selling your house and aren’t getting the offers you want, you could make the choice to take it off the market and stay put, and wait for things to improve.
But builders? They may be more motivated to stay the course.
They’ve already invested money in building those houses. And every completed home that sits unsold means money tied up in a property, plus ongoing costs that can add up.
That’s why some builders may be more motivated to negotiate right now. And that could work in your favor.
Fewer Buyers Are Making Moves. And Builders Are Feeling It.
You’ve probably seen the headlines. According to the latest report from the National Association of Realtors (NAR), pending home sales – homes that have gone under contract but haven’t closed yet – fell 7.3% in September and 11.3% compared to last year.
Why? Higher mortgage rates are making it harder for buyers to make the numbers work. Now, that report tracks existing homes, not new construction. But we’re seeing signs of the same slowdown on the builder side, too.
According to the National Association of Home Builders (NAHB), builder confidence dropped to 29 in October, its lowest level since June 2012. Traffic from prospective buyers also dropped to its lowest level in more than a decade, excluding the start of the pandemic.
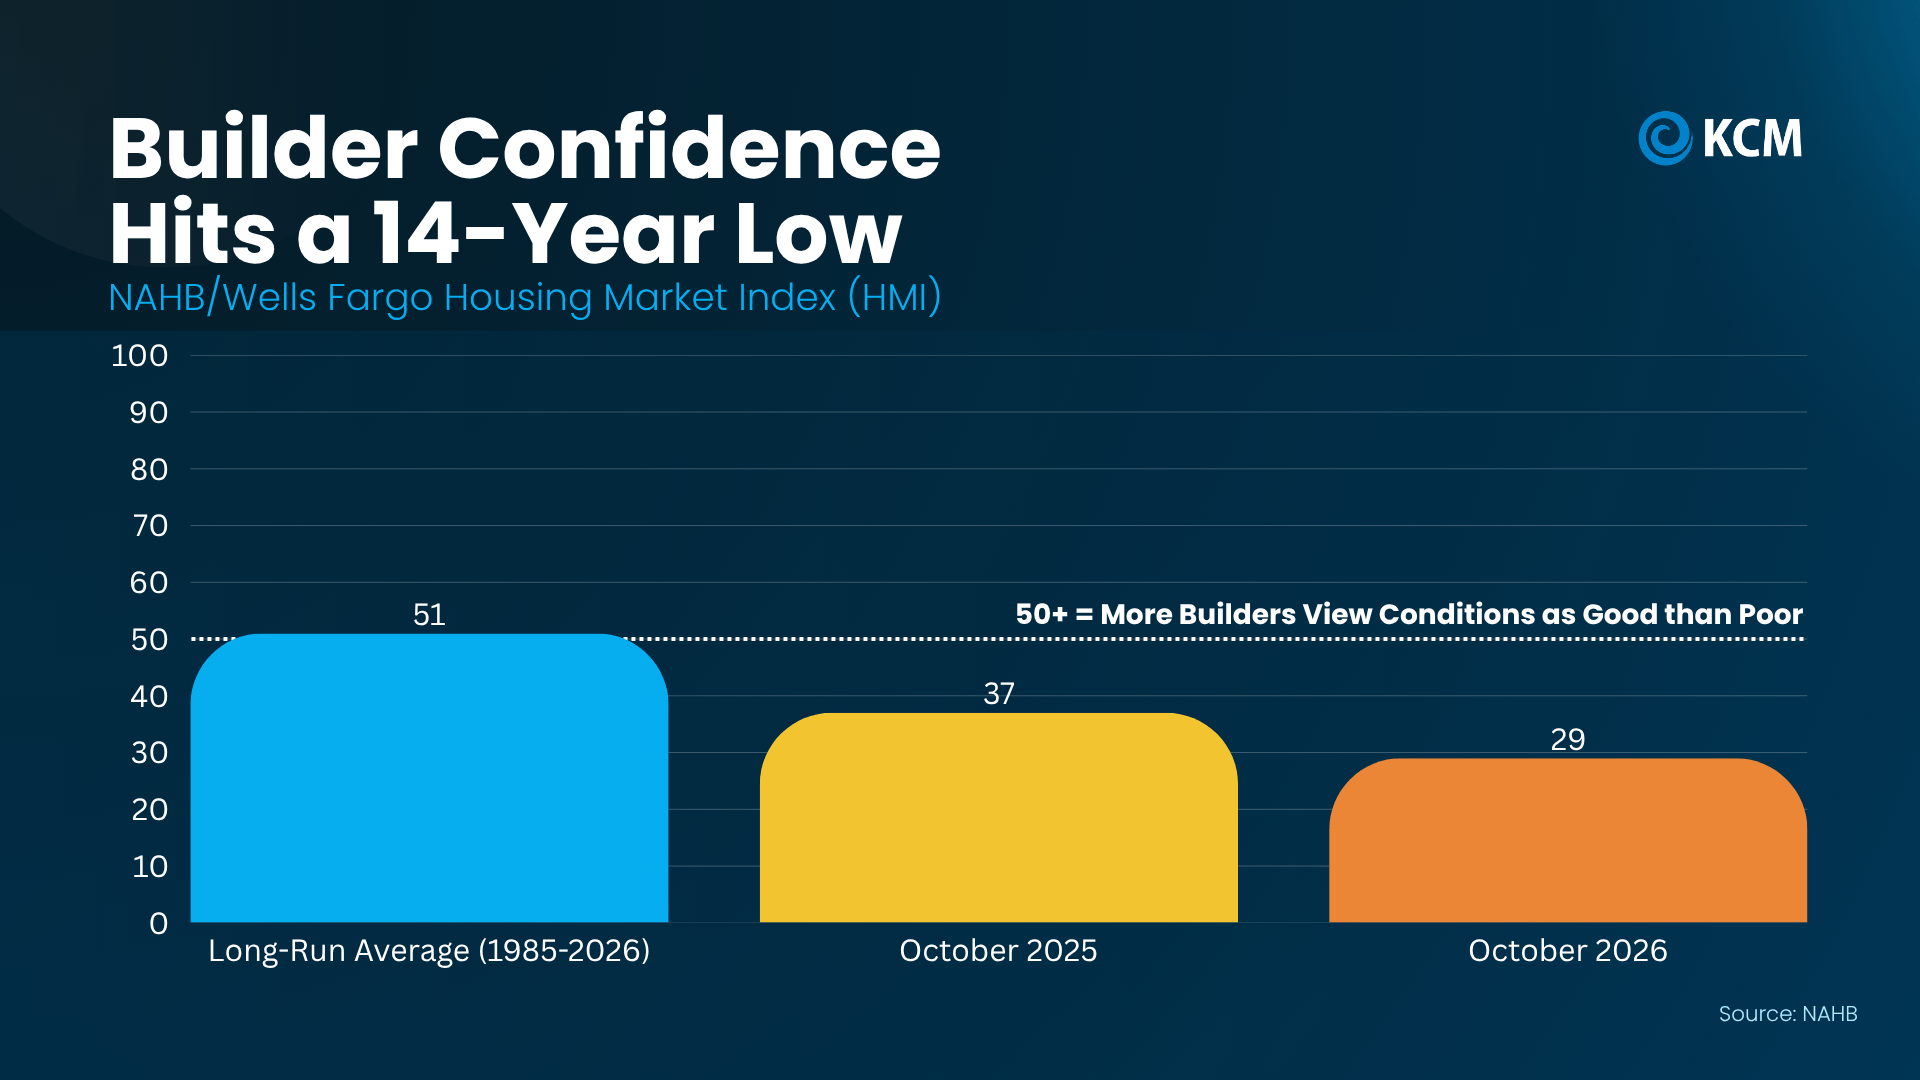
As Robert Dietz, Chief Economist at NAHB, explains:
“Demand persists, but higher mortgage rates, elevated construction costs and weaker consumer confidence are keeping more buyers on the sidelines.”
Here’s why that matters for you.
A homeowner may be able to wait for the right offer. But a builder with several finished houses sitting unsold may have more reason to get those homes sold sooner rather than later.
And that means they may be more willing to work with you than you think.
Builders Are Already Making Moves To Win Buyers Over
If you’ve always assumed builders don’t negotiate, take a look at what they’re actually doing. According to the latest survey from NAHB, in October:
-
65% of builders are offering sales incentives.
-
43% are cutting prices, the highest share recorded between 2020 and 2026.
-
And 6% is what they’re typically taking off the price.
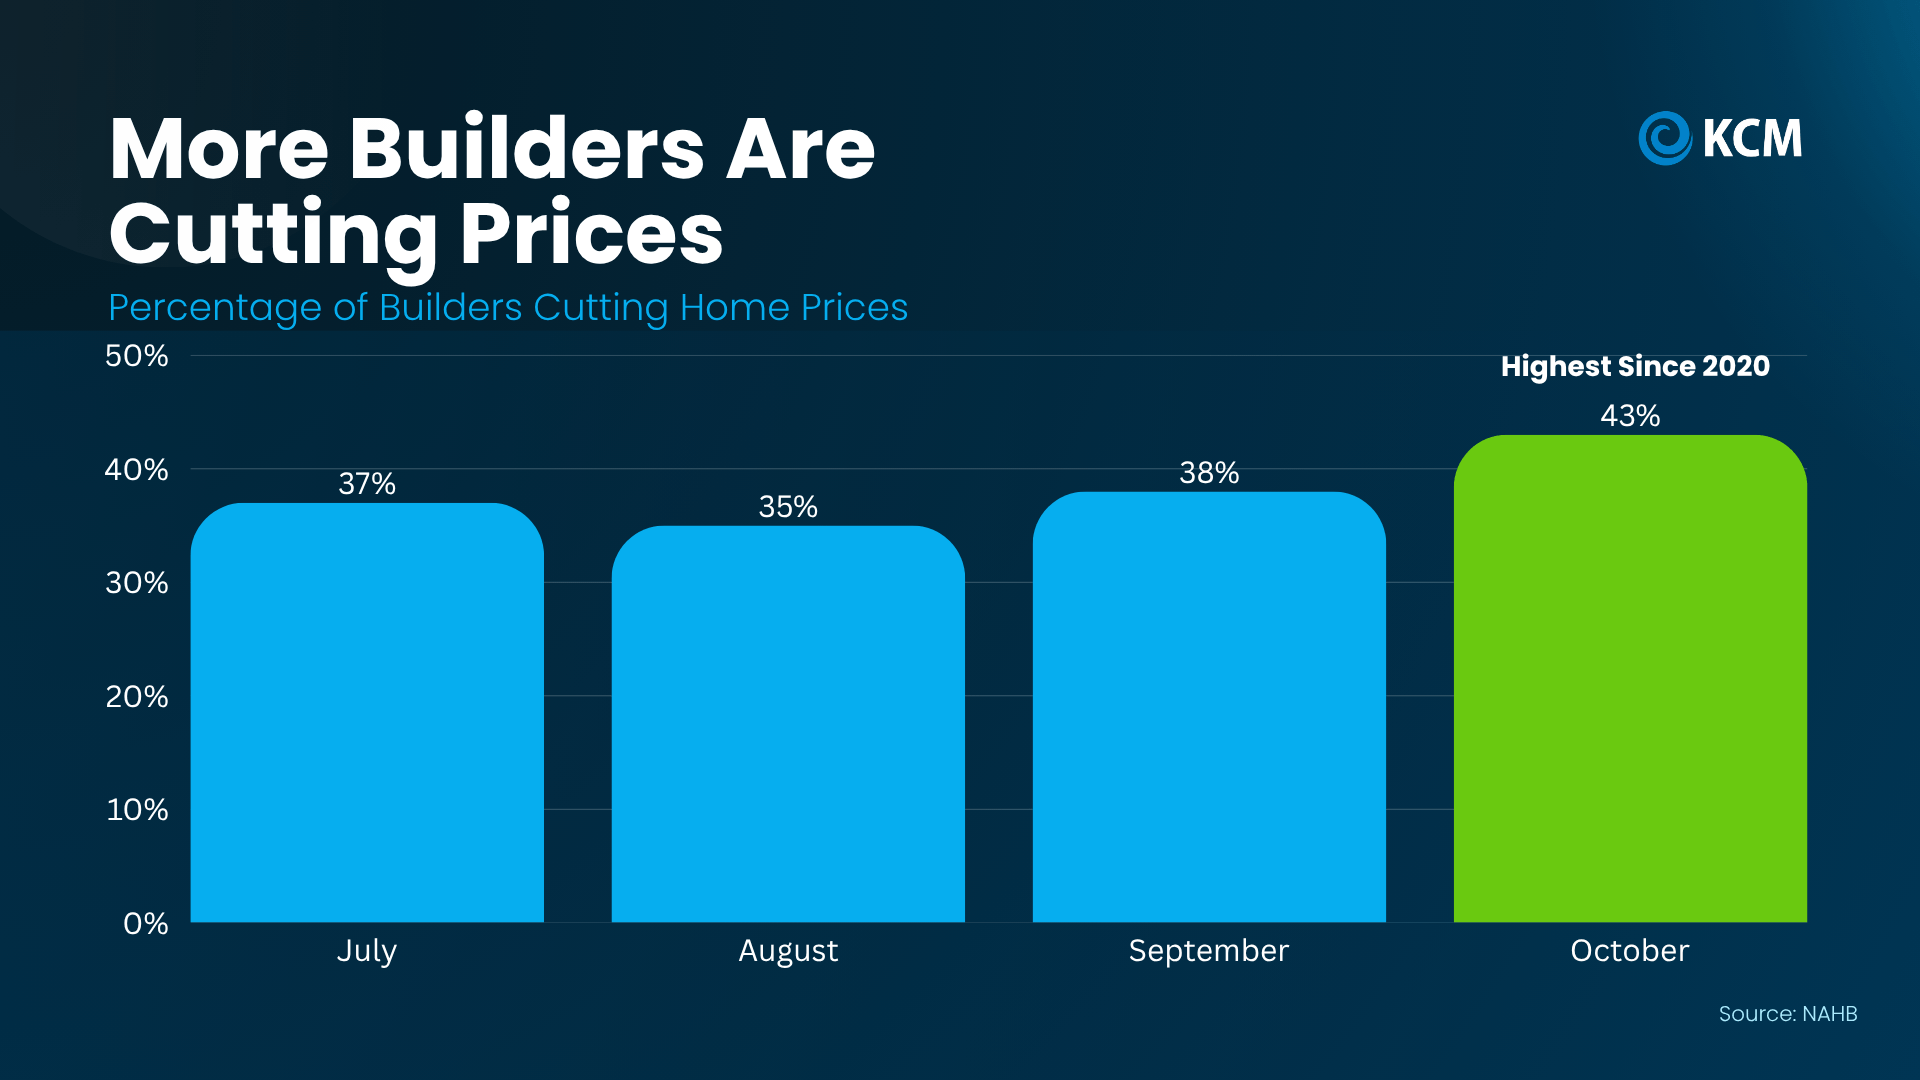
So, yes. Builders absolutely do negotiate. And with demand slowing, there’s good reason to explore just how flexible they may be right now.
That could mean asking for a lower price. But it could also mean asking for a mortgage-rate buydown, help with closing costs, or upgrades that would otherwise cost you extra.
And here’s a tip that could make a real difference.
Don’t just look at the newest communities or the prettiest model homes. Look for builders with completed houses that haven’t sold yet.
Those are sometimes called quick move-in homes or spec homes. And the longer one of those move-in ready homes sits unsold, the more reason a builder may have to consider an offer that helps get it off their books.
Don’t Just Ask What’s Available. Ask What’s Negotiable.
Don’t assume the advertised price or incentive package is the best they’ll do.
This is where having your own agent can really pay off. An agent who knows the local market can help you compare what builders are offering, identify communities with more available homes, and understand where there’s room to negotiate.
Of course, not every builder will offer the same incentives. And some may be more flexible on closing costs or mortgage rates than on the price itself.
But that’s exactly why it pays to ask.
The trick is knowing where to look, what to ask for, and how much room there may be to negotiate. And that’s where having your own agent is key.
Bottom Line
A homeowner who isn’t ready to accept a lower offer may be able to wait. But a builder with finished houses to sell has a different set of priorities. And that could work in your favor.
If you’re ready to buy, talk to a local agent about which builders have completed homes sitting on the market in your area see what they’re willing to offer to get them sold.

When mortgage rates climb, buying a home can start to feel like trying to hit a moving target. Every jump in rates makes monthly payments bigger, and that pushes a lot of buyers to look for another way in.
More and more of them are finding it in the adjustable-rate mortgage, or ARM.
The ARM Option
Here’s how an ARM differs from a more traditional mortgage. With a regular fixed-rate mortgage, your rate stays the same for your whole loan. But with an ARM, your rate is locked for the first few years, then it can move up or down based on market conditions.
Some people don’t like that level of uncertainty – and that’s okay. But others are drawn to this option specifically because there’s usually a lower rate to start when you opt for an ARM. And in an affordability-strapped market, that’s going to gain popularity.
Bankrate recently found that, in September, rates for ARM products were over a full percentage point lower than a regular fixed-rate loan. Depending on the ARM product, that can make a difference of $150-300 in the monthly payment on a median-priced home.
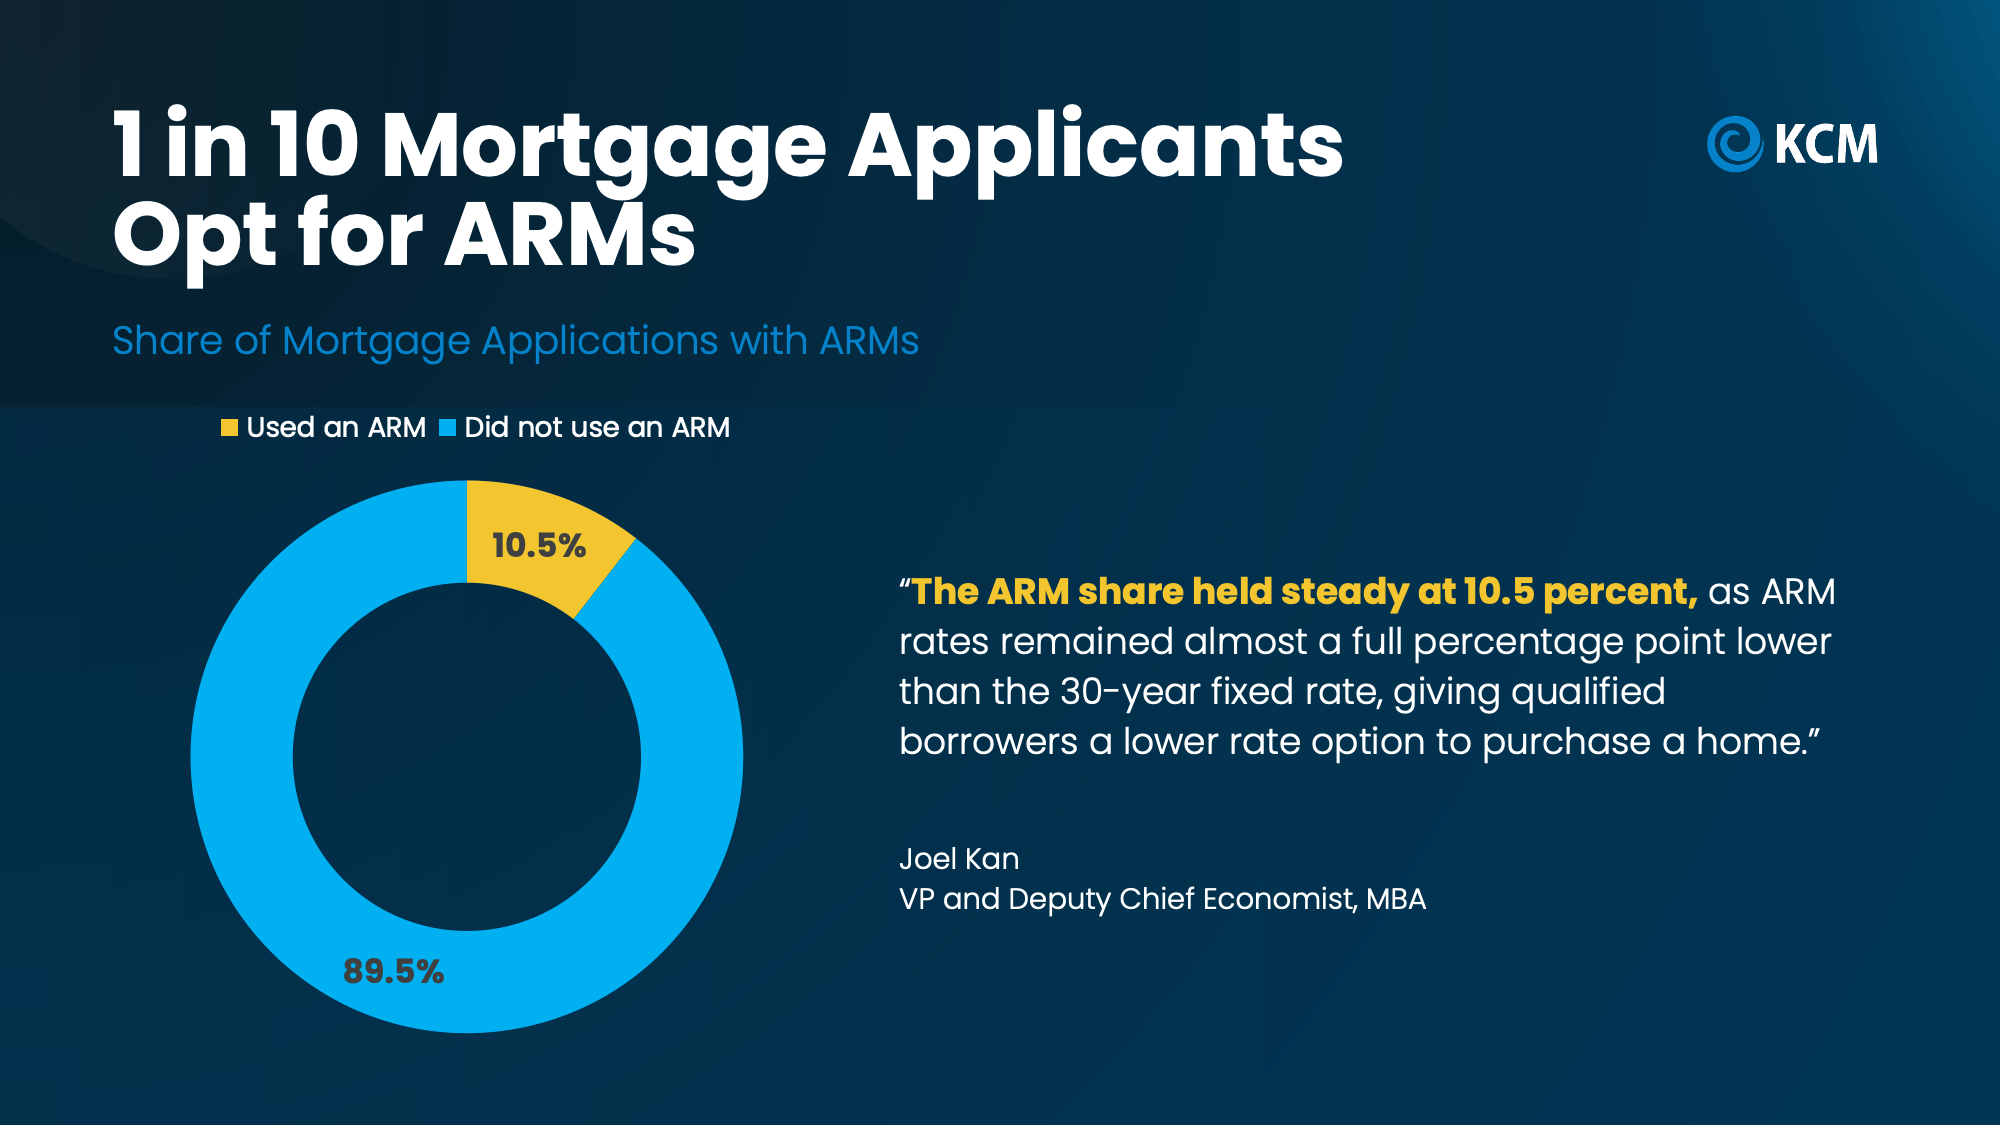
And for some buyers, that’s enough to turn “not right now” into “let’s do this.” You can see it in the numbers. Data from the Mortgage Bankers Association (MBA) shows that, in October, roughly 1 in 10 people applying for a mortgage chose an ARM (see graph below):
If you think you may want to consider this yourself, here’s what you need to know about how it works.
The 5/1 ARM
An ARM is like a phone or cable plan that has an introductory deal for new customers. You start out at a lower price, and then it adjusts after a specified amount of time. A popular loan is the 5/1 ARM.
The “5” means your introductory rate is locked for the first five years, and the “1” means that the rate can change every year after that. The rate change is called the “reset.” And here’s the really important part.
When your rate resets, your mortgage payment could go up or down. The good news is that most ARMs have caps, which are limits on how much your rate can rise each year and over the life of the loan. But either way, you have to be ready.
The Upsides and Potential Downsides
To see if this type of loan may be right for you, here are some things to think about and discuss with your loan officer:
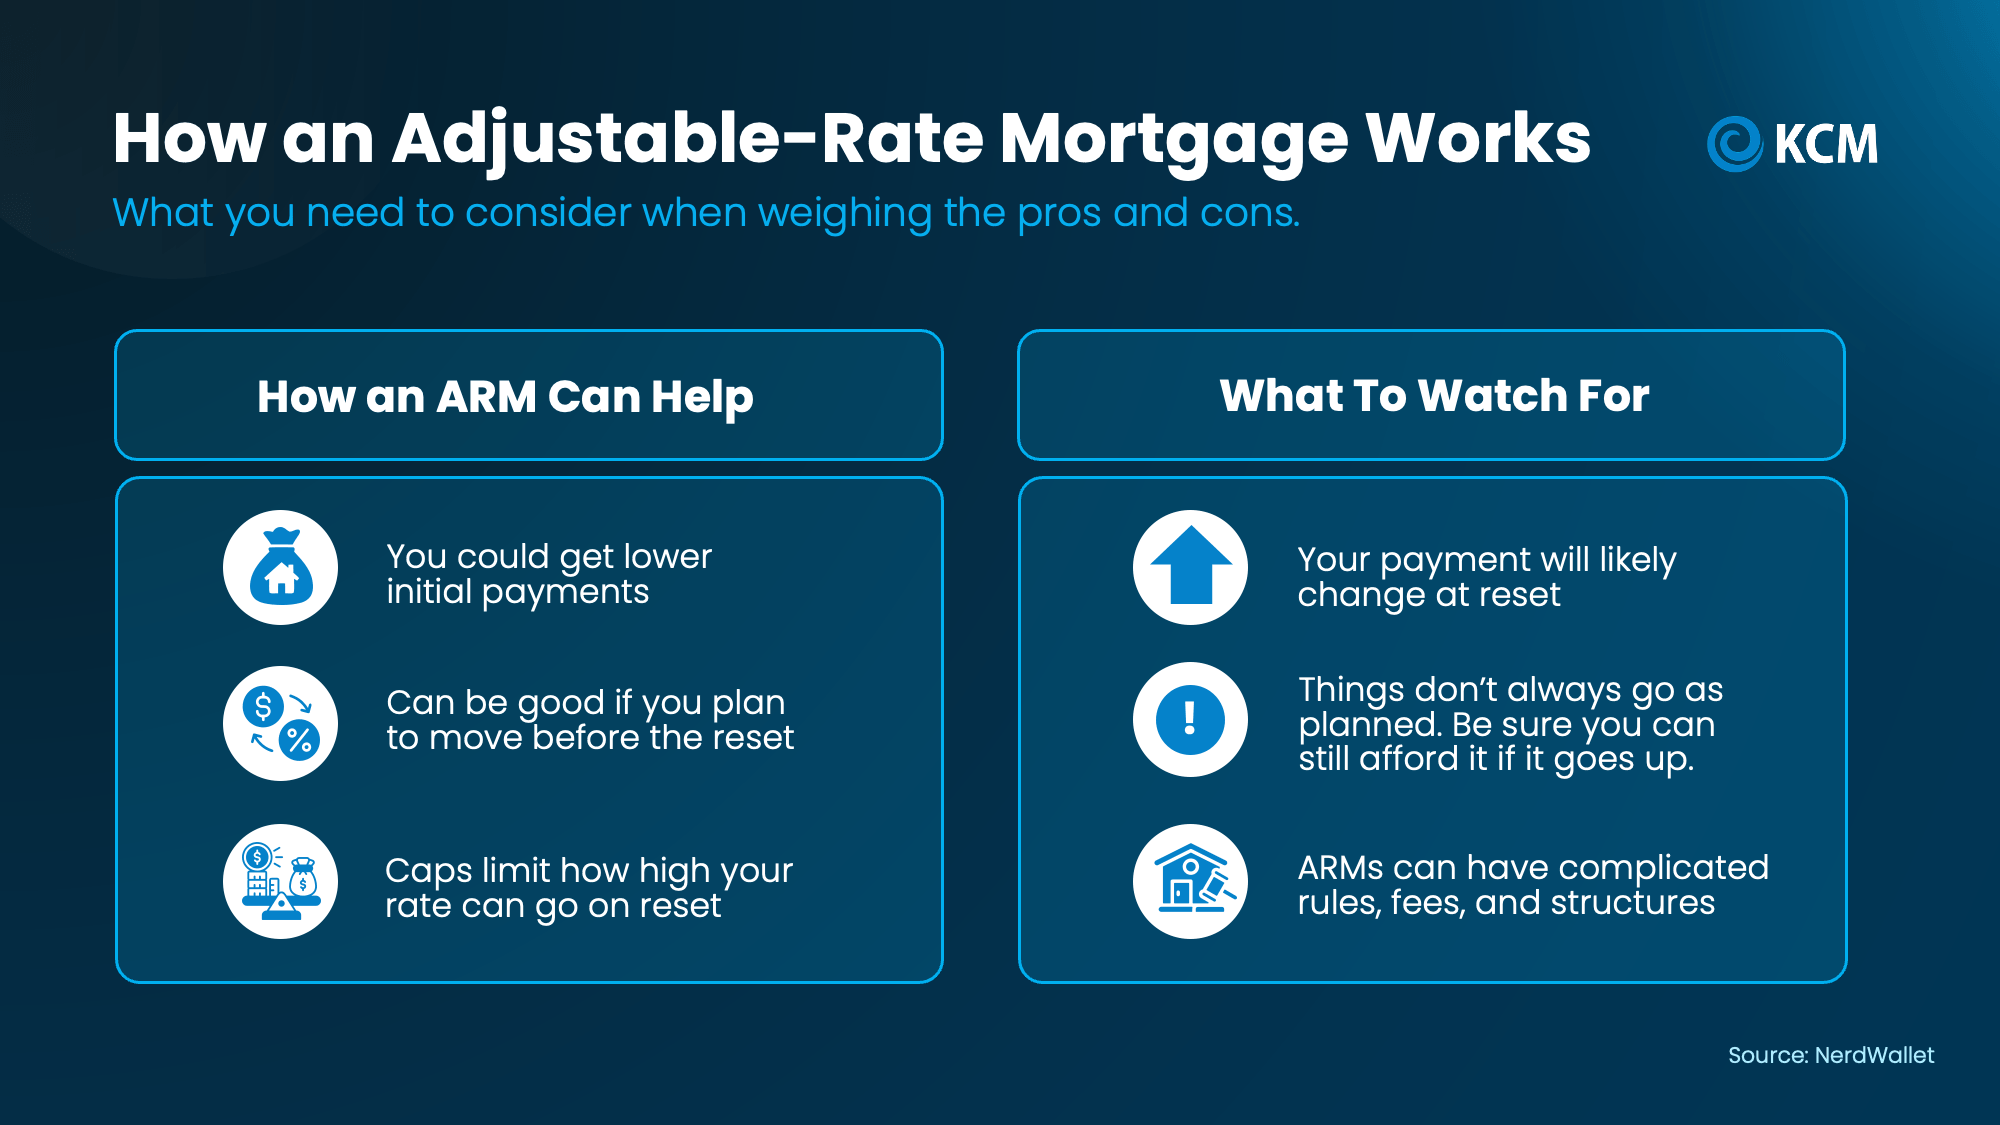
Before you decide, ask your lender to work up the numbers and walk you through the different potential scenarios you could run into with an ARM. That way, you go in with your eyes open.
Be Ready for the Reset
And, if you do go with an adjustable-rate mortgage, just know that you’ll have choices when the reset time arrives. You could:
-
Do nothing and keep your loan in place if the new payment still fits your budget.
-
Refinance into a fixed-rate loan with a payment that never changes.
-
Refinance into another ARM with a new lower rate locked for a specified timeframe.
-
Sell your home.
-
Talk to the loan servicer about assistance or modification.
Remember, a refinance is a brand-new loan that you’ll have to qualify for – even if it’s on a home you already own. So, keep tabs on your credit and debt levels and ask your loan officer how major financial moves like job changes and major purchases will affect your mortgage readiness. It’s important to keep your credit and finances in “mortgage shape.”
Today’s ARMs Aren’t Like 2008
One more quick note. ARMs got a bad name after the financial crisis of 2008. Back then, there were some risky loans with small starting payments that later shot way up. Others let people borrow without proving how much money they earned.
But now, there are new laws to protect both borrowers and lenders. The biggest change is the Ability-to-Repay Rule, which says that before a lender makes a home loan, it has to check real paperwork (like pay stubs, W-2 forms, and tax returns) to make sure you can afford it. The lender also has to look at what your payment could be after the reset, not just the low starting payment.
So, you don’t have to worry that today’s ARMs are the same as the ones we saw back during the crash.
Bottom Line
Today’s market has more options than many people realize. Finding the right one could be as simple as getting more information about tools like ARMs. A trusted lender can run the numbers with you, walk you through the what-ifs, and help you explore the possibilities.
Is an ARM a good option for you? Talk to a loan officer to find out.
Whether you own a house already or you’re looking to buy one, you probably care about home prices. But it’s not always easy to figure out what’s really happening right now, especially if you look at the headlines.
One says home prices are falling. The next says they’re still climbing.
So, which one’s right? It comes down to where you live.
What’s Really Going on with Asking Prices
Part of the confusion out there may be based on what’s happening to asking prices and how the media is talking about it. They’re calling attention to how asking prices are falling, but don’t give the full context or say that seasonality is at play. So here it is.
Right now, there are more homes on the market than at any other time since November 2019. And with mortgage rates rising since the spring, those homes are taking a little longer to sell. One way to help a home sell quickly in that environment is to have a lower asking price.
According to HousingWire Data, the median asking price is down from $449k in early August to $435k just 2 months later (see graph below):
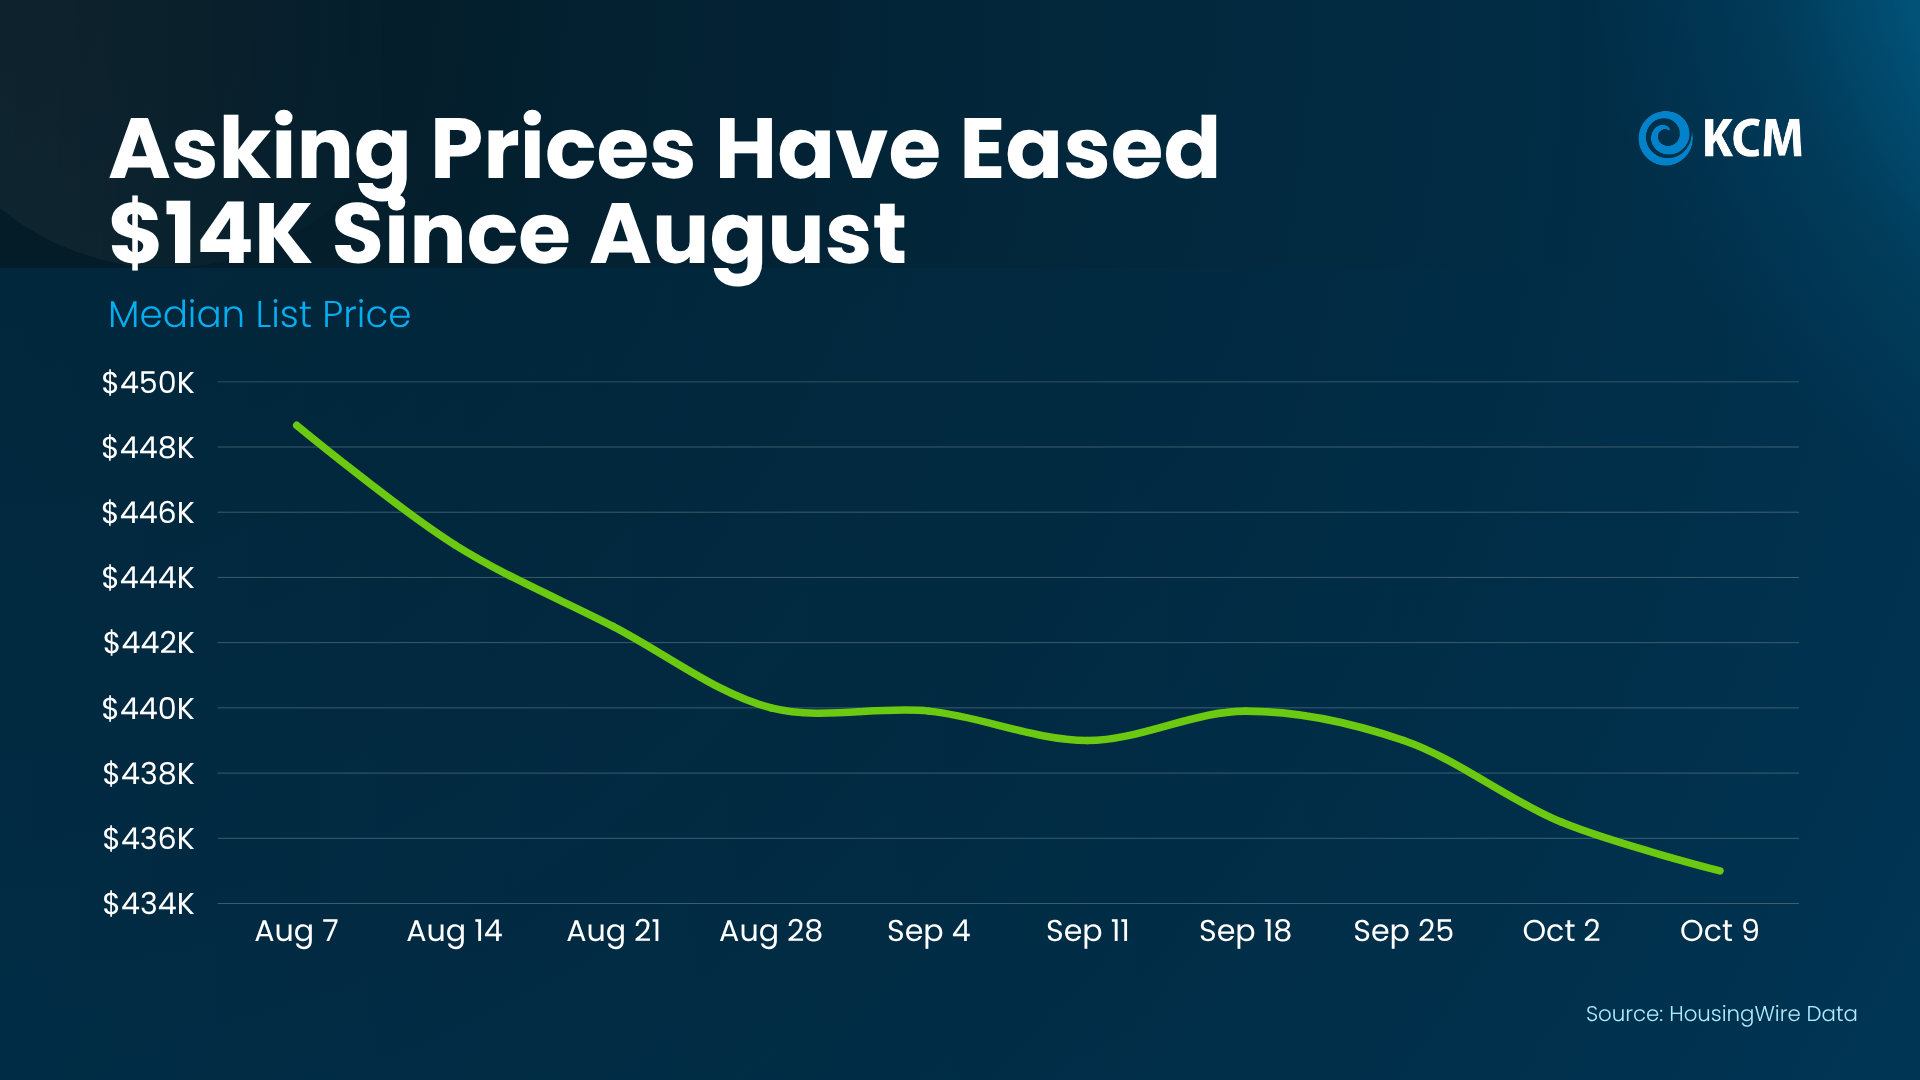
That’s a dip of about 3%, and a lot of it is normal for this time of year.
Asking prices cool off every fall once the busy summer season wraps up. With fewer buyers this time of year, sellers price a bit more competitively. Today’s rates play a role too, since sellers are pricing to match what buyers can afford right now. And that’s a good thing. Smart pricing helps homes sell.
Just keep in mind, that’s a national list price. It doesn’t show what homes near you are actually selling for. So before you react to a headline, ask a local agent what’s really happening in your area.
Where You Live Changes Everything
Realtor.com explains:
“While national headlines might suggest a buyer’s market is taking hold, the reality on the ground depends heavily on where and what you’re trying to buy. Local trends can diverge sharply from national averages, especially when you factor in price range, property type, and post-pandemic market dynamics.”
The latest numbers from S&P Cotality Case-Shiller Index show how true that is. Over the past year, sales prices in Chicago rose almost 7%. In Seattle, they dipped about 1.6%. That’s a gap of nearly 9 percentage points between two major cities (see graph below):
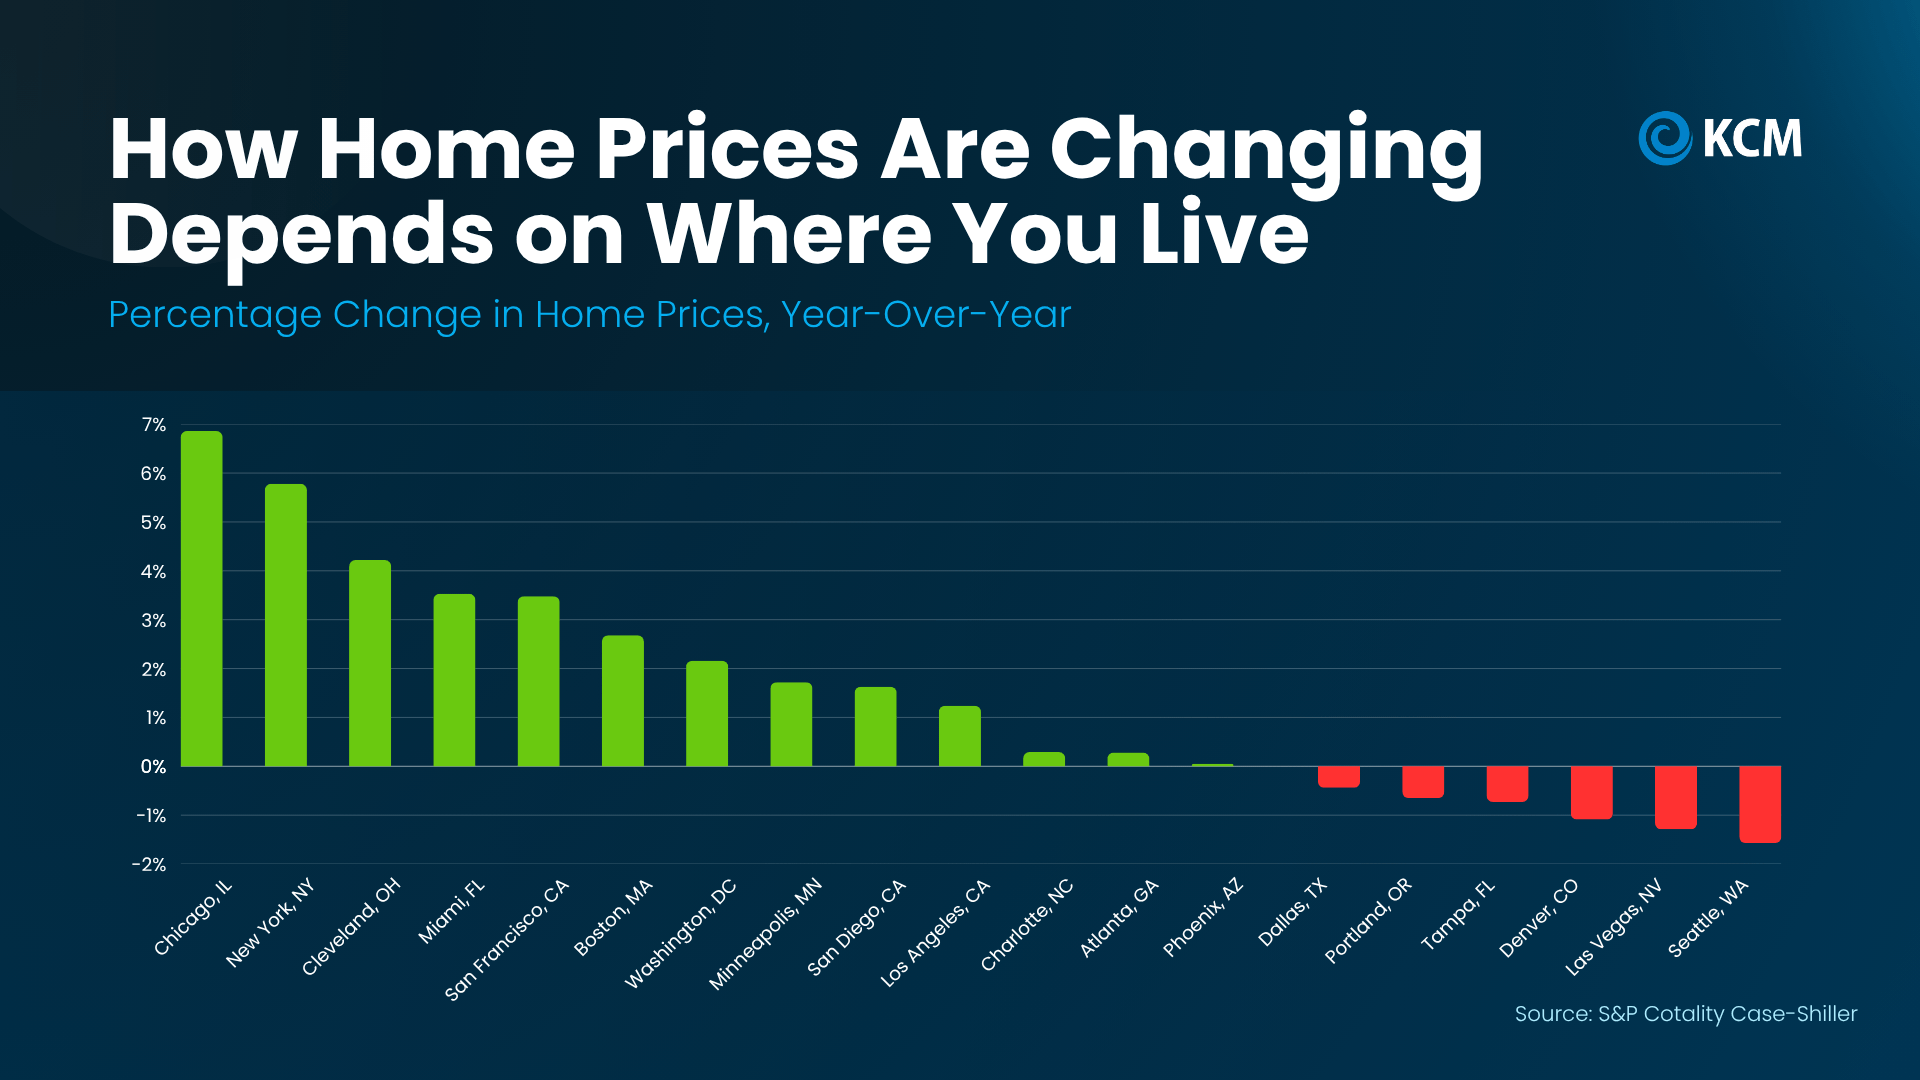
That gap changes your game plan. Selling in New York, where prices are up almost 6%? You may not need to cut your price. Buying in Denver or Las Vegas? You may have more room to negotiate.
Why You Don’t Need To Worry About a Crash
Just in case you’re seeing those slight declines in some markets and worried it means a bigger crash is coming, here’s what you need to remember. Even in the major metros where prices are down, the declines are 2% or less. That’s a long way from a crash like 2008. And if you look back at the graph above, there are more cities in the green than in the red.
And over time, home values have a strong track record. The Federal Housing Finance Agency (FHFA) says national prices have grown year-over-year every quarter since 2012. Go back further, and a $100k home bought in 1991 would be worth about $436k today, even with the 2008 crash factored in (see graph below):
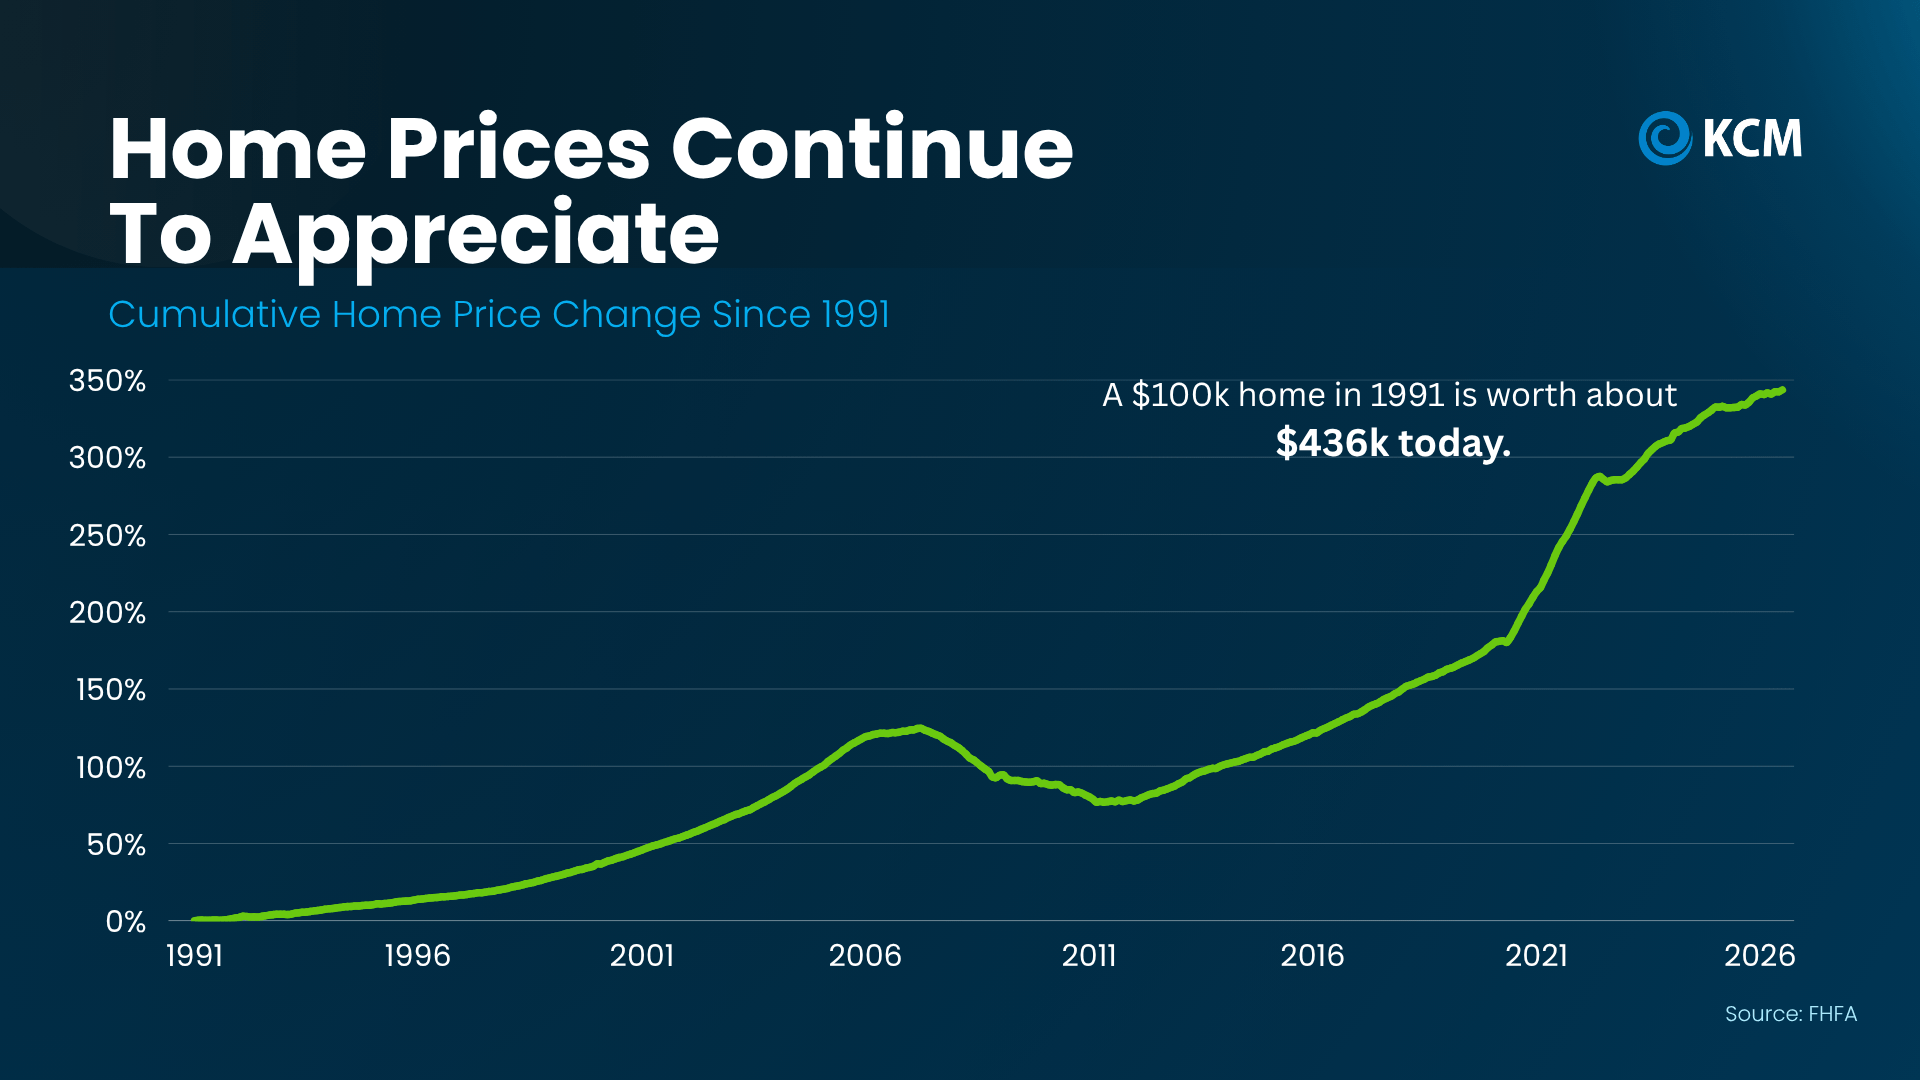
So, this short-term dip probably won’t stick around. The small declines we’re seeing now are in markets that overheated during the pandemic. As a whole, the market is headed back to normal – and normal means prices should rise over time.
Bottom Line
National headlines can’t tell you what your home is worth or how much room you have to negotiate. Local data can. If you’re thinking about buying or selling, connect with a local real estate agent to look at how prices are moving in your area, so you can set your price or make your offer with confidence.

Why Builders May Be More Motivated To Sell Than Homeowners

Why More Buyers Are Turning To Adjustable-Rate Mortgages Today

To Sell or Rent? How To Choose the Best Path for Your House.



-

 Buying Tips4 weeks ago
Hoping for (or Dreading) a Housing Crash? The Experts Just Weighed In.
-
 For Sellers4 weeks ago
What Higher Mortgage Rates Mean for Home Sellers
-
 Affordability4 weeks ago
The Mortgage Rate You See Online Isn’t Necessarily the One You’d Get.
-

 Downsize3 weeks ago
Renovate or Relocate? What To Know Before You Decide To Age in Place
-
 Affordability3 weeks ago
Two Moves That Can Get You Into Your First Home Sooner
-
 Affordability3 weeks ago
Myth vs. Reality: Does the Fed Control Mortgage Rates?
-

 Affordability2 weeks ago
Why Most People Are Still Glad They Bought a Home
-

 Buying Tips1 week ago
The Biggest Credit Hurdle for Renters Who Want To Buy
You must be logged in to post a comment Login