

Foreclosures
Foreclosure Activity Is Still Lower than the Norm
Have you seen headlines talking about the increase in foreclosures in today’s housing market? If so, they may leave you feeling a bit uneasy about what’s ahead. But remember, these clickbait titles don’t always give you the full story.
The truth is, if you compare the current numbers with what usually happens in the market, you’ll see there’s no need to worry.
Putting the Headlines into Perspective
The increase the media is calling attention to is misleading. That’s because they’re only comparing the most recent numbers to a time where foreclosures were at historic lows. And that’s making it sound like a bigger deal than it is.
In 2020 and 2021, the moratorium and forbearance program helped millions of homeowners stay in their homes, allowing them to get back on their feet during a very challenging period.
When the moratorium came to an end, there was an expected rise in foreclosures. But just because foreclosures are up doesn’t mean the housing market is in trouble.
Historical Data Shows There Isn’t a Wave of Foreclosures
Instead of comparing today’s numbers with the last few abnormal years, it’s better to compare to long-term trends – specifically to the housing crash – since that’s what people worry may happen again.
Take a look at the graph below. It uses foreclosure data from ATTOM, a property data provider, to show foreclosure activity has been consistently lower (shown in orange) since the crash in 2008 (shown in red):
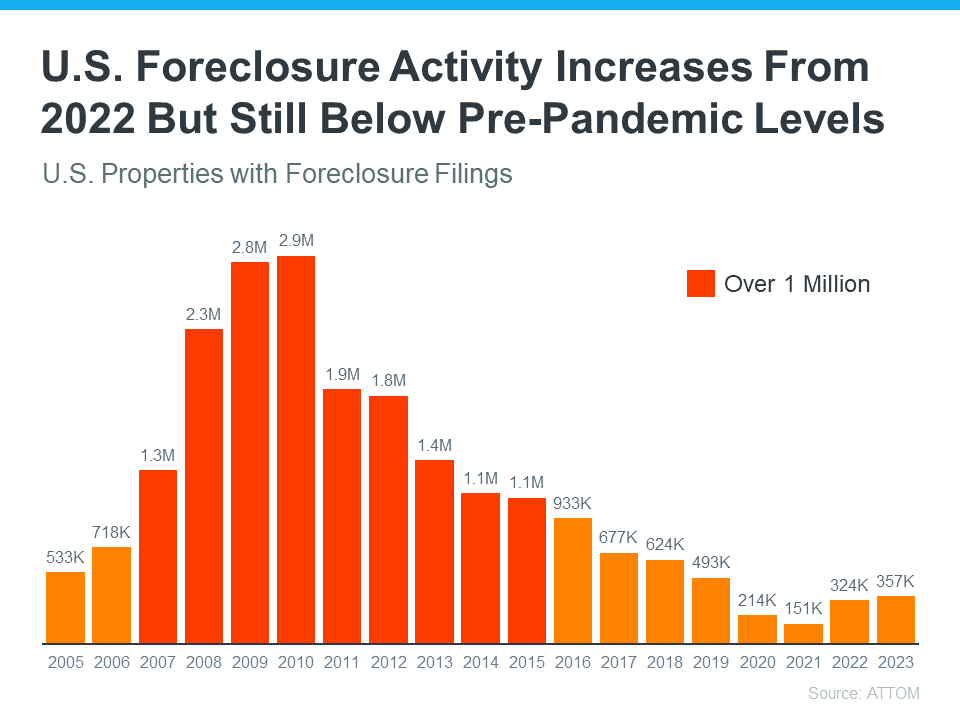
So, while foreclosure filings are up in the latest report, it’s clear this is nothing like it was back then.
In fact, we’re not even back at the levels we’d see in more normal years, like 2019. As Rick Sharga, Founder and CEO of the CJ Patrick Company, explains:
“Foreclosure activity is still only at about 60% of pre-pandemic levels. . .”
That’s largely because buyers today are more qualified and less likely to default on their loans. Delinquency rates are still low and most homeowners have enough equity to keep them from going into foreclosure. As Molly Boesel, Principal Economist at CoreLogic, says:
“U.S. mortgage delinquency rates remained healthy in October, with the overall delinquency rate unchanged from a year earlier and the serious delinquency rate remaining at a historic low… borrowers in later stages of delinquencies are finding alternatives to defaulting on their home loans.”
The reality is, while increasing, the data shows a foreclosure crisis is not where the market is today, or where it’s headed.
Bottom Line
Even though the housing market is experiencing an expected rise in foreclosures, it’s nowhere near the crisis levels seen when the housing bubble burst. If you have questions about what you’re hearing or reading about the housing market, connect with a real estate agent.

Foreclosures are ticking up. And that may make your mind jump straight to thoughts of 2008 – specifically to what happened to the market during the housing crash. So, let’s do exactly what your brain already wants to do, and see if there’s any connection there.
The simple truth is foreclosure filings are rising. But they’re nowhere near crisis levels. And that’s not where they’re headed either. Here’s why.
Take a look at serious delinquencies – loans where the homeowner is more than 90 days late on their mortgage payments.
While those have increased slightly, data from the New York Fed shows they still remain low. And they aren’t anywhere close to levels seen when the market crashed (see graph below):
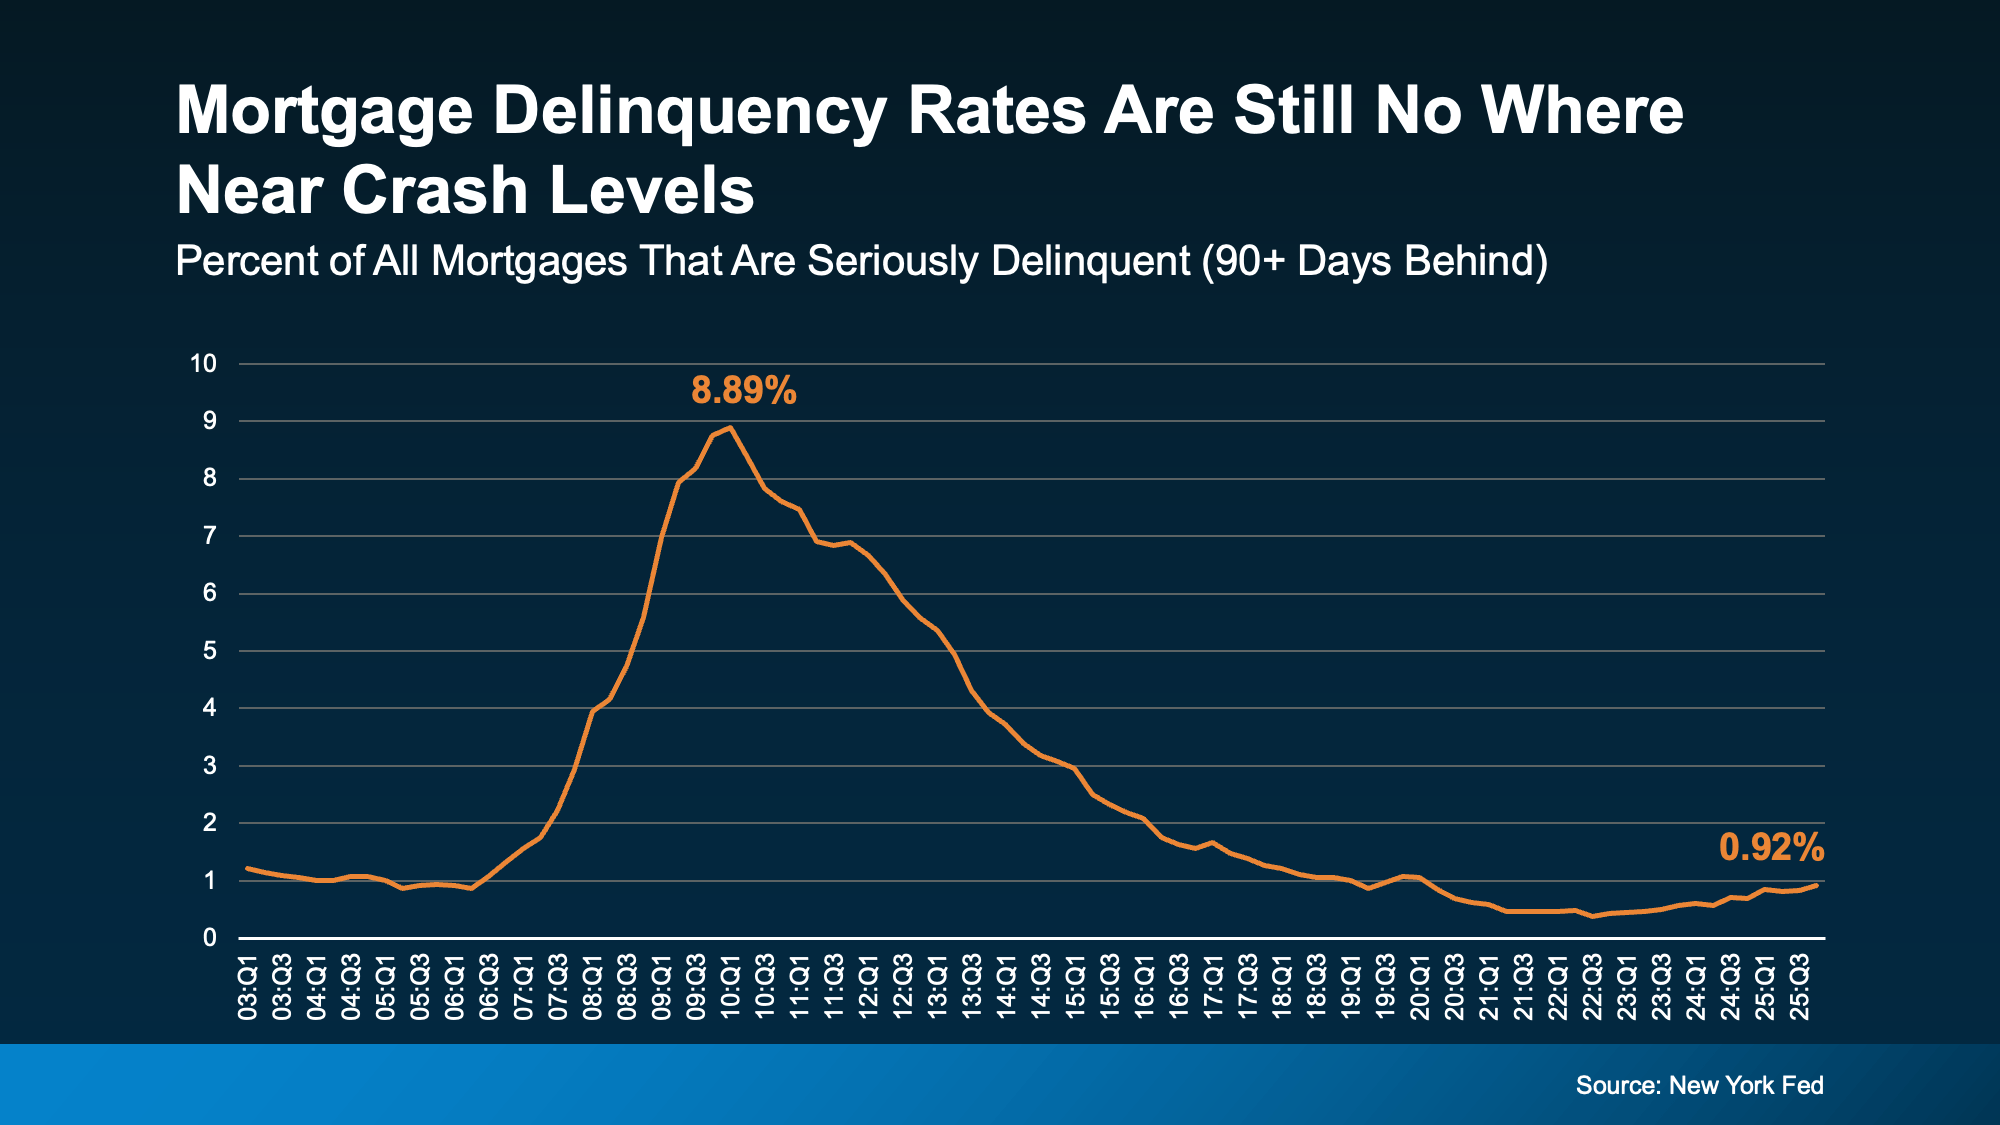 Right now, about 1% of mortgages are seriously delinquent. That’s only 1 in 100.
In the years around the crash, they were up around 9%. That’s 1 in 11.
That’s a big difference.
And it’s important to remember not all delinquencies even become foreclosure filings. Some homeowners who are falling behind will work out repayment plans with their banks and lenders because banks don’t want to see a wave of foreclosures either.
That’s why foreclosure numbers are even lower than delinquencies. ATTOM shows only 0.3% of all homes are currently going through a foreclosure filing. And those won’t even all go to a full foreclosure. That’s not a wave. That’s a ripple at most.
If People Are Falling Behind on Payments, Why Aren’t There Even More Foreclosures?
And maybe you’re wondering, if people are struggling financially, why aren’t there more foreclosures? Here’s the easiest way to answer that.
When households feel financial pressure, they tend to prioritize their mortgage payment above almost everything else. Because the last thing they want to lose is their home.
Data from the New York Fed shows serious delinquencies have risen more for credit cards and auto loans (the blue and green lines). But mortgage delinquencies and home equity lines of credit (borrowing against the value of your home) aren’t seeing the same big uptick (the yellow and orange lines). They’re a lot more stable overall.
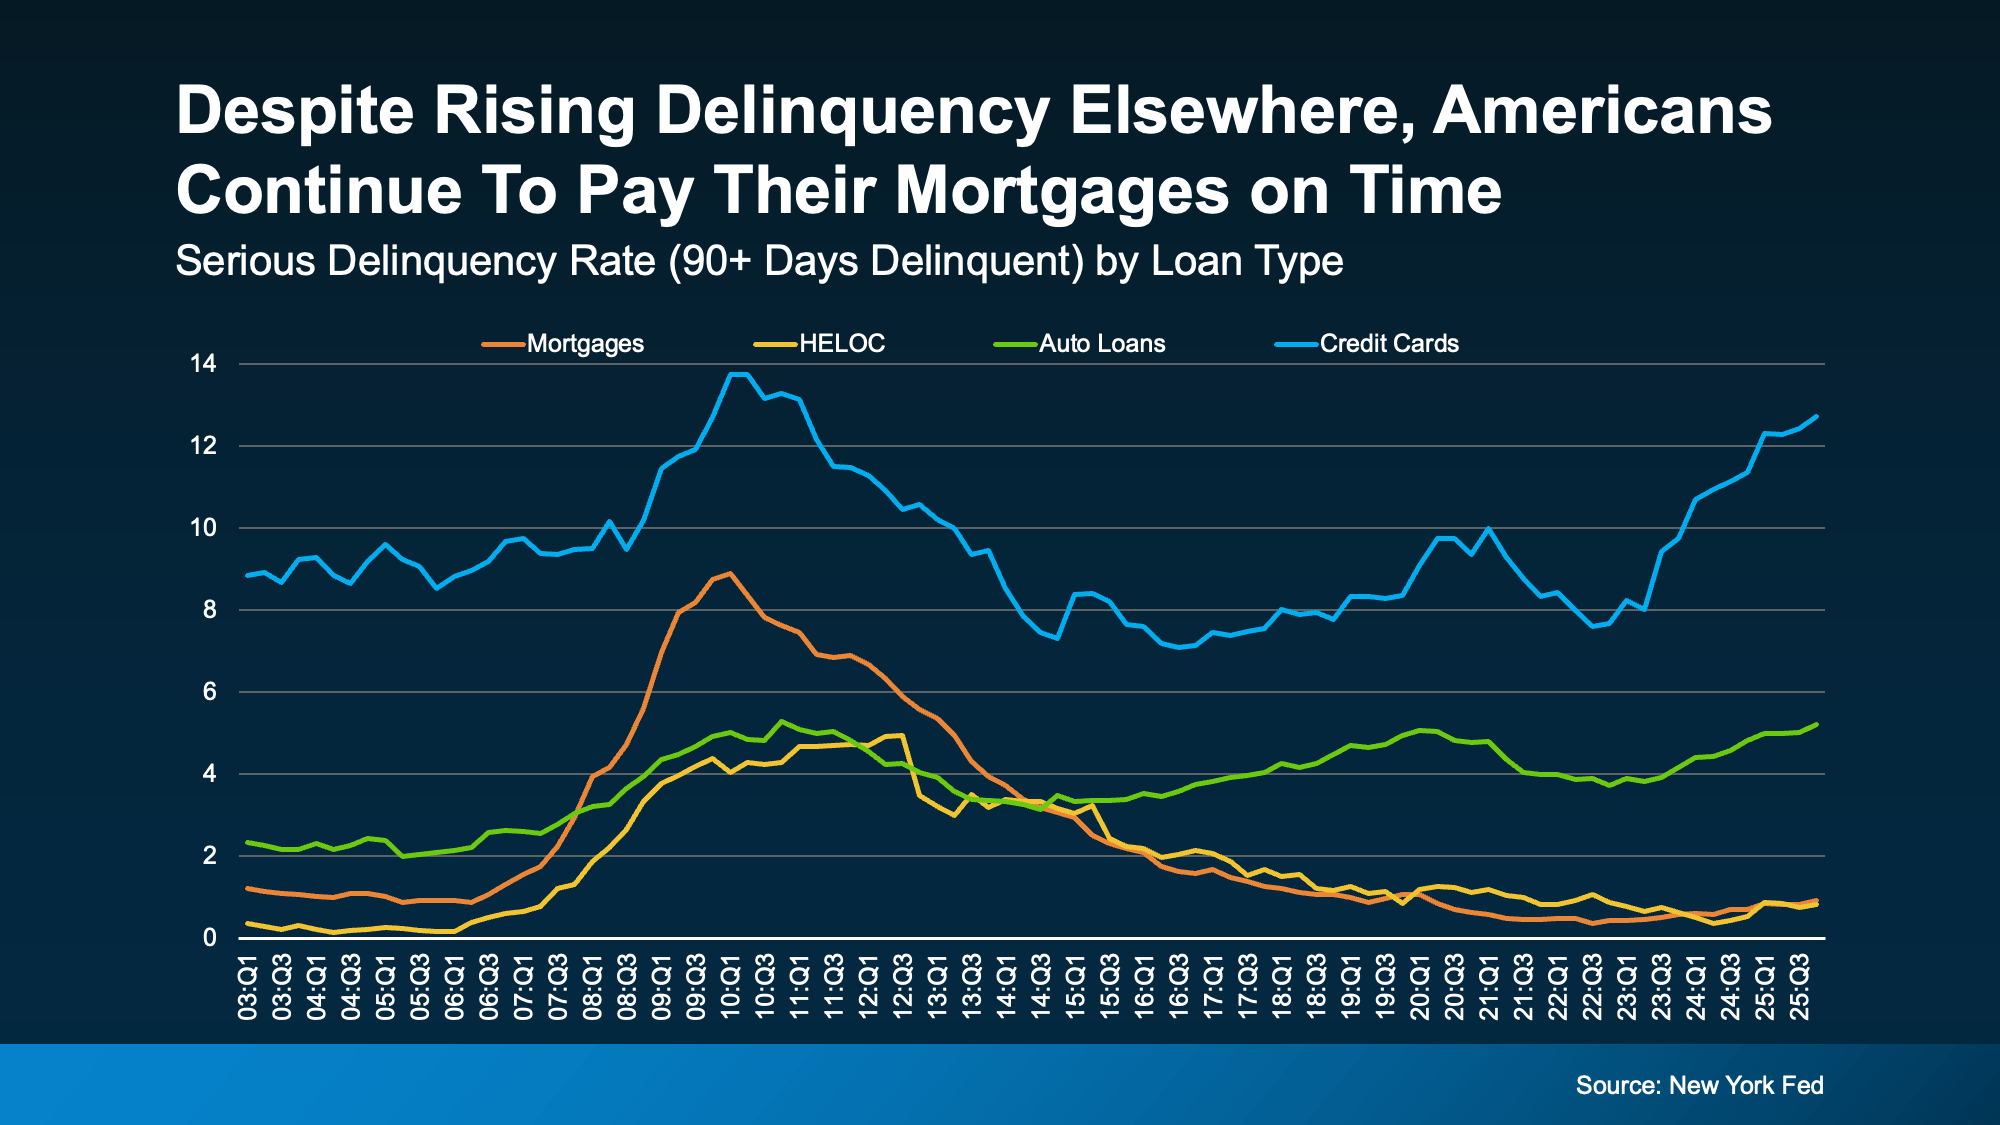 In other words, people may fall behind on other debts, but they fight hard to keep their homes. And, in today’s housing market, they’re also in a strong equity position to do so.
Home Equity Changes Everything
Many people have built significant equity over the past several years. And that creates options. As Daren Blomquist, VP of Market Economics at Auction.com, explains:
“Distressed homeowners… many times they still have equity in their homes. There’s an opportunity for them to sell that home, avoid foreclosure, and walk away with equity.”
That’s a major difference from 2008. Back then, many homeowners owed more than their homes were worth. And selling wasn’t an easy solution. Today, for many people, it is. And even in situations where equity isn’t enough, homeowners are encouraged to contact their loan servicer early to explore alternatives to foreclosure.
Bottom Line
Are foreclosure filings rising slightly? Yes. Are they anywhere near crash territory? No. And homeowners today have far more equity and flexibility than they did during the crash.
If you’re concerned about what you’re seeing in the headlines, the best move isn’t panic, it’s perspective. And the data right now says this isn’t 2008 all over again.

If you’ve seen headlines saying foreclosure activity has been climbing for 10 straight months, it’s easy to assume that’s a sign of trouble for the housing market. But when you look at the full picture, a few simple truths become clear:
- Today’s foreclosure numbers are in line with what’s considered normal
- High home equity is keeping most homeowners in a strong financial position
- None of the data points to a big wave of distressed sales that’ll crash the market
Foreclosure Filings Are Up 32%, But That Doesn’t Mean the Market’s in Trouble
If you peel the layers all the way back, what everyone is actually worried about is that we’re headed for a repeat of what happened in 2008. Back then, riskier lending practices and an oversupply of homes for sale brought home prices down and led to a significant increase in foreclosures. A lot of people felt the impact. But this isn’t the same situation.
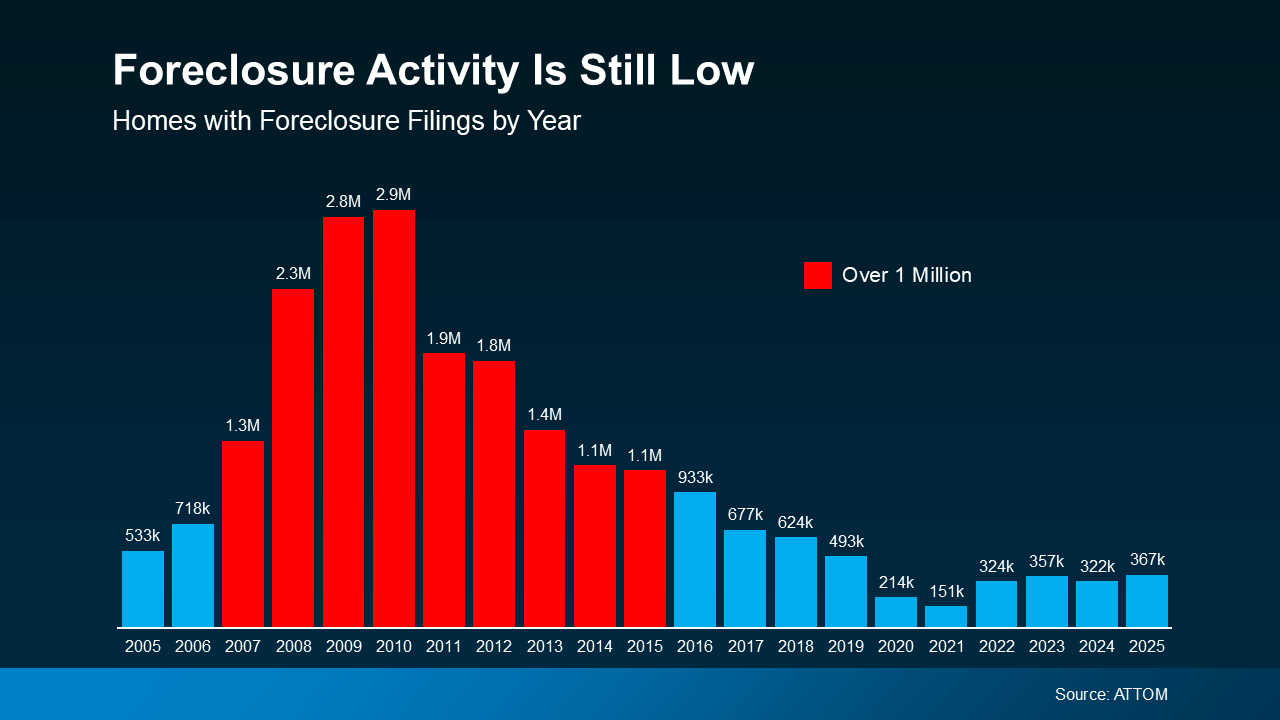
Yes, ATTOM data shows foreclosure filings are up 32% year-over-year. And that increase is going to sound dramatic. But context matters, and it doesn’t mean we’re headed for another crash. And the numbers prove it. Take a look at where we were during the last crash (the red in the graph below). And where we are now (the blue):
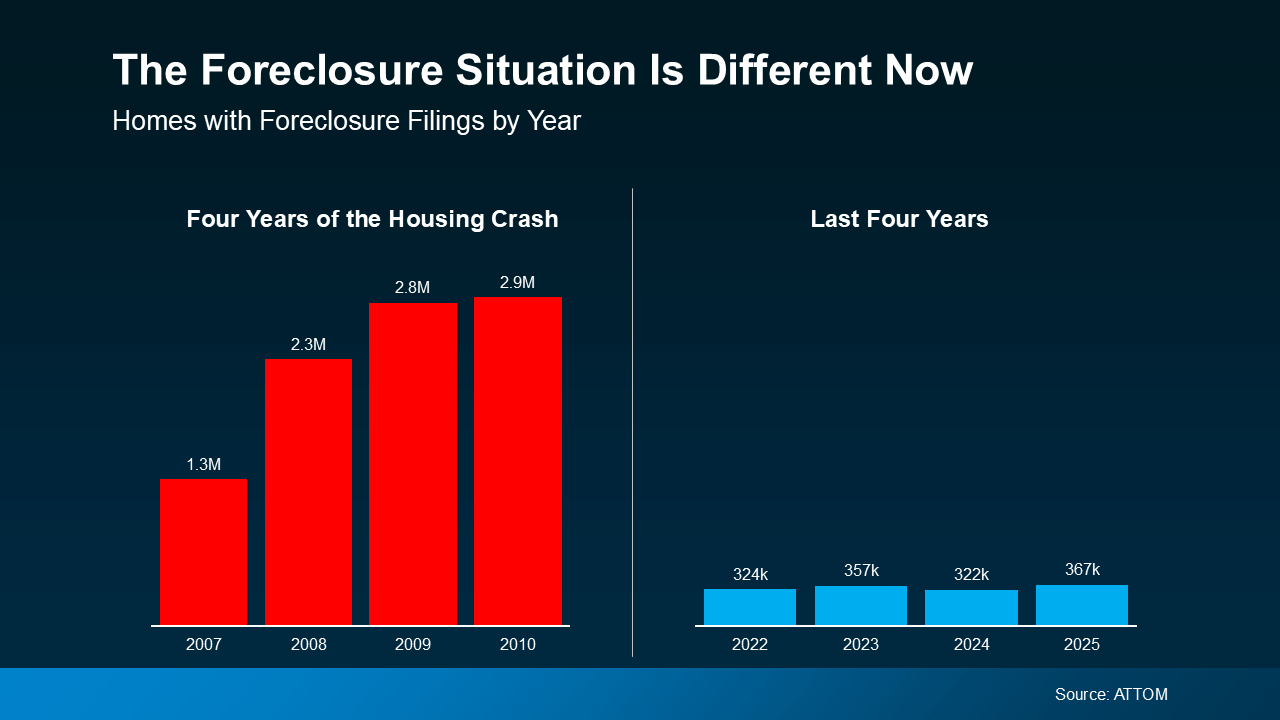 Even with the uptick lately, we are still nowhere near crash levels – far from it. This isn’t a return to crisis levels. What it is, is a return to normal.
The graph below shows foreclosure filings going all the way back to early 2005. The lead up to, and the aftermath of, the crash is there in red. Those are the years when foreclosure filings went above the 1 million mark each year.
Now, look at the right side and scan back to the 2017–2019 range (the last truly normal years for housing). You’ll see we’re actually just starting to fall back in line with what’s typical for the market, even with the increase lately:
 Rob Barber, CEO at ATTOM, explains it well:
“Foreclosure activity increased in 2025, reflecting a continued normalization of the housing market following several years of historically low levels . . . While filings, starts, and repossessions all rose compared to 2024, foreclosure activity remains well below pre-pandemic norms and a fraction of what we saw during the last housing crisis . . . today’s uptick is being driven more by market recalibration than widespread homeowner distress, with strong equity positions and more disciplined lending continuing to limit risk.”
The word “normalization” in that quote is extra important. While economic and financial pressures are putting a strain on some homeowners, this isn’t a flood of distressed homes. No matter what the headlines may have you believe, this isn’t a large-scale crisis.
Today’s increase isn’t a sign of trouble. It’s a return to normal.
Why This Isn’t a Repeat of 2008
Even though the last housing crash still shapes how a lot of people interpret today’s news, the reality is, this is a different market:
- Lending standards are stronger
- Borrowers are more qualified
- And homeowners have far more equity
And that equity piece is especially important. Over the last five years, home prices have risen significantly. For many people, their house is worth far more than they paid for it. That means most homeowners have a strong financial cushion to fall back on, if needed.
Basically, if someone faces hardship today, they often have the option to sell, and maybe even walk away with money in their pocket, instead of going through foreclosure. That’s a major contrast to 2008, when many homeowners owed more than their home was worth.
Bottom Line
Foreclosure activity may be rising, but it’s still well within a normal range – and nowhere close to the danger zones of the past. But the headlines are doing more to terrify than clarify. And that’s exactly why having a trusted real estate expert you can call on is so important.
When you hear something in the news or see something on social about housing that worries you, reach out to a local agent. An expert will have the context needed to explain what’s really happening and how it impacts you (if at all).

You may be seeing headlines about how foreclosures are rising. And if that makes you nervous that we’re headed for another crash, here’s what you should know.
According to ATTOM, during the housing crash, over nine million people went through some sort of distressed sale (2007-2011). Last year, there were just over 300,000.
So, even with the increase lately, we’re talking about numbers that are dramatically lower. But what does the future hold? Is a wave coming? The short answer is, no.
Here’s why. Experts in the industry look at mortgage delinquencies (loans that are more than 30 days past due) as an early sign for potential foreclosures down the line. And the latest data for delinquencies is reassuring about the market overall.
Right now, delinquencies as a whole are consistent with where we ended last year, which means we’re not seeing the kind of increase that would signal widespread trouble.
But there are some key indicators to continue to watch. Marina Walsh, Vice President of Industry Analysis at the Mortgage Bankers Association, explains:
“While overall mortgage delinquencies are relatively flat compared to last year, the composition has changed.”
Right now, borrowers with FHA mortgages currently make up the biggest share of new delinquencies (see graph below):
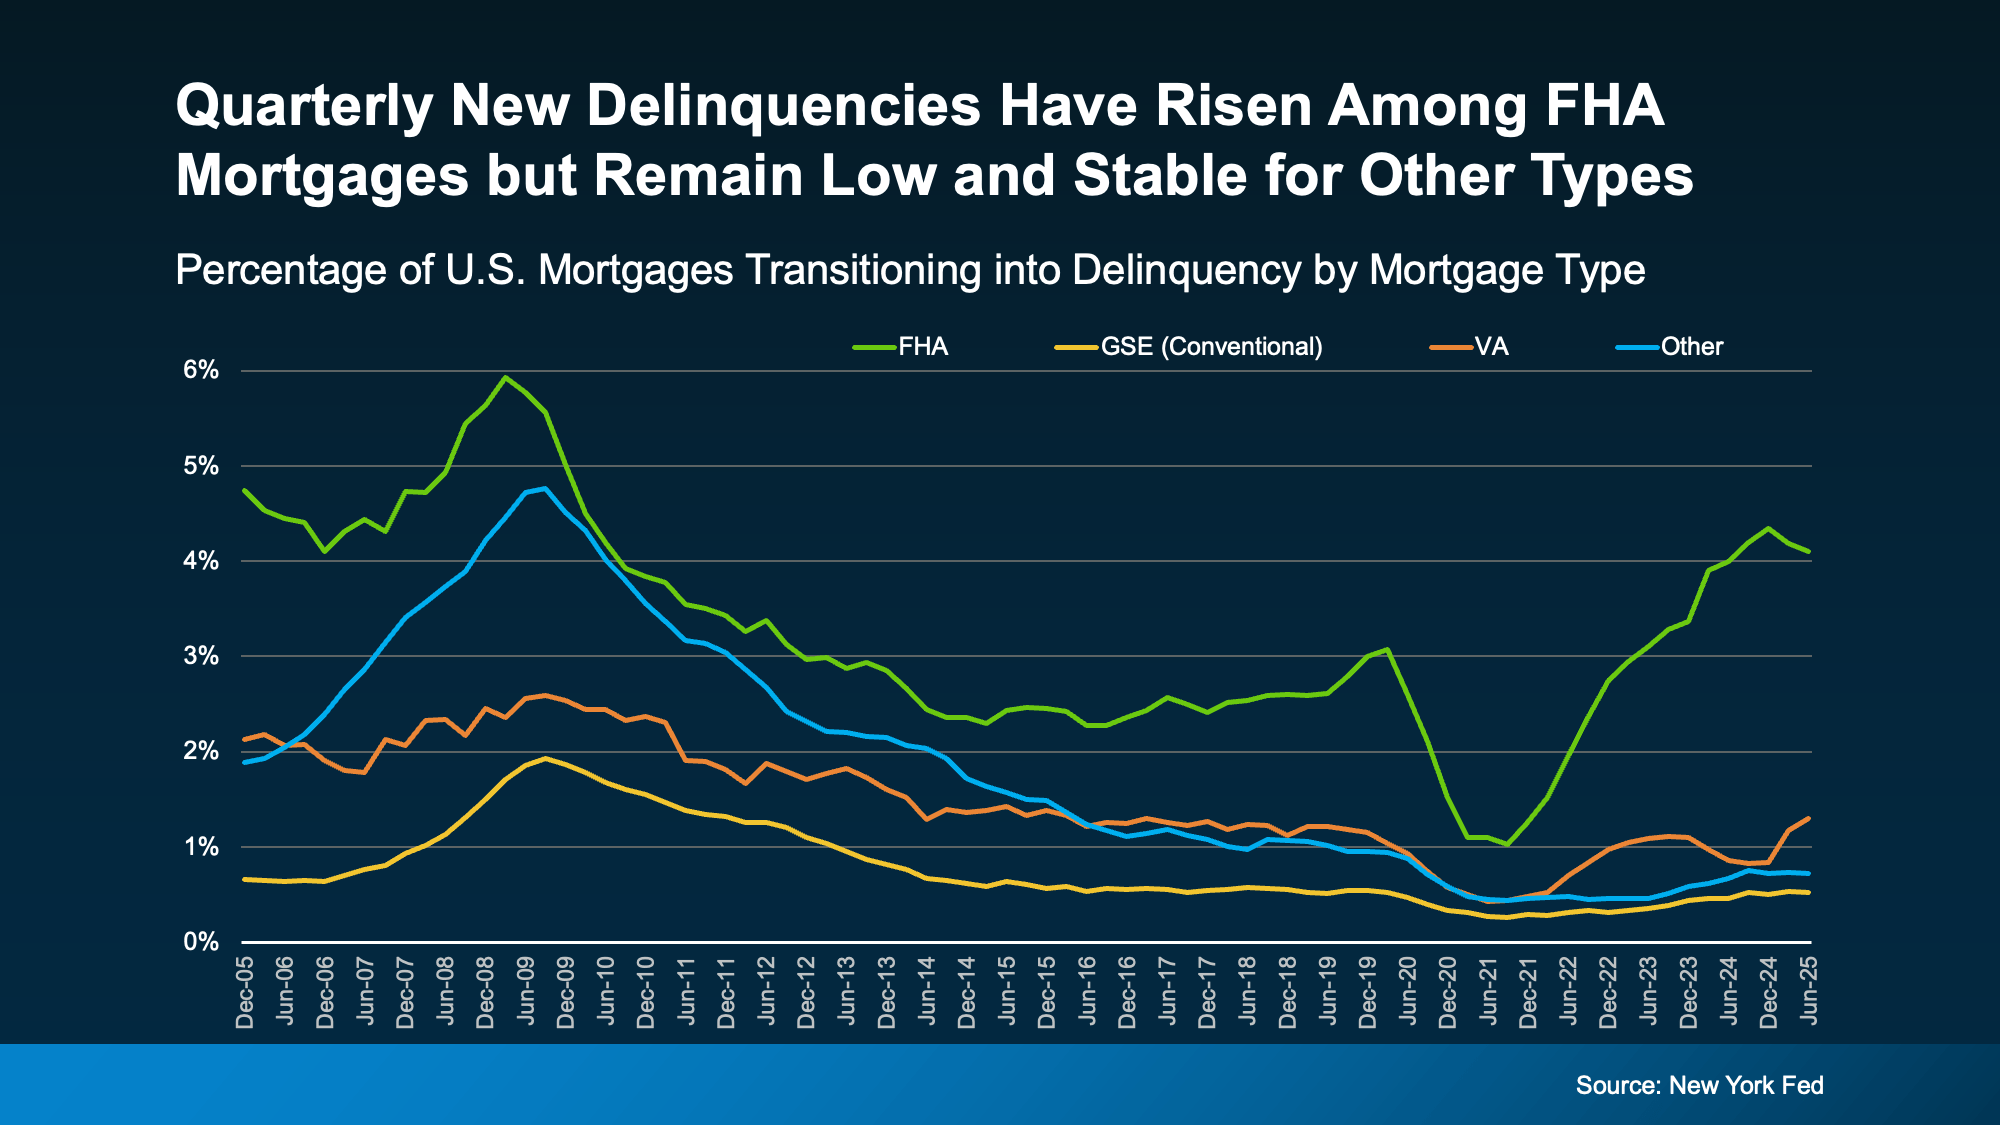 And here’s why that may be happening. Borrowers with FHA mortgages may be more sensitive to shifts in the economy. And with recession fears, stubborn inflation, employment challenges, and more, it makes sense this segment of the market may be feeling it a bit more. But that doesn’t mean it’s a signal a crash is coming.
If you look back at the graph, it shows, while there are more FHA loans experiencing hardship than the norm, delinquency rates for other loan types remain low and stable. Back during the crash, delinquency rates were significantly elevated for all 4 categories.
That means the broader mortgage market is on much stronger footing than it was back in 2008. As ResiClub says:
“The recent uptick in mortgage delinquency seems to be concentrated among FHA borrowers, however, mortgage performance remains very solid when viewed in light of the twenty-year history of our data.”
The Region with the Most FHA Loans
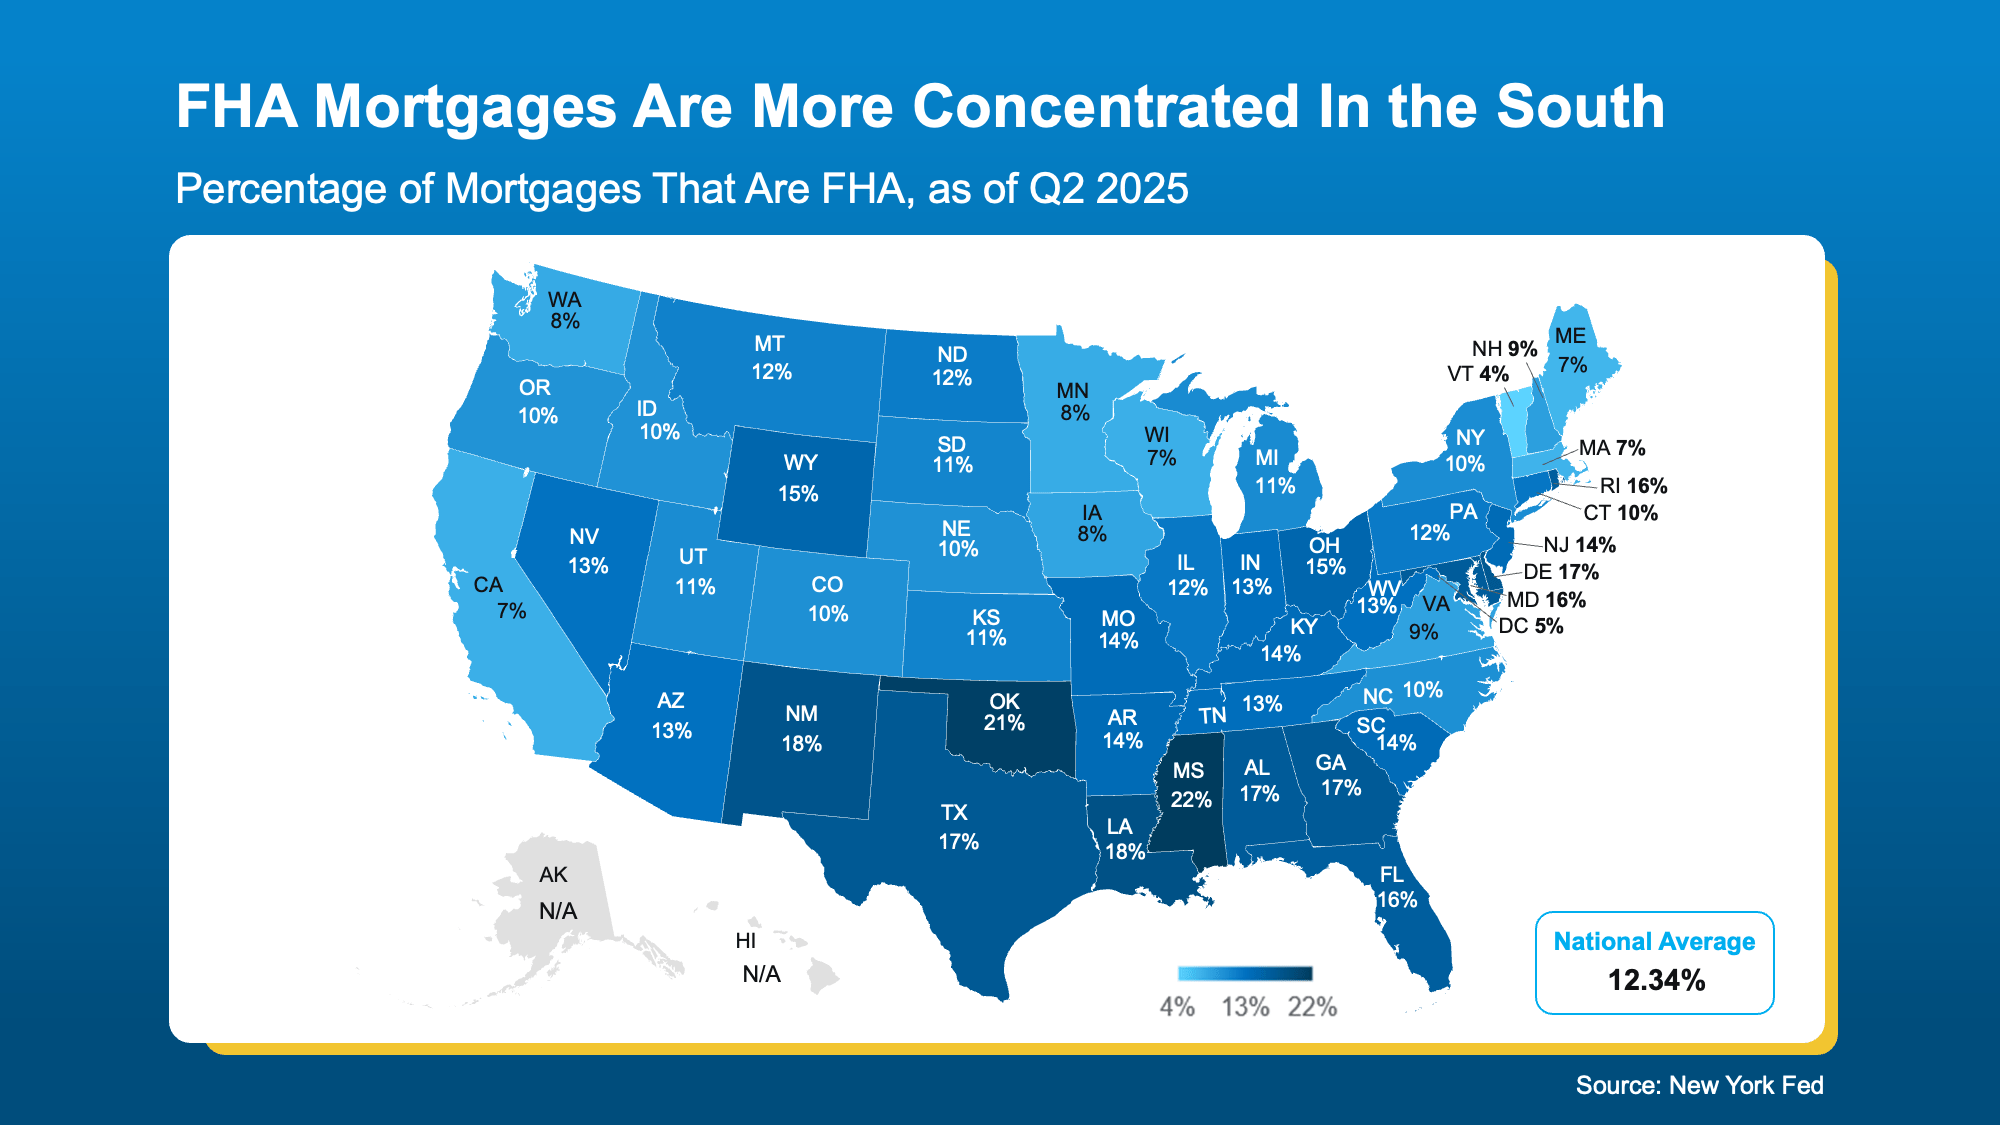
Here’s another reason this isn’t a signal of trouble ahead. FHA loans only make up about 12% of all home loans nationwide. But like anything else in housing, local data matters. There are some regions of the country where there are more of this type of loan than others, particularly the South.
The map below does not show how many FHA loans are delinquent. It just shows the overall concentration of FHA loans by state, so you can see which regions have the greatest volume (see map below):
 As the Federal Reserve Bank of New York explains:
“Looking at geographic concentrations of loans, recent data indicate that a higher proportion of mortgage balances are delinquent in many of the southern states . . . we see that higher delinquency rates coincide with a higher share of FHA loans across states.”
Just remember, even the delinquencies rates we’re seeing now aren’t as high as they were in 2008. Again, this is not a signal of a crisis. But it is something experts will monitor in the months ahead.
If You’re Experiencing Financial Hardship
No one wants to see anyone face the challenges of foreclosure. But just know that, if you’re a homeowner struggling with payments, you’re not alone – and you do have options.
The first step is reaching out to your mortgage provider. In many cases, you may be able to set up a repayment plan or explore loan modifications to help you stay on track. And for many homeowners today, you may also have enough equity to sell your house and avoid foreclosure. Odds are, at least some of these delinquencies will go that route since homeowners today have near record amounts of equity in their homes. It may be worth seeing if that could be an option for you too.
Bottom Line
Foreclosures are rising slightly, but they’re nowhere near the levels of 2008. And delinquency trends don’t point to a crash ahead.
This is something industry professionals are going to watch in the days ahead. If you want to stay up to date, connect with an agent or lender so you always have the latest information.

The Secret To Selling Fast, No Matter the Market

4 Ways To Give Your Offer an Edge This Spring

Is Late May the Best Time To List Your House?


-

 Affordability4 weeks ago
When Buying a Home Feels Out of Reach, Some Families Do This Instead
-

 Buying Tips4 weeks ago
Thinking About an Adjustable-Rate Mortgage? Here’s What You Need To Know.
-

 Agent Value21 hours ago
Stay or Sell? How To Make the Right Call as You Age
-

 Affordability21 hours ago
Think You Have To Put 20% Down? Most First-Time Homebuyers Don’t.
-

 For Buyers21 hours ago
More Options Are Popping Up This Spring
-

 Affordability21 hours ago
The 10 Best Markets for First-Time Buyers This Spring
-

 Featured21 hours ago
3 Things That Are Not Going To Happen in Today’s Housing Market
-

 Equity21 hours ago
Rent or Buy? The Real Tradeoff Most People Don’t Talk About
You must be logged in to post a comment Login