

Equity
What Every Homeowner Should Know About Their Equity
Curious about selling your home? Understanding how much equity you have is the first step to unlocking what you can afford when you move. And since home prices rose so much over the past few years, most people have much more equity than they may realize.
Here’s a deeper look at what you need to know if you’re ready to cash in on your investment and put your equity toward your next home.
Home Equity: What Is It and How Much Do You Have?
Home equity is the difference between how much your house is worth and how much you still owe on your mortgage. For example, if your house is worth $400,000 and you only owe $200,000 on your mortgage, your equity would be $200,000.
Recent data from the Census and ATTOM shows Americans have significant equity right now. In fact, more than two out of three homeowners have either completely paid off their mortgages (shown in green in the chart below) or have at least 50% equity in their homes (shown in blue in the chart below):
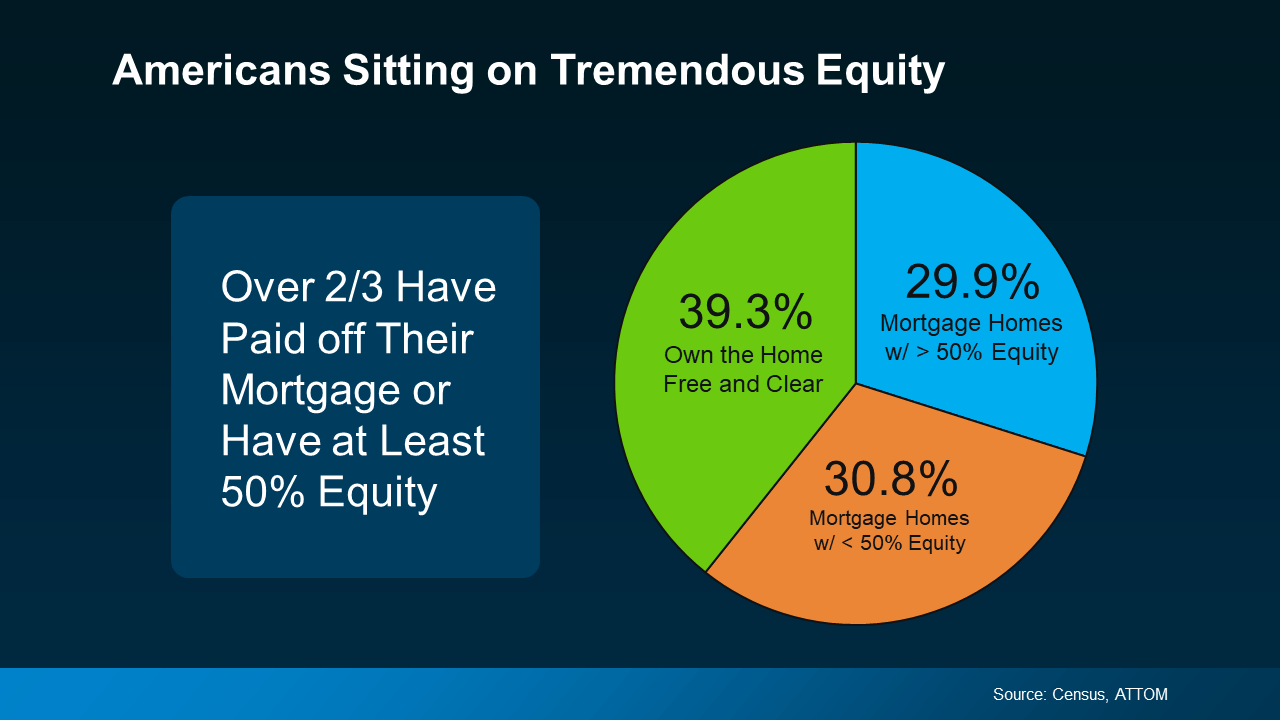 Today, more homeowners are getting a larger return on their homeownership investments when they sell. And if you have that much equity, it can be a powerful force to fuel your next move.
What You Should Do Next
If you’re thinking about selling your house, it’s important to know how much equity you have, as well as what that means for your home sale and your potential earnings. The best way to get a clear picture is to work with your agent, while also talking to a tax professional or financial advisor. A team of experts can help you understand your specific situation and guide you forward.
Bottom Line
Home prices have gone up, which means your equity probably has too. Connect with a local real estate agent so you can find out how much equity you have in your home and move forward confidently when you sell.

Remember how exciting it was to buy your first place? It felt like crossing a long-awaited finish line. It gave you a place to build your life. Maybe it’s where you lived when you got married. Or where you welcomed a child or a pet into the family.
But that was just the beginning.
For most people, your first house was never meant to be your forever home. It’s a stepping stone for what comes next.
And if your life looks different today than it did when you got the keys, you’re not stuck. Moving may be more realistic than you think.
Starter Home Inventory Is Still Relatively Low
If you’ve been wondering whether now is the right time to move up, here’s something worth knowing. Starter homes remain one of the hardest types of homes to find. And that’s good news if you’re thinking about selling your first place.
Historically, we haven’t been building enough homes for first-time buyers. And even though homebuilders have shifted more attention toward smaller, entry-level homes lately, the Census shows there’s a long way to go to re-build supply (see graph below):
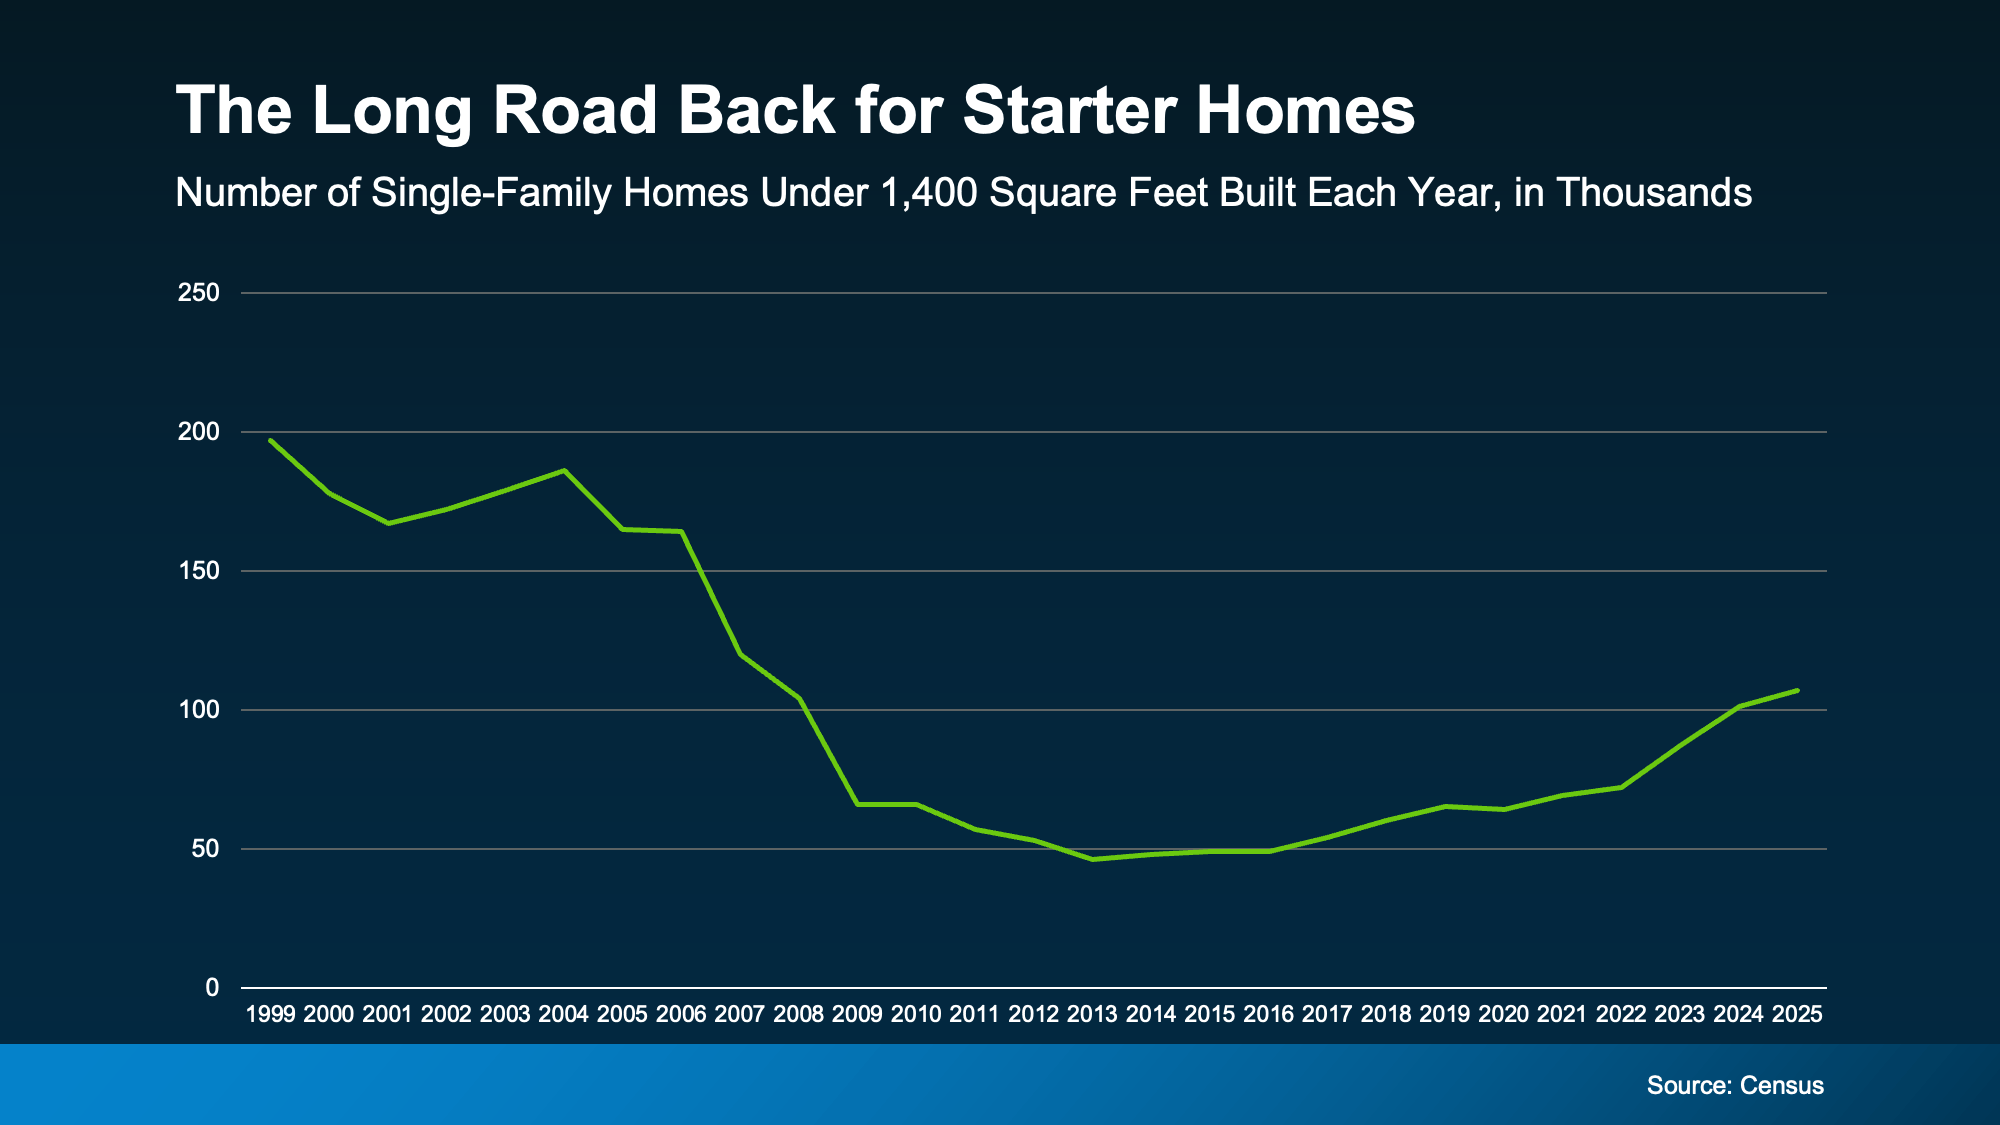
That means your current house is in demand – and that’s a dream scenario for sellers. But that’s only half the story. You also need somewhere to go.
There Are More Move-Up Homes on the Market
Here’s where this gets interesting. While the supply of starter homes remains tight (the green line), data from Redfin shows that the number of homes for sale has been climbing overall (the blue line):
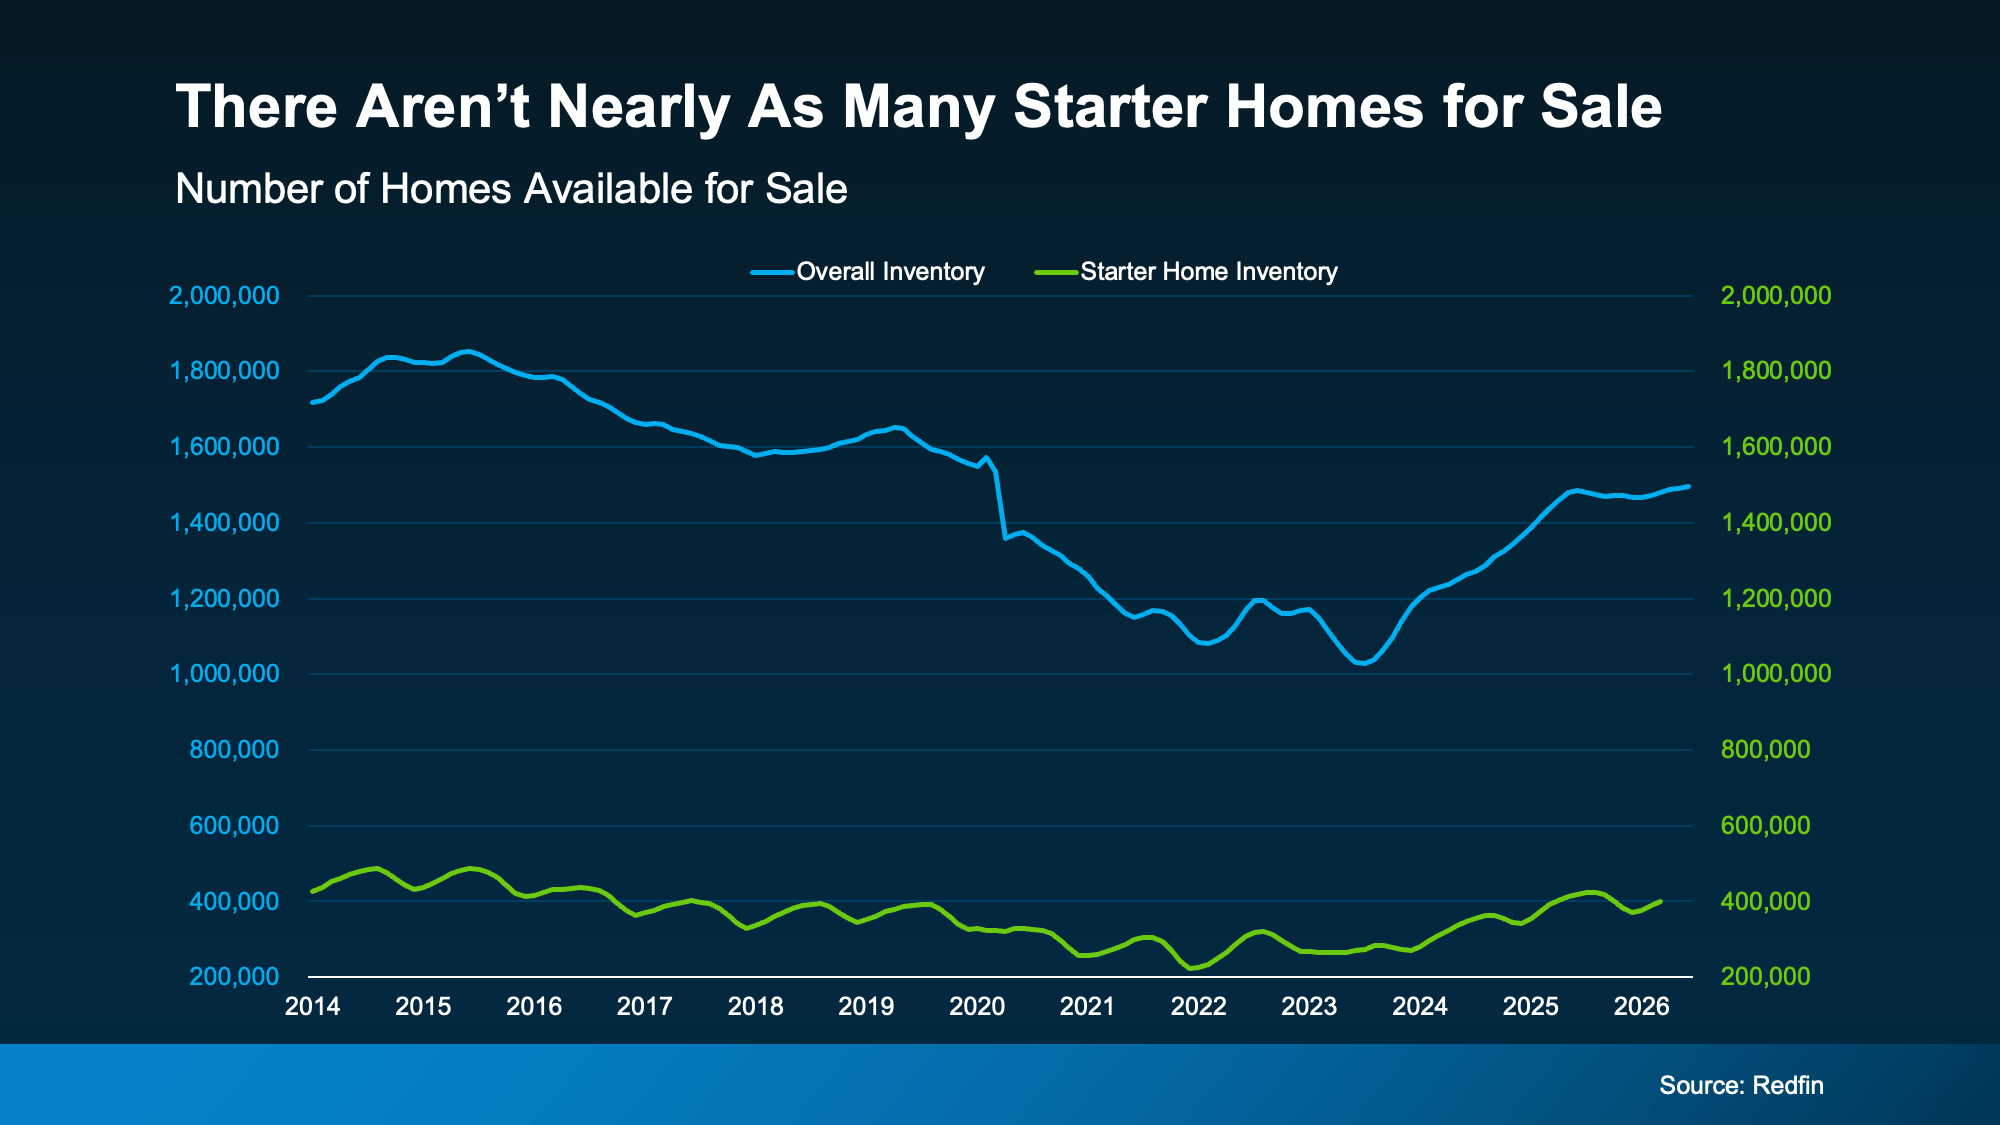
As Nadia Evangelou, Principal Economist and Director of Real Estate Research at the National Association of Realtors (NAR), explains:
“Too much of the inventory available today remains concentrated at higher price points, leaving a shortage of options for entry-level and middle-income buyers.”
That means you may have more choices for your move up than you’d expect. Whether you’re hoping for another bedroom, a home office, a bigger backyard, or simply more room for this next stage of life, today’s market may finally be giving you the chance to find it.
At the same time, your current house may be exactly what someone else has been looking for because homes like yours are still in short supply. That’s a unique advantage for move-up buyers. And it could help you sell for a stronger price. As Zillow says:
“Starter home value appreciation has outpaced other types of homes nationally, mostly because they’re so in demand.”
Your Biggest Advantage May Be Your Equity
Here’s the cherry on top. There’s one more thing your first home has been doing behind the scenes, and that’s building equity. Every mortgage payment you’ve made and every year your home’s value has grown has quietly increased your ownership stake in your house.
According to Cotality, the average homeowner with a mortgage has $295k in equity built up. While your number may be different, once you sell, it could become the down payment on your next home or help reduce the amount you need to borrow at today’s rates.
Put it all together and your move up becomes a lot more realistic than you think:
-
The house you’re selling is in demand.
-
The house you’re buying may be easier to find.
-
And the equity you’ve built can help bridge the gap between the two.
Your first home did exactly what it was supposed to do. It gave you a place to start.
Now, it may be the thing that helps you take the next step.
Bottom Line
Your first home was never meant to be your forever home. It was meant to help you build a life and build the financial foundation for whatever came next.
If your current home no longer fits the life you’re living today, connect with an agent. You may be closer to your next chapter than you realize.

You’ve probably heard plenty of doom and gloom about the housing market lately. High rates. Stretched budgets. Headlines that make buying or selling sound like a terrible idea. But the data tells a very different story.
This isn’t 2020 or 2021. It was never going to be. Those were the “unicorn years” – historic low mortgage rates, bidding wars on everything, homes flying off the market in days. That kind of market was a once-in-a-generation anomaly, not a baseline. So, when people compare today to that, of course it looks rough.
But compared to almost any other housing market in modern history? This one is holding up remarkably well.
Homeowners Are Sitting on a Mountain of Equity
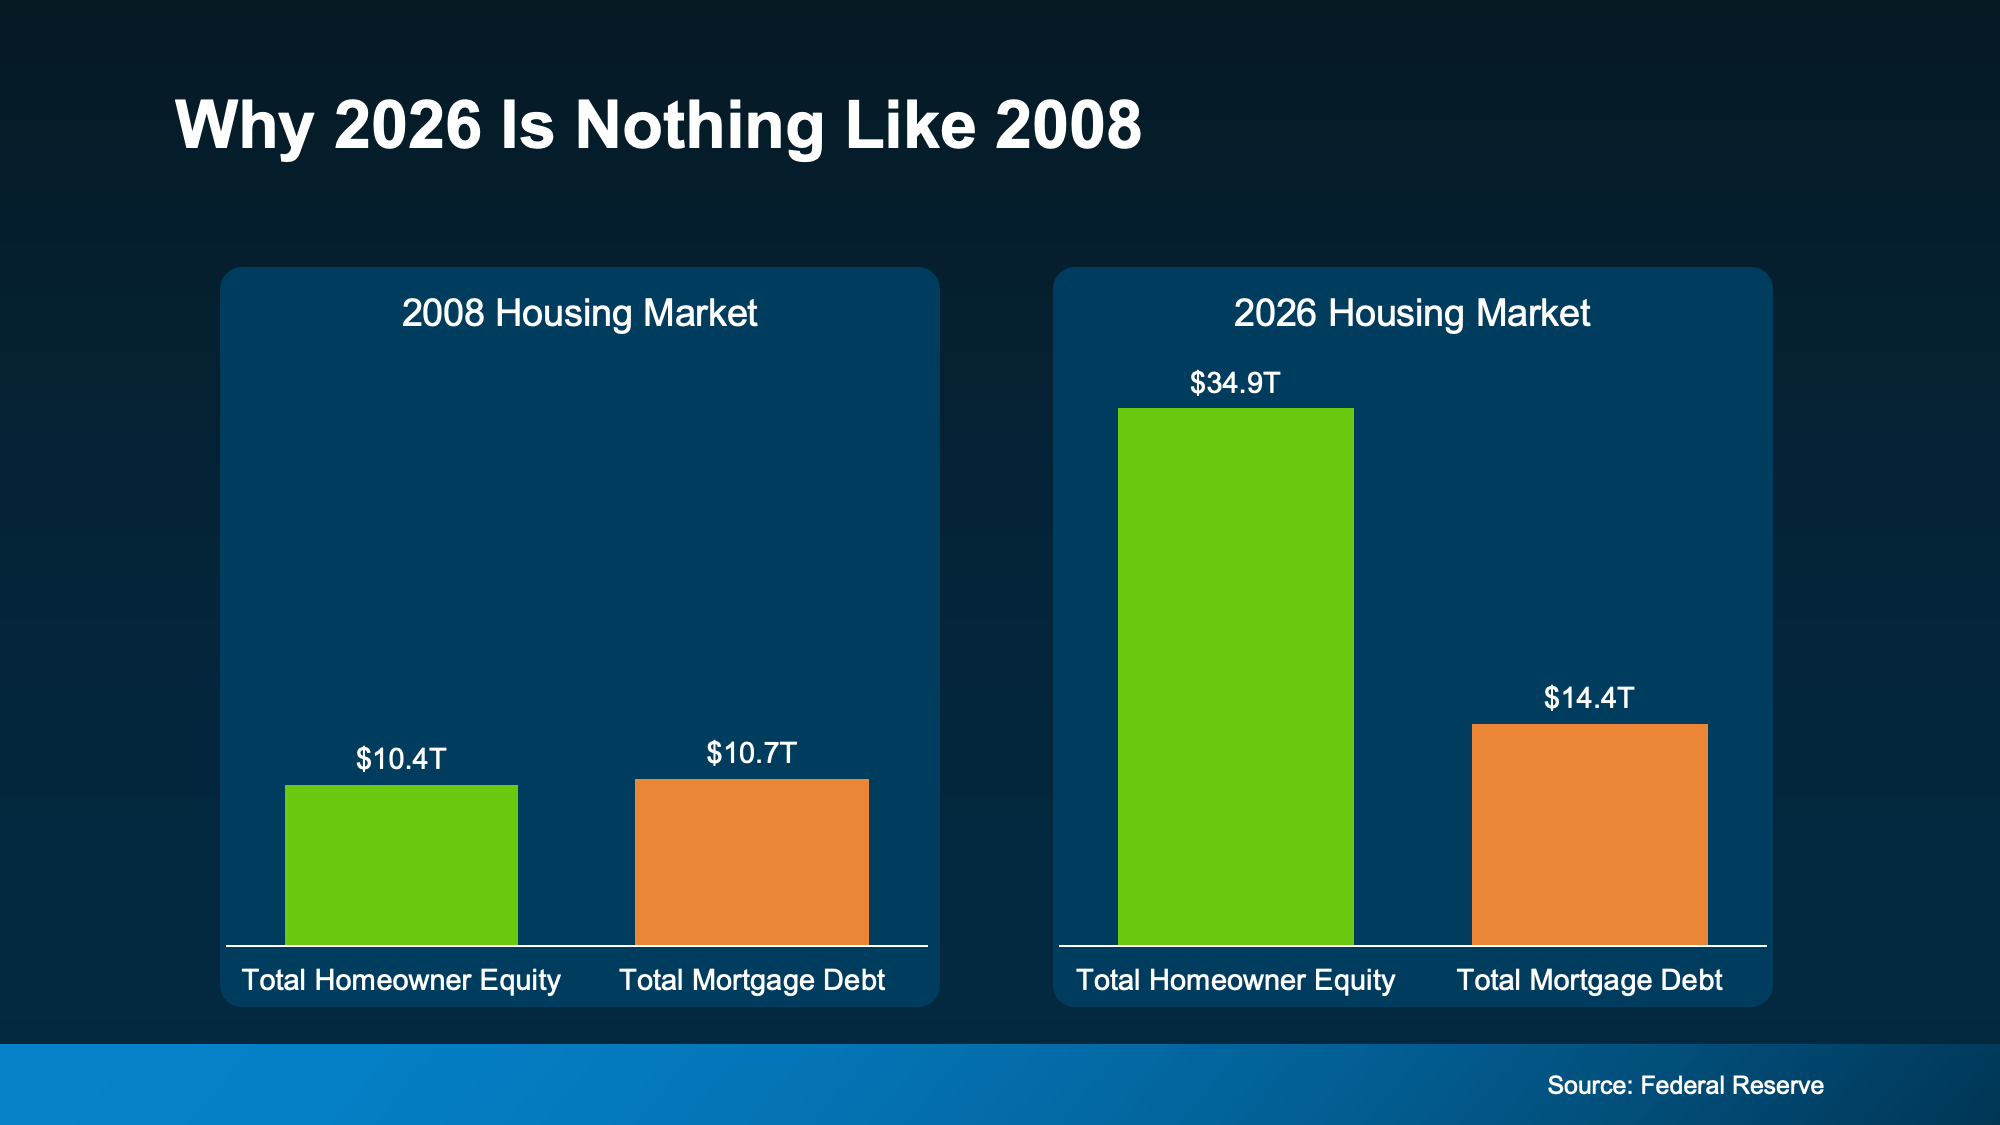
One of the biggest reasons this market hasn’t cracked is the financial strength of the American homeowner. According to Federal Reserve data, homeowner equity and mortgage debt were nearly identical in 2008. That means, if someone hit a rough patch, they had almost nothing to fall back on. That’s what made that crash so bad.
Today? Total homeowner equity across the country sits at $35 trillion – dwarfing total mortgage debt (see graph below):
 That gap means most homeowners aren’t stretched thin or one bad month away from trouble. They own a meaningful chunk of their home and that gives them options. If they needed to sell, many could because they have a cushion. And that cushion grows over time.
-
Realtor.com found that homeowners who’ve been in their home just 5 years have built up around $180,000 in equity on average. Stick around 6-10 years, and that jumps to over $340,000.
-
Data from ATTOM and the Census shows two-thirds of homeowners either own their home outright or have more than 50% equity.
That’s not a fragile market. That’s a population of homeowners who are financially positioned to sell, to stay, or to make their next move from a place of strength rather than pressure.
Low Rates and Low Foreclosures
At the same time, Federal Housing Finance Agency (FHFA) data shows more than half of all active mortgages still carry a rate below 4% (see graph below):
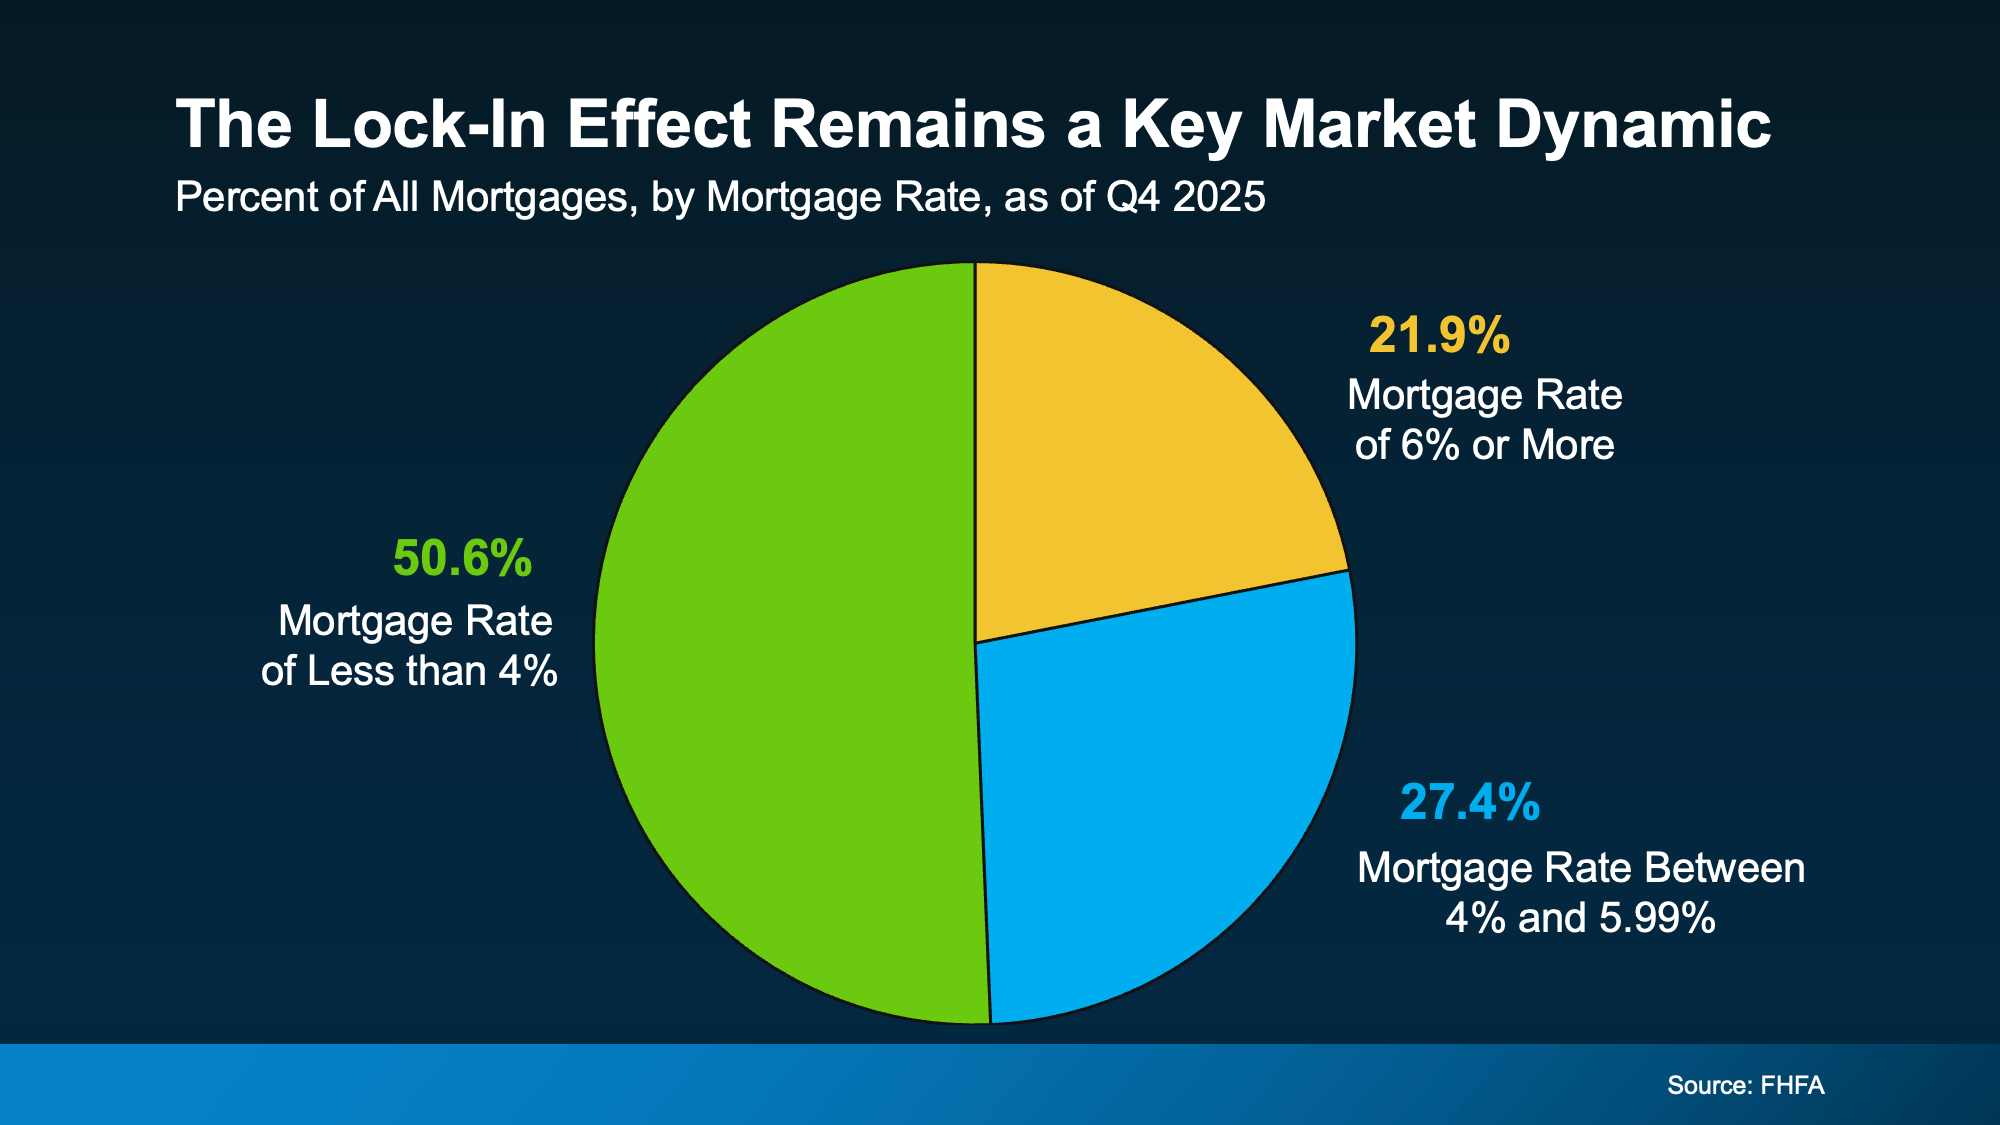 That’s a big reason inventory stays tight. Those homeowners aren’t in a rush to trade their rate for a higher one. They’re sitting comfortably in a strong financial position, not scrambling.
That comfort shows up in the foreclosure numbers, too. Despite a slight recent uptick, foreclosure volumes remain dramatically below historical norms, according to ATTOM. Homeowners aren’t losing their homes in droves. They have equity, they have breathing room, and most have options that keep them out of financial distress.
Prices Are Stabilizing, Not Crashing
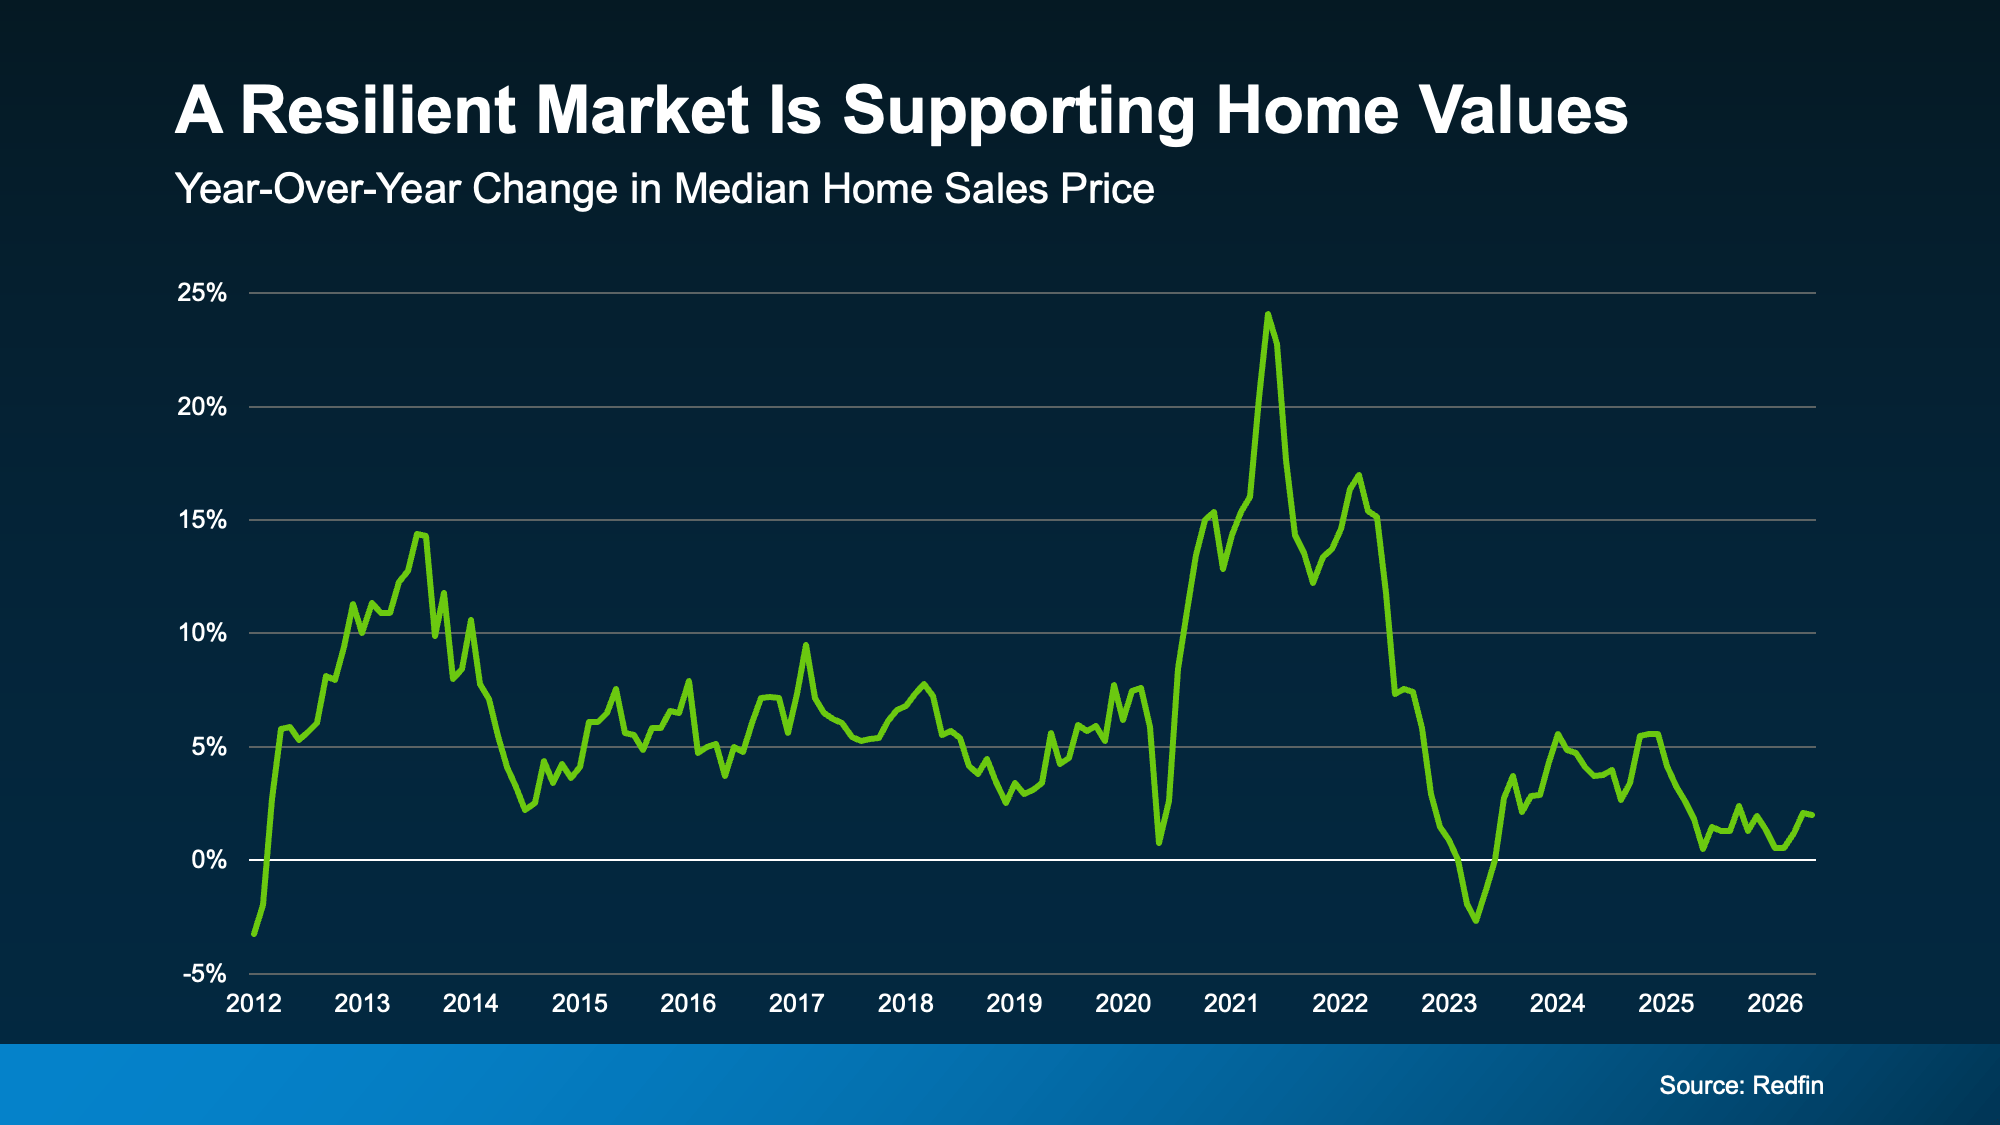
Here’s another point on the resilience of the market. Redfin research shows home prices are still rising, but the pace has slowed, now closer to 2% year-over-year nationally (see graph below):
 That slowdown is good news, as Daryl Fairweather, Chief Economist at Redfin, explains:
“We’re in the middle of a long-term housing market correction, not a housing market crash. After the pandemic-era frenzy sent prices soaring and inventory to historic lows, the market needed a reset.”
Bottom Line
This market isn’t broken, and waiting for a crash that isn’t coming has a cost. Every month spent on the sidelines is a month someone else is building equity, locking in a price, or getting ahead of what most experts expect to be a housing surge once broader economic conditions settle.
Whether you’re thinking about buying or selling, a local real estate agent can help you figure out what this market means for your specific situation and what your next move could look like.

You may have seen the headlines lately about mortgage debt in America hitting a record high. And maybe your brother-in-law brought it up at the dinner table like he’s been waiting all week to spark a debate.
Here’s the thing. He’s not wrong. But he only has half the story. And the half he’s missing? It changes everything.
Spoiler: homeowners are on stronger footing than the headlines suggest, and the housing market has more going for it than most people realize.
The Headline Number Is Real, But It’s Missing Context
Yes, according to the Federal Reserve, there is currently about $14 trillion in mortgage debt in the United States. That is an all-time high. And when you hear that alongside stories about people struggling to pay their bills, it’s easy to assume the worst.
But here’s what the data actually shows (see graph below):
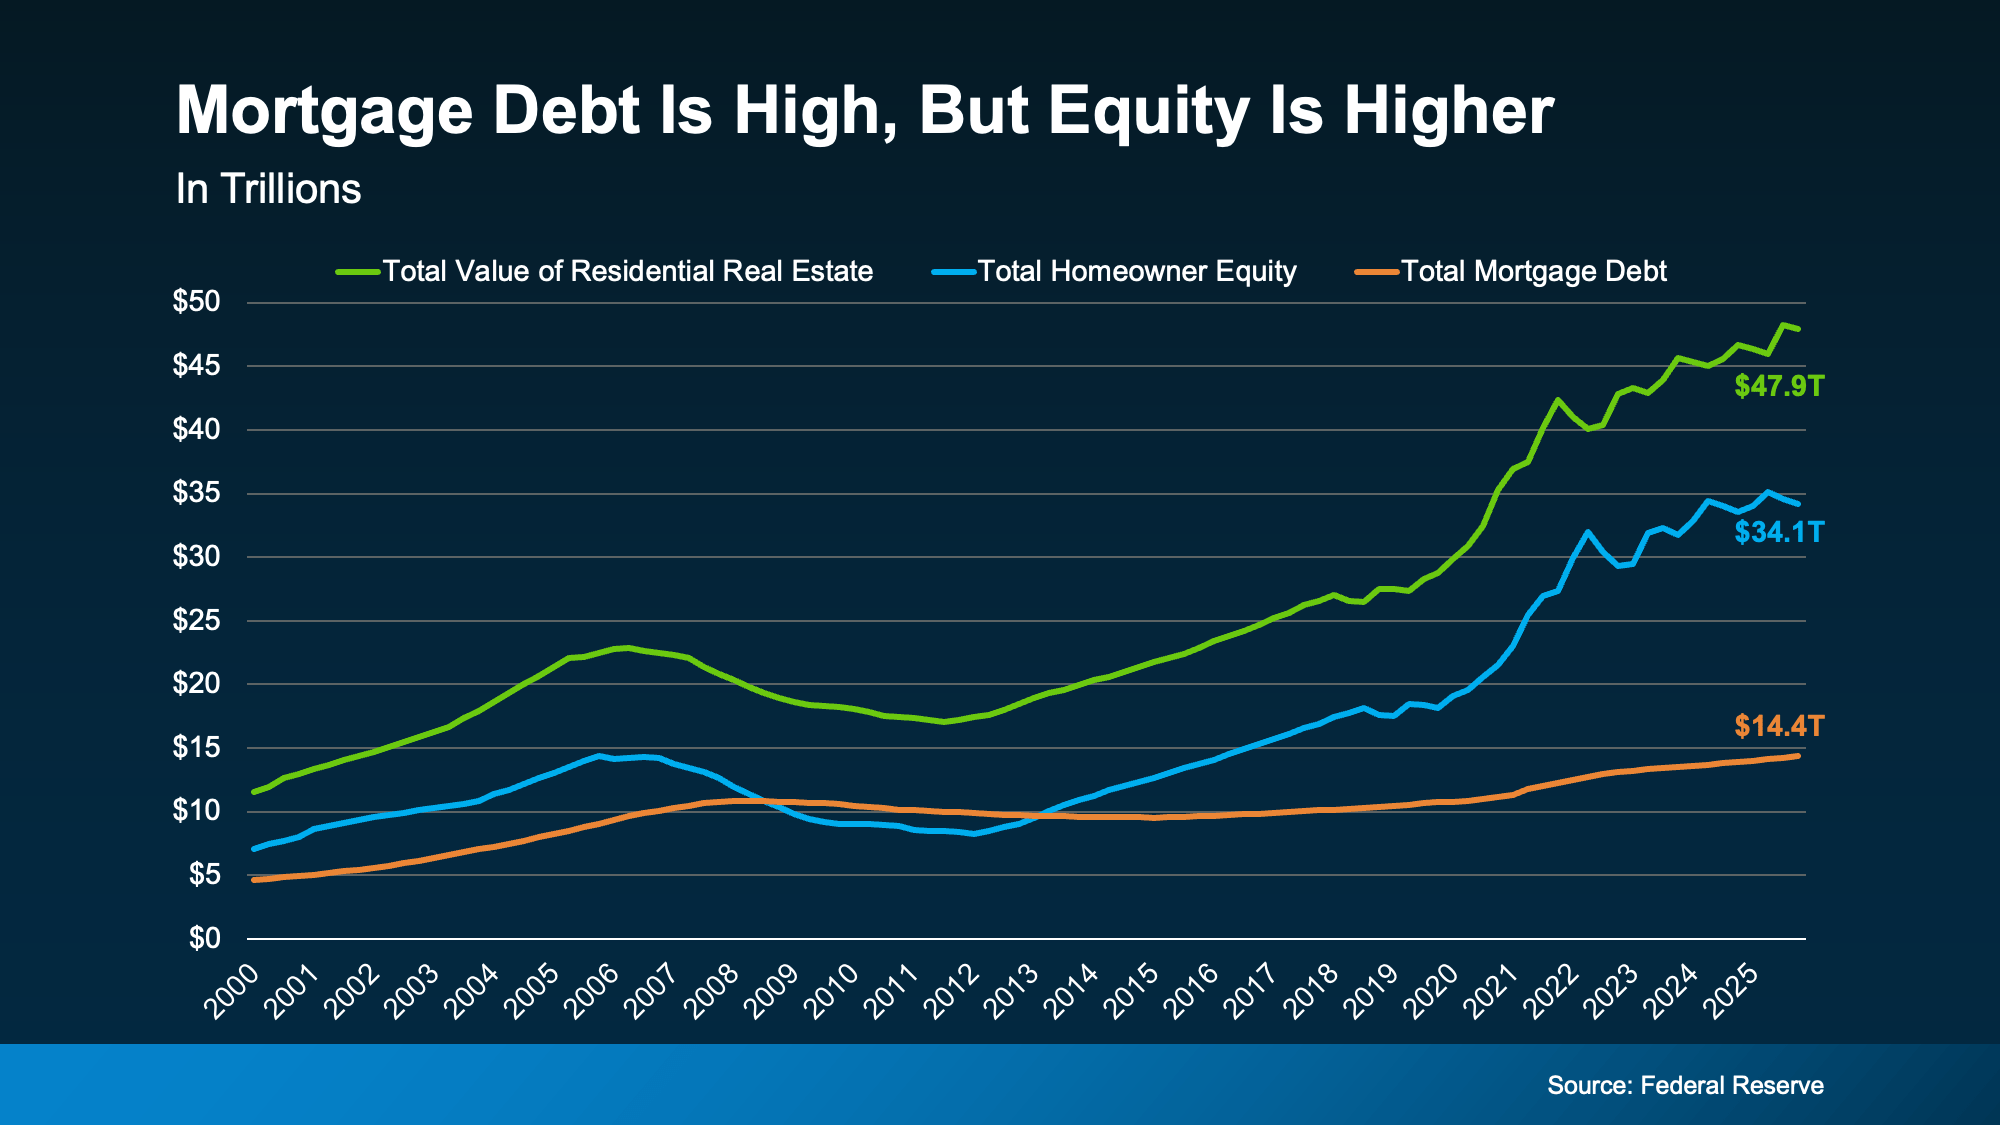 This chart from the Federal Reserve tracks three things from 2000 to today: the total value of all U.S. homes (the green line), the equity homeowners hold in those homes (the blue line), and the total mortgage debt owed on them (the orange line).
Right now, home values sit at $47.9 trillion. Homeowner equity is at $34.1 trillion. And the mortgage debt everyone’s worried about? It’s $14.4 trillion.
Debt is at a record high, sure. But the equity homeowners have built up is more than double that number, and it’s also near a record high.
Here’s the part worth pausing on. See the years between 2008 and 2013 where the orange line was higher than the blue one? That’s when the housing market was in genuine trouble. When debt exceeds equity like it did back then, homeowners have no cushion.
So, when prices dropped in 2008, millions of people owed more than their homes were worth and had nowhere to go. That’s what a housing crisis actually looks like. That’s not what’s happening today. Right now, it’s just the opposite.
The gap between what people owe and what they own has never been wider – in a good way. Today, they have far more equity than debt.
Most Homeowners Are in a Rock-Solid Position
So, we know equity is high nationally. But what does that actually look like at the individual homeowner level? This next chart uses data from ATTOM and the Census to put it in perspective:
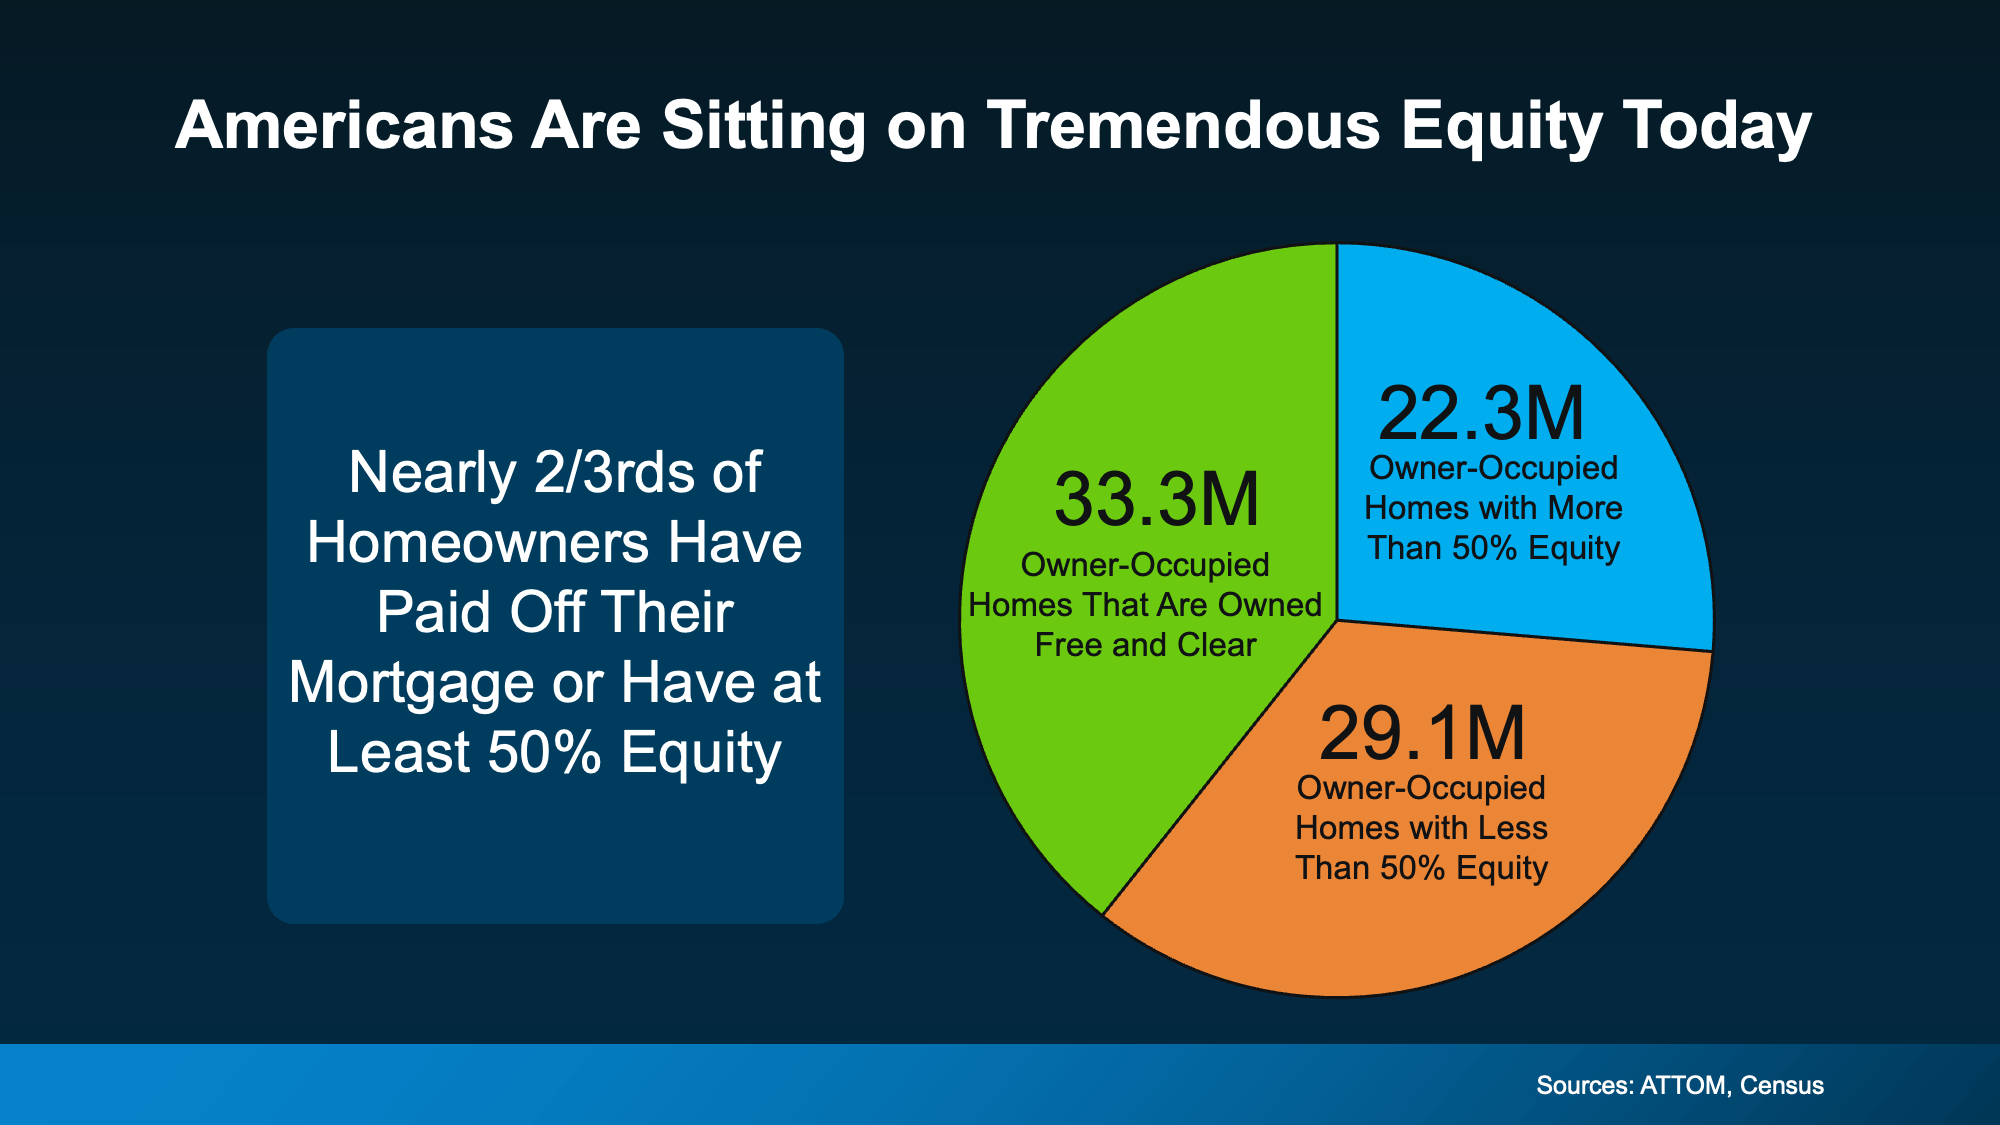 Out of all owner-occupied homes in the country, 33.3 million are owned completely free and clear – no mortgage, no lender, no risk of foreclosure. Another 22.3 million homeowners have more than 50% equity in their homes.
Add those together, and you’re looking at nearly two-thirds of all homeowners who have either paid off their mortgage entirely or have such a substantial equity stake that they’re in an extremely stable position.
The remaining slice – 29.1 million homes with less than 50% equity – isn’t a sign of distress, either. That includes plenty of people who recently bought, are building equity over time, and are doing just fine.
The point is this isn’t a market teetering on the edge. It’s a market built on an unusually strong foundation.
Bottom Line
Record mortgage debt makes for a scary headline. But context matters.
Equity is near an all-time high, home values have surged, and the vast majority of homeowners are in a position of real financial strength. The conditions that made 2008 a crisis simply don’t exist right now.
If you’re wondering what all of this means for your situation, whether you’re thinking about buying, selling, or just trying to make sense of the market, a local real estate agent would love to talk it through with you. Reach out anytime. No pressure, just answers.

Buying a Home? Here’s What You Should Know About Home Insurance Costs.

Home Price Growth Slowed Down. That May Be Changing.

Selling a Luxury House? Here’s Why Now Is a Good Time


-

 Equity4 weeks ago
The Housing Market Is Stronger Than You Think
-

 Economy4 weeks ago
What Buying or Selling a Home Gives Back to Your Community
-

 Buying Tips3 weeks ago
Student Loans Are Back in the News. Don’t Let It Put Your Homeownership Plans on Hold.
-

 Affordability4 weeks ago
Down Payments Are Smaller Than They’ve Been Since 2021
-

 Affordability3 weeks ago
What To Expect from the Housing Market in the Second Half of 2026
-

 For Sellers2 weeks ago
Think Nobody’s Buying Homes Right Now? Think Again.
-

 Buying Tips3 weeks ago
The “Take It or Leave It” Attitude Is Fading from the Market – What That Means for You
-

 First-Time Buyers2 weeks ago
14 Years Running: Why Real Estate Is Still America’s Favorite Investment
You must be logged in to post a comment Login