

For Buyers
The U.S. Foreclosure Map You Need To See
Foreclosure headlines are making noise again – and they’re designed to stir up fear to get you to read them. But what the data shows is actually happening in the market tells a very different story than what you might be led to believe. So, before you jump to conclusions, it’s important to look at the full picture.
Yes, foreclosure starts are up 7% in the first six months of the year. But zooming out shows that’s nowhere near crisis levels. Here’s why.
Filings Are Still Far Below Crash Levels
Even with the recent uptick, overall foreclosure filings are still very low. In the first half of 2025, just 0.13% of homes had filed for foreclosure. That’s less than 1% of homes in this country. In fact, it’s even far less than that at under a quarter of a percent. That’s a very small fraction of all the homes out there. But like with anything else in real estate, the numbers vary by market.
Here’s the map you need to see that shows how foreclosure rates are lower than you might think, and how they differ by local area:
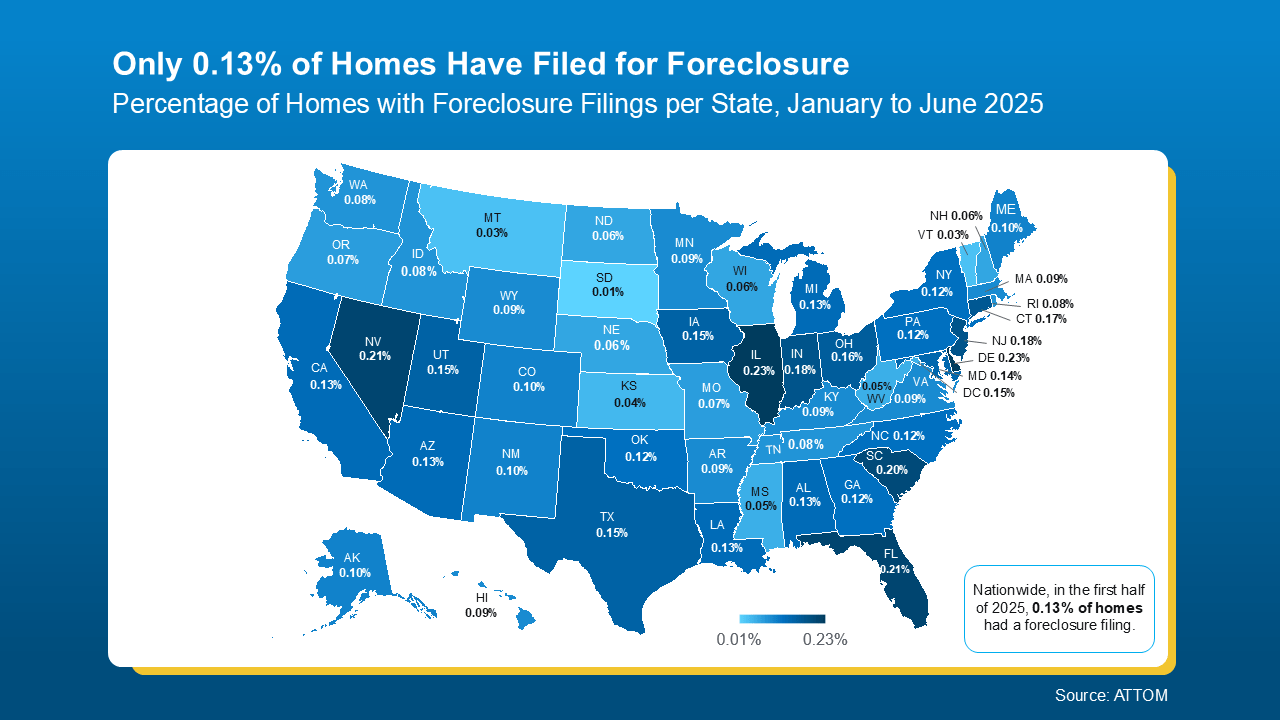 For context, data from ATTOM shows in the first half of 2025, 1 in every 758 homes nationwide had a foreclosure filing. Thats the 0.13% you can see in the map above. But in 2010, back during the crash? Mortgage News Daily says it was 1 in every 45 homes.
Today’s Numbers Don’t Indicate a Market in Trouble
But here’s what everyone remembers…
Leading up to the crash, risky lending practices left homeowners with payments they eventually couldn’t afford. That led to a situation where many homeowners were underwater on their mortgages. When they couldn’t make their payments, they had no choice but to walk away. Foreclosures surged, and the market ultimately crashed.
Today’s housing market is very different. Lending standards are stronger. Homeowners have near record levels of equity. And when someone hits financial trouble, that equity means many people can sell their home rather than face foreclosure. As Rick Sharga, Founder of CJ Patrick Company, explains:
“. . . a significant factor contributing to today’s comparatively low levels of foreclosure activity is that homeowners—including those in foreclosure—possess an unprecedented amount of home equity.”
No one wants to see a homeowner struggle. But if you’re a homeowner facing hardship, talk to your mortgage provider. You may have more options than you think.
Bottom Line
Recent headlines may not tell the whole story, but the data does. Foreclosure activity remains low by historical standards and is not a sign of another crash.
If you’re simply watching the market and want to understand what’s really going on, or how this impacts the value of your home, connect with an agent. They’ll help you separate fact from fear by showing you what the data really says.

For the past few years, affordability has been what’s stopped a lot of buyers in their tracks. Maybe it stopped you, too.
At some point you probably did the math, looked at the monthly payment, and decided to pause your search and wait for things to get better. But here’s something you may have missed while you’ve been sitting on the sidelines.
Over the last year, housing affordability has improved in all 50 states. Yes, you read that right. It’s gotten better in every single state.
That’s based on new research coming out of First American. And while housing is still fairly expensive compared to historical standards, the pressure buyers felt over the last few years is finally starting to ease.
Some Areas Are Seeing Bigger Improvements
The first thing you need to know is that this isn’t just happening in one region or in a small handful of cities. The trend is happening almost everywhere.
Sure, individual states, cities, and even neighborhoods are going to vary – sometimes by a lot. But overall, more buyers are able to buy again. And in 48 of the top 50 metros, affordability has improved over the past year.
That same research breaks down which cities are seeing the biggest gains:
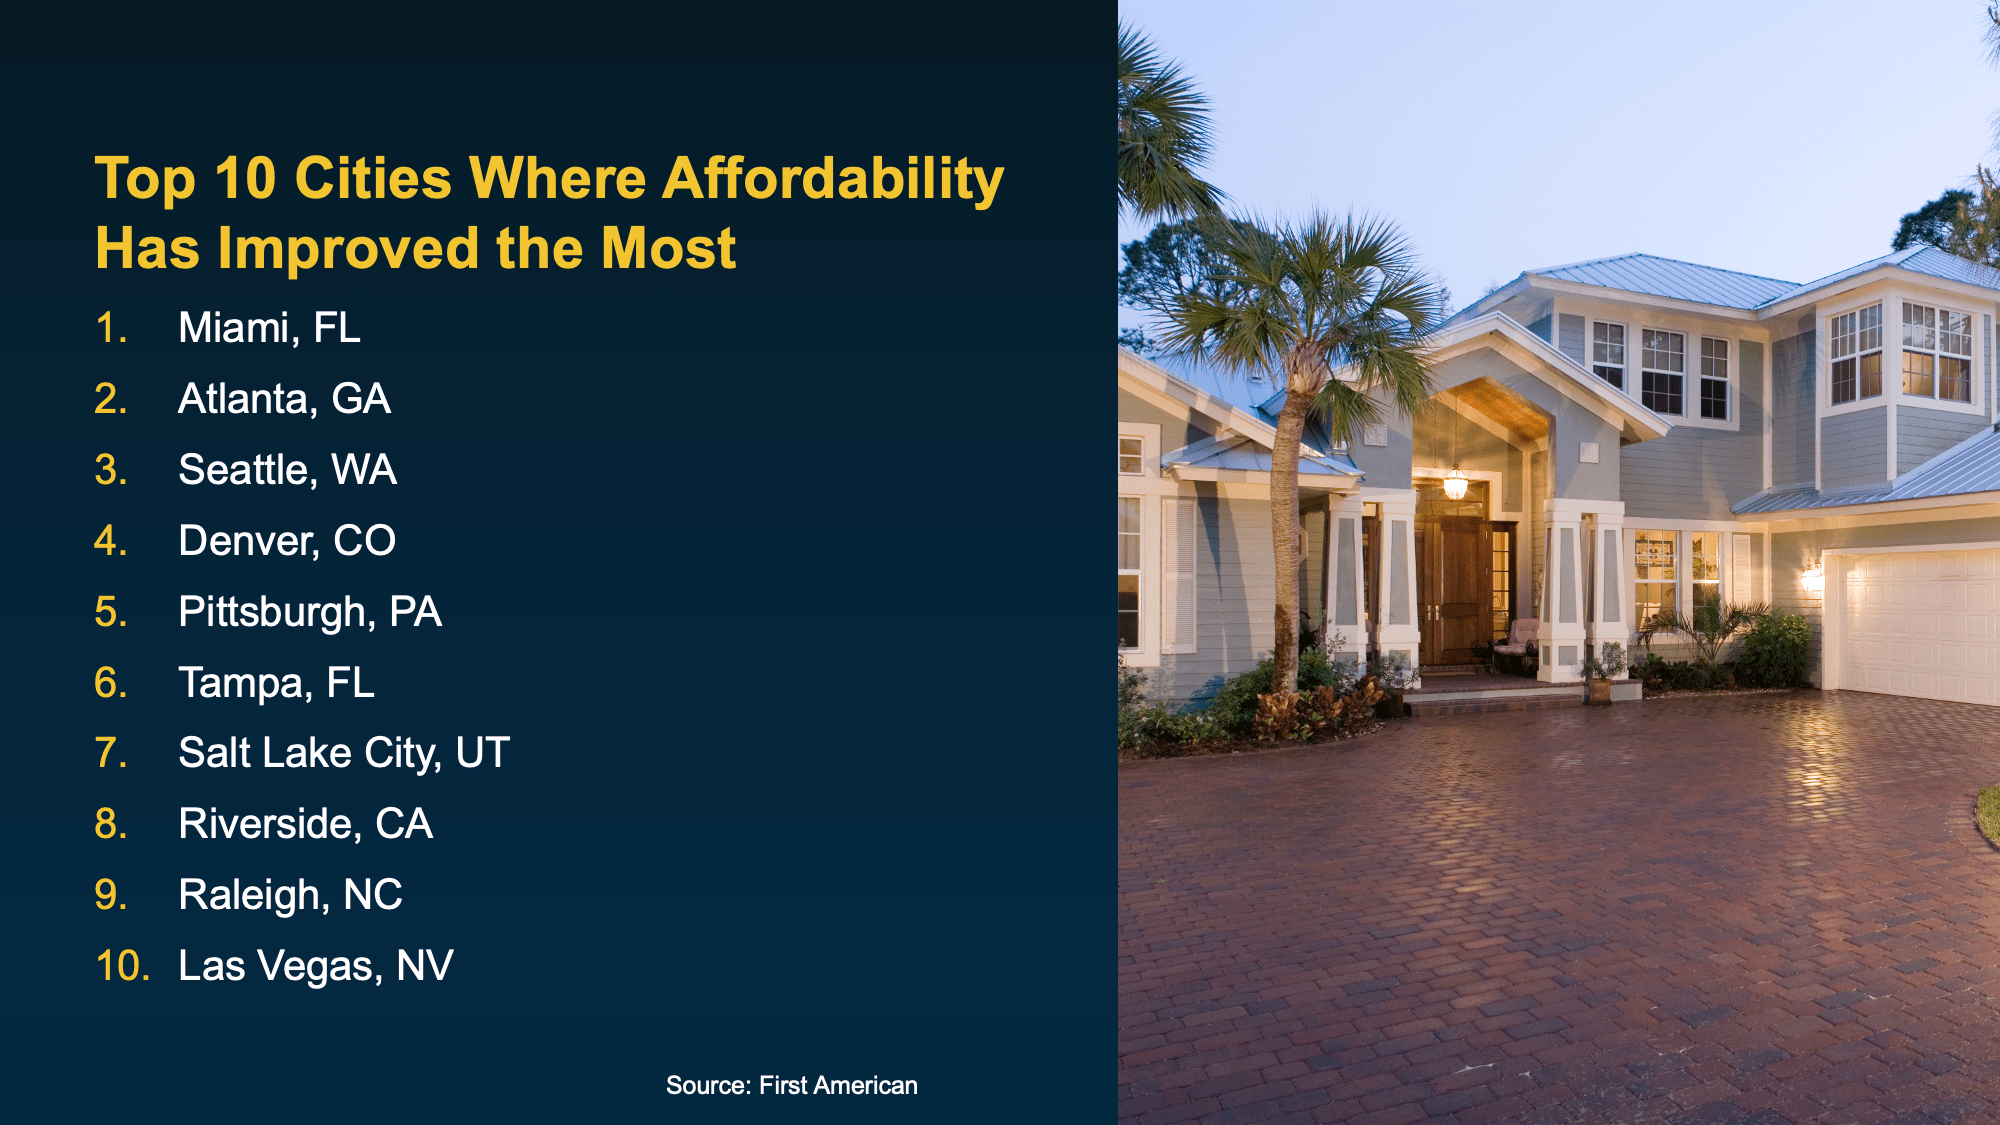 Just in case you’re wondering: why these areas? It’s simple. In many cases, it comes down to the number of homes for sale.
When buyers have more choices, it creates a healthier balance in the market and that can help bring affordability back within reach. With homes up for grabs, it opens the door a bit wider for buyers to negotiate with sellers for credits, price cuts, and more. And it gives you more chances to find a house that works for your needs and budget.
It may make more of a difference than you think.
None of this means affordability challenges have completely disappeared. Buying a home is still a big financial decision. But the trend is moving in a direction many buyers have been waiting for.
As Chen Zhao, Head of Economic Research at Redfin, puts it:
“The housing affordability crisis is showing signs of easing . . . opening the door for more Americans to make the jump to homeownership.”
Bottom Line
If you were holding off on buying, this could be exactly the signal you’ve been waiting so long for. To find out how much affordability’s improved in your area, connect with a local real estate agent.

Foreclosures are ticking up. And that may make your mind jump straight to thoughts of 2008 – specifically to what happened to the market during the housing crash. So, let’s do exactly what your brain already wants to do, and see if there’s any connection there.
The simple truth is foreclosure filings are rising. But they’re nowhere near crisis levels. And that’s not where they’re headed either. Here’s why.
Take a look at serious delinquencies – loans where the homeowner is more than 90 days late on their mortgage payments.
While those have increased slightly, data from the New York Fed shows they still remain low. And they aren’t anywhere close to levels seen when the market crashed (see graph below):
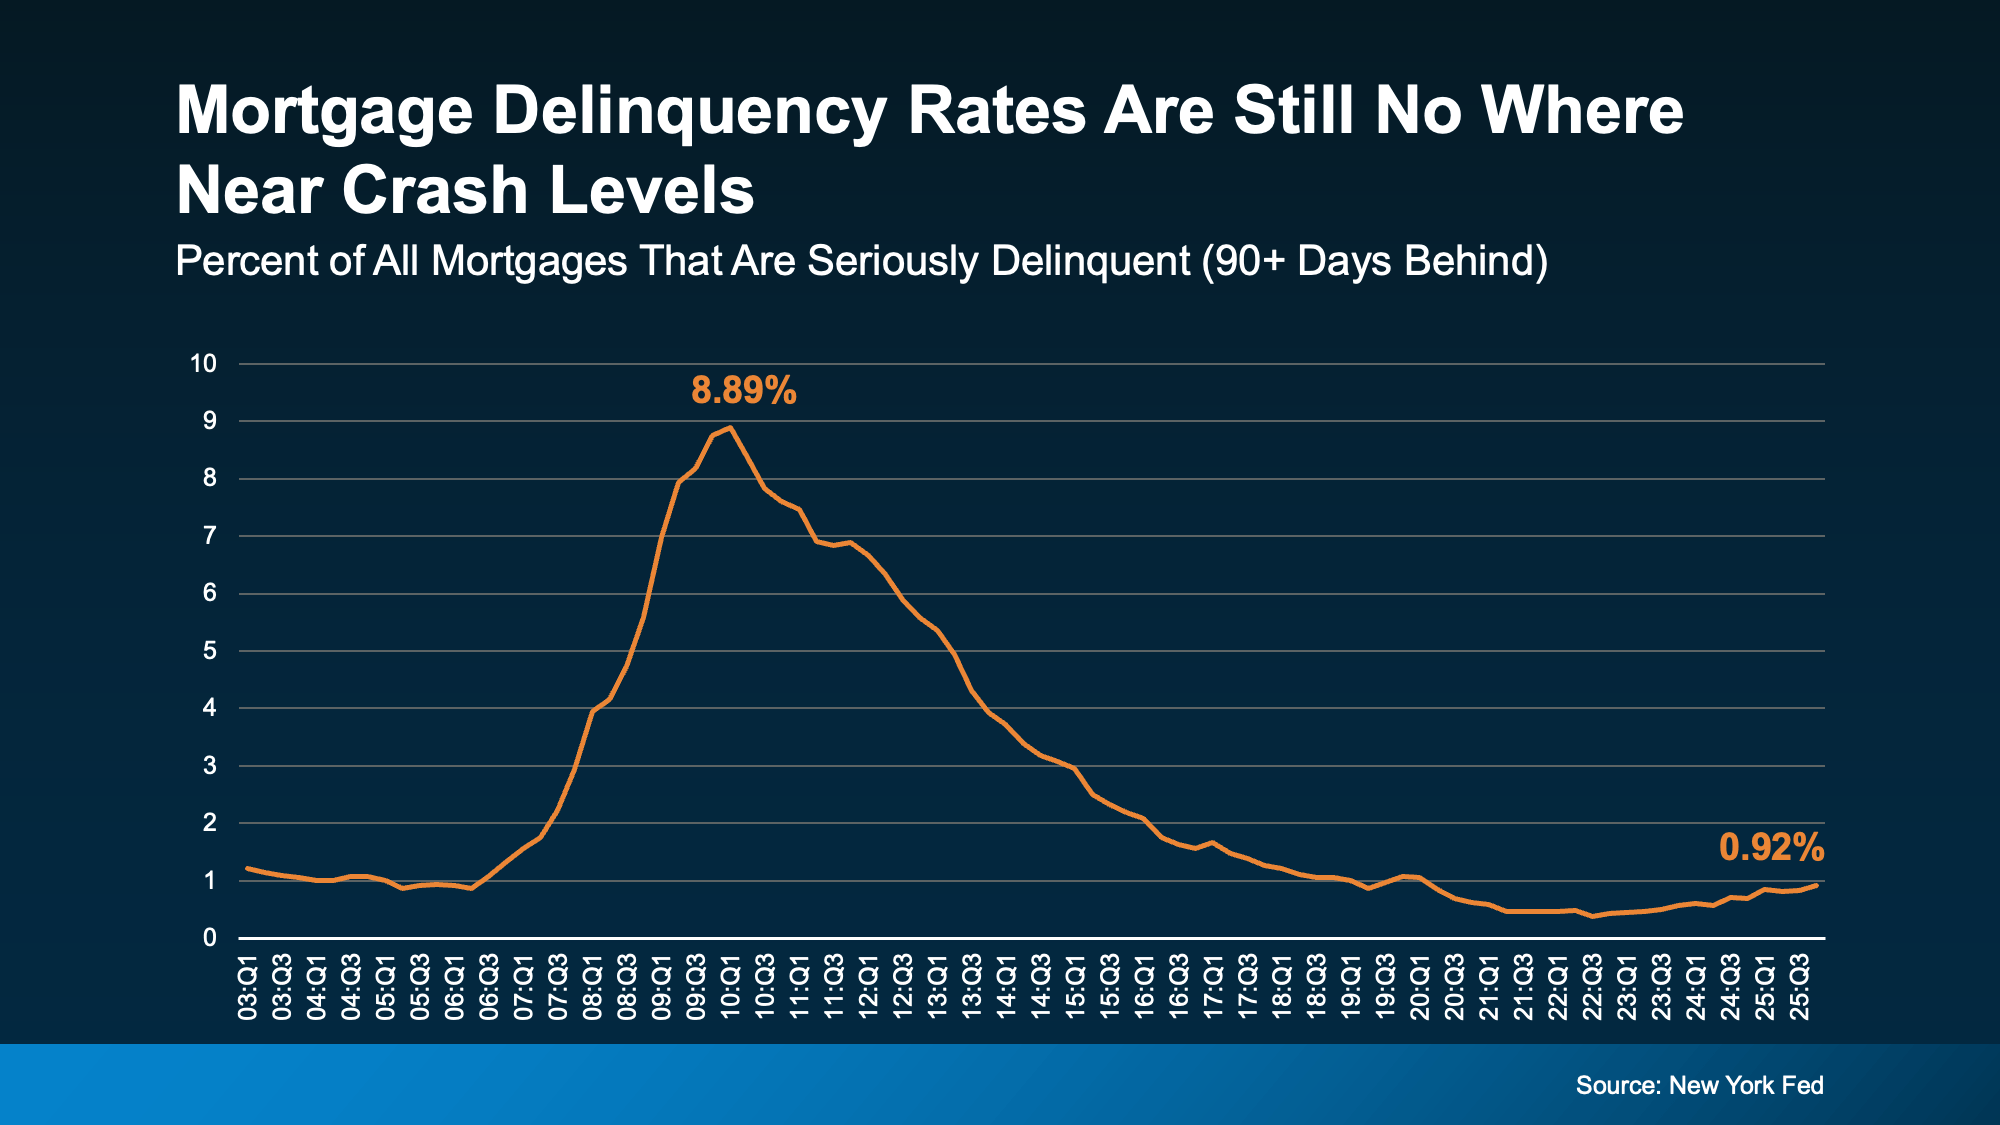 Right now, about 1% of mortgages are seriously delinquent. That’s only 1 in 100.
In the years around the crash, they were up around 9%. That’s 1 in 11.
That’s a big difference.
And it’s important to remember not all delinquencies even become foreclosure filings. Some homeowners who are falling behind will work out repayment plans with their banks and lenders because banks don’t want to see a wave of foreclosures either.
That’s why foreclosure numbers are even lower than delinquencies. ATTOM shows only 0.3% of all homes are currently going through a foreclosure filing. And those won’t even all go to a full foreclosure. That’s not a wave. That’s a ripple at most.
If People Are Falling Behind on Payments, Why Aren’t There Even More Foreclosures?
And maybe you’re wondering, if people are struggling financially, why aren’t there more foreclosures? Here’s the easiest way to answer that.
When households feel financial pressure, they tend to prioritize their mortgage payment above almost everything else. Because the last thing they want to lose is their home.
Data from the New York Fed shows serious delinquencies have risen more for credit cards and auto loans (the blue and green lines). But mortgage delinquencies and home equity lines of credit (borrowing against the value of your home) aren’t seeing the same big uptick (the yellow and orange lines). They’re a lot more stable overall.
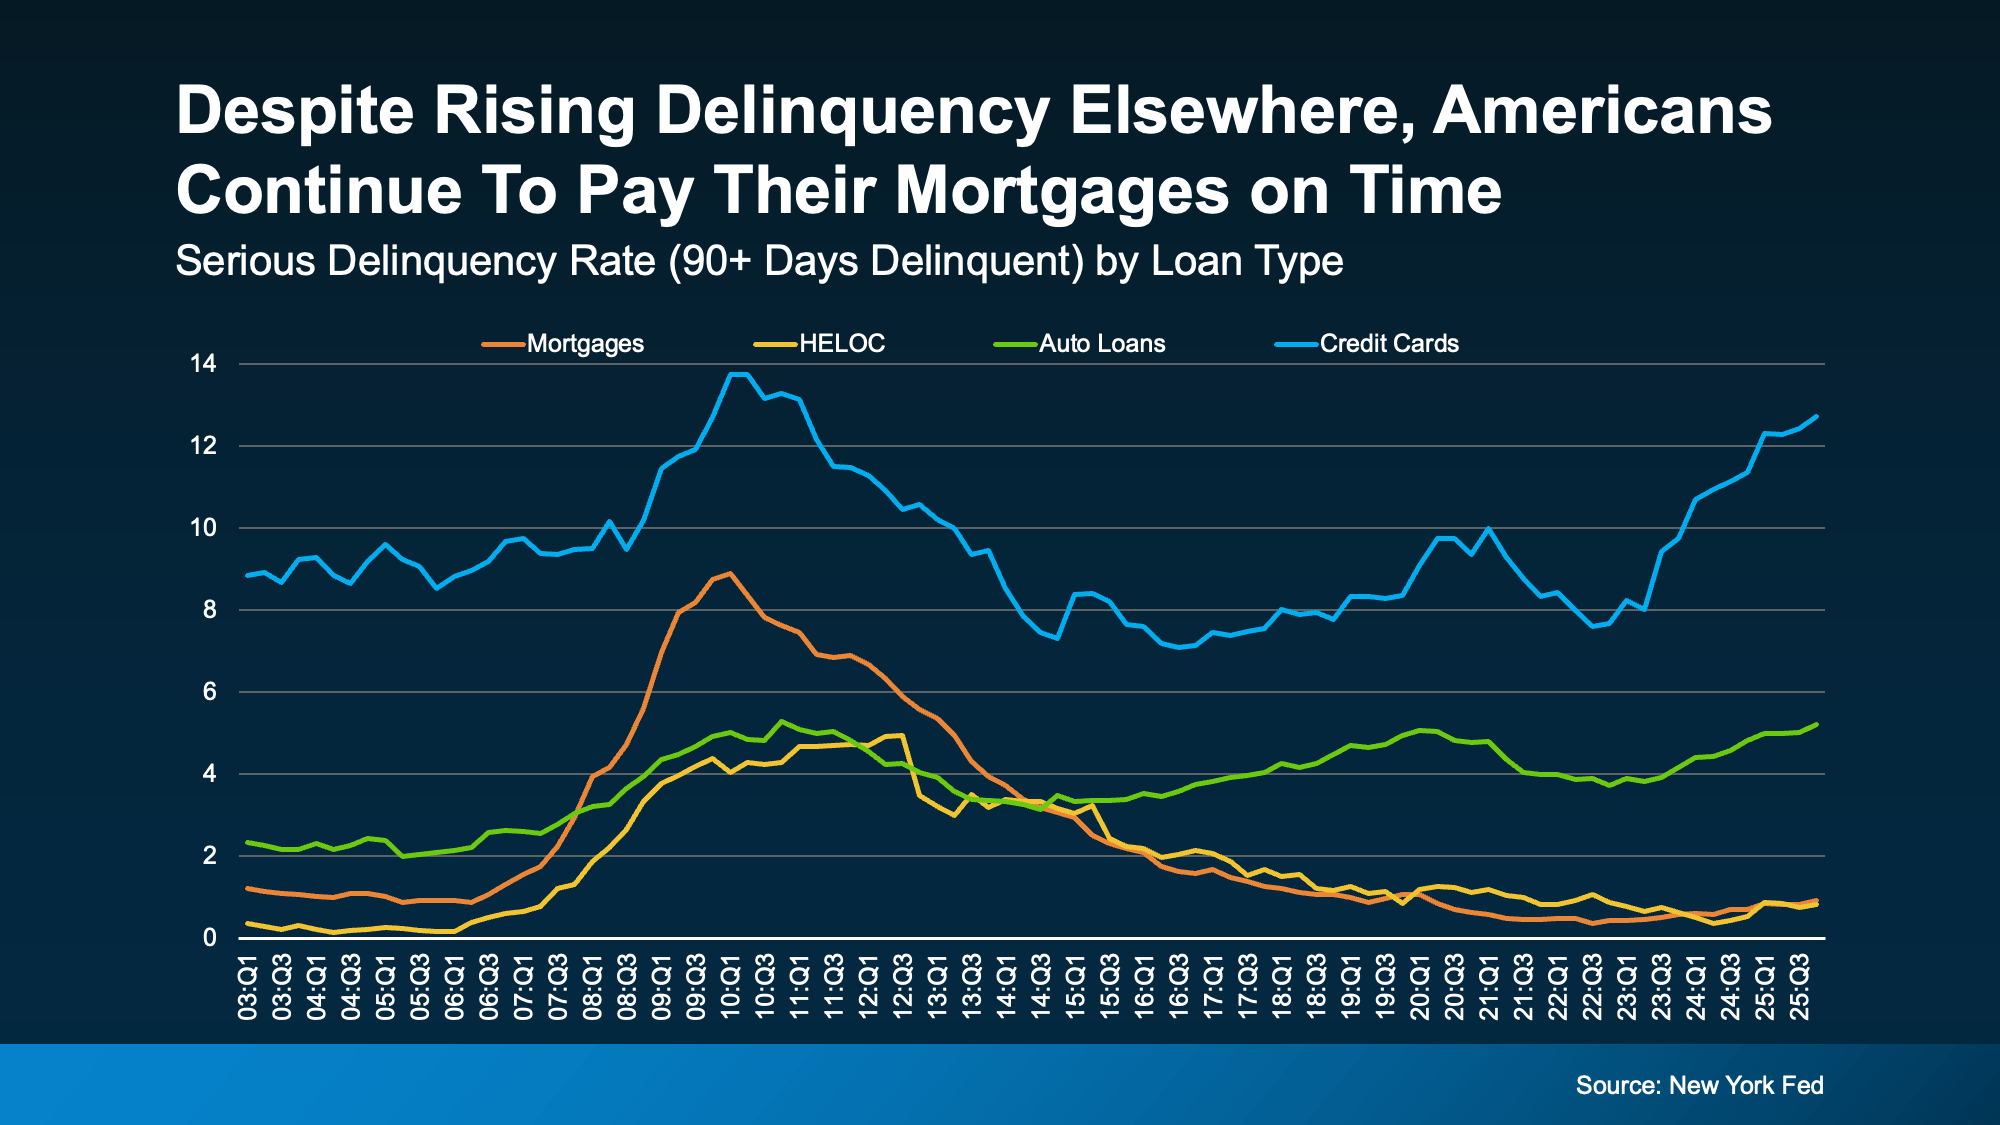 In other words, people may fall behind on other debts, but they fight hard to keep their homes. And, in today’s housing market, they’re also in a strong equity position to do so.
Home Equity Changes Everything
Many people have built significant equity over the past several years. And that creates options. As Daren Blomquist, VP of Market Economics at Auction.com, explains:
“Distressed homeowners… many times they still have equity in their homes. There’s an opportunity for them to sell that home, avoid foreclosure, and walk away with equity.”
That’s a major difference from 2008. Back then, many homeowners owed more than their homes were worth. And selling wasn’t an easy solution. Today, for many people, it is. And even in situations where equity isn’t enough, homeowners are encouraged to contact their loan servicer early to explore alternatives to foreclosure.
Bottom Line
Are foreclosure filings rising slightly? Yes. Are they anywhere near crash territory? No. And homeowners today have far more equity and flexibility than they did during the crash.
If you’re concerned about what you’re seeing in the headlines, the best move isn’t panic, it’s perspective. And the data right now says this isn’t 2008 all over again.

Mortgage rates have already dropped into the upper 5s twice this year. But after just a few days, they ticked back up into the low 6% range. If you saw that and thought, “Great. I missed it,” you’re not the only one.
A lot of buyers are treating the 5s like some kind of magic number. As if moving from 6.1% to 5.99% suddenly changes everything. And from a mindset perspective, it does feel different.
But here’s the part most people don’t actually run the math on.
The Payment Difference Isn’t What You Think
Let’s say you’re looking at a $500,000 home loan. At 6.1%, generally speaking, your principal and interest payment is roughly $3,030 per month. At 5.9%, it’s about $2,966 per month.
That’s a difference of only $64 a month.
Not $300.
Not $500.
Sixty dollars.
Let that sink in for just a moment.
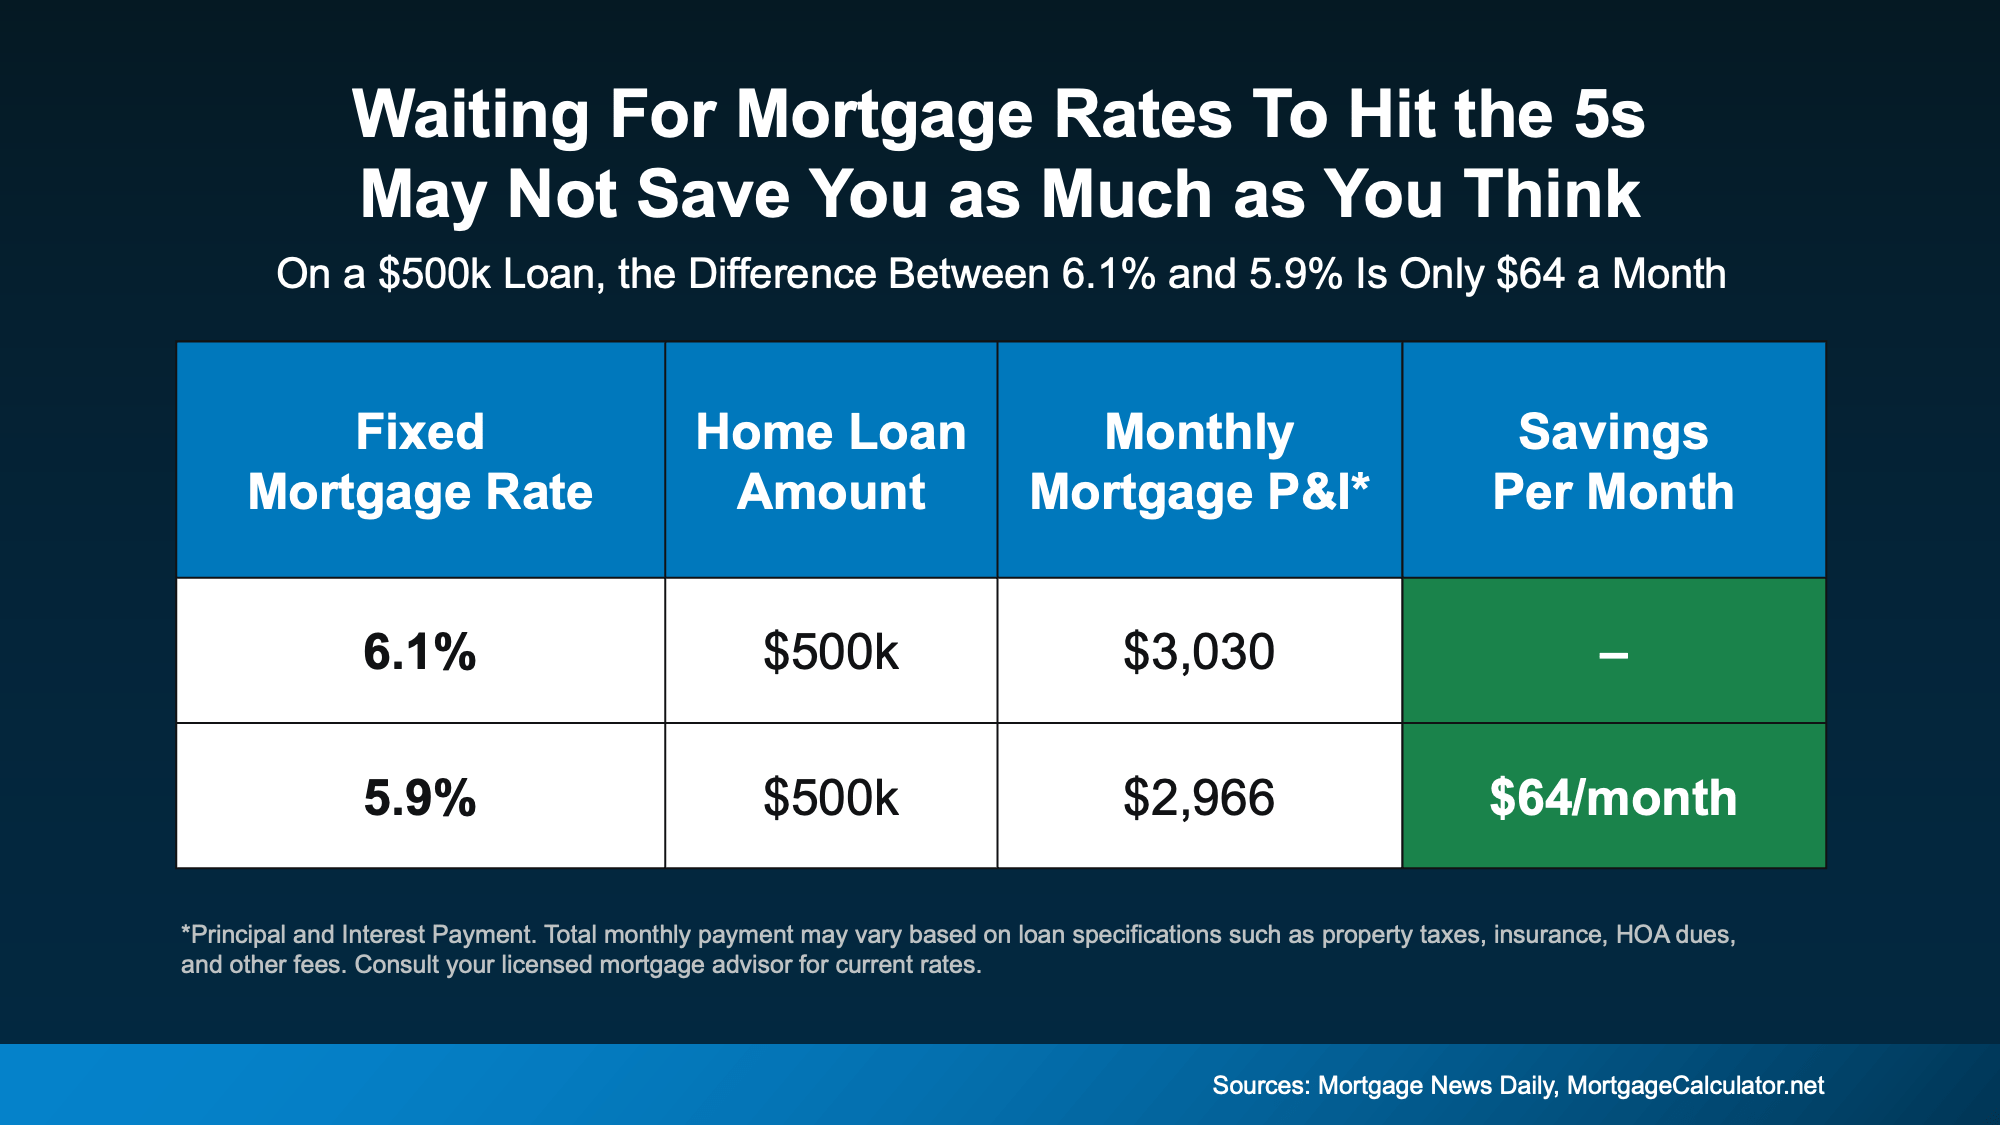 Yes, over time that $64 a month can add up. But it’s far from the dramatic swing many buyers imagine when they say they’re “waiting for the 5s.”
The psychological impact of seeing a 5 in front of your rate can feel big. The financial impact? It might be something you don’t even notice when it’s all said and done.
Experts Aren’t Predicting a Big Drop
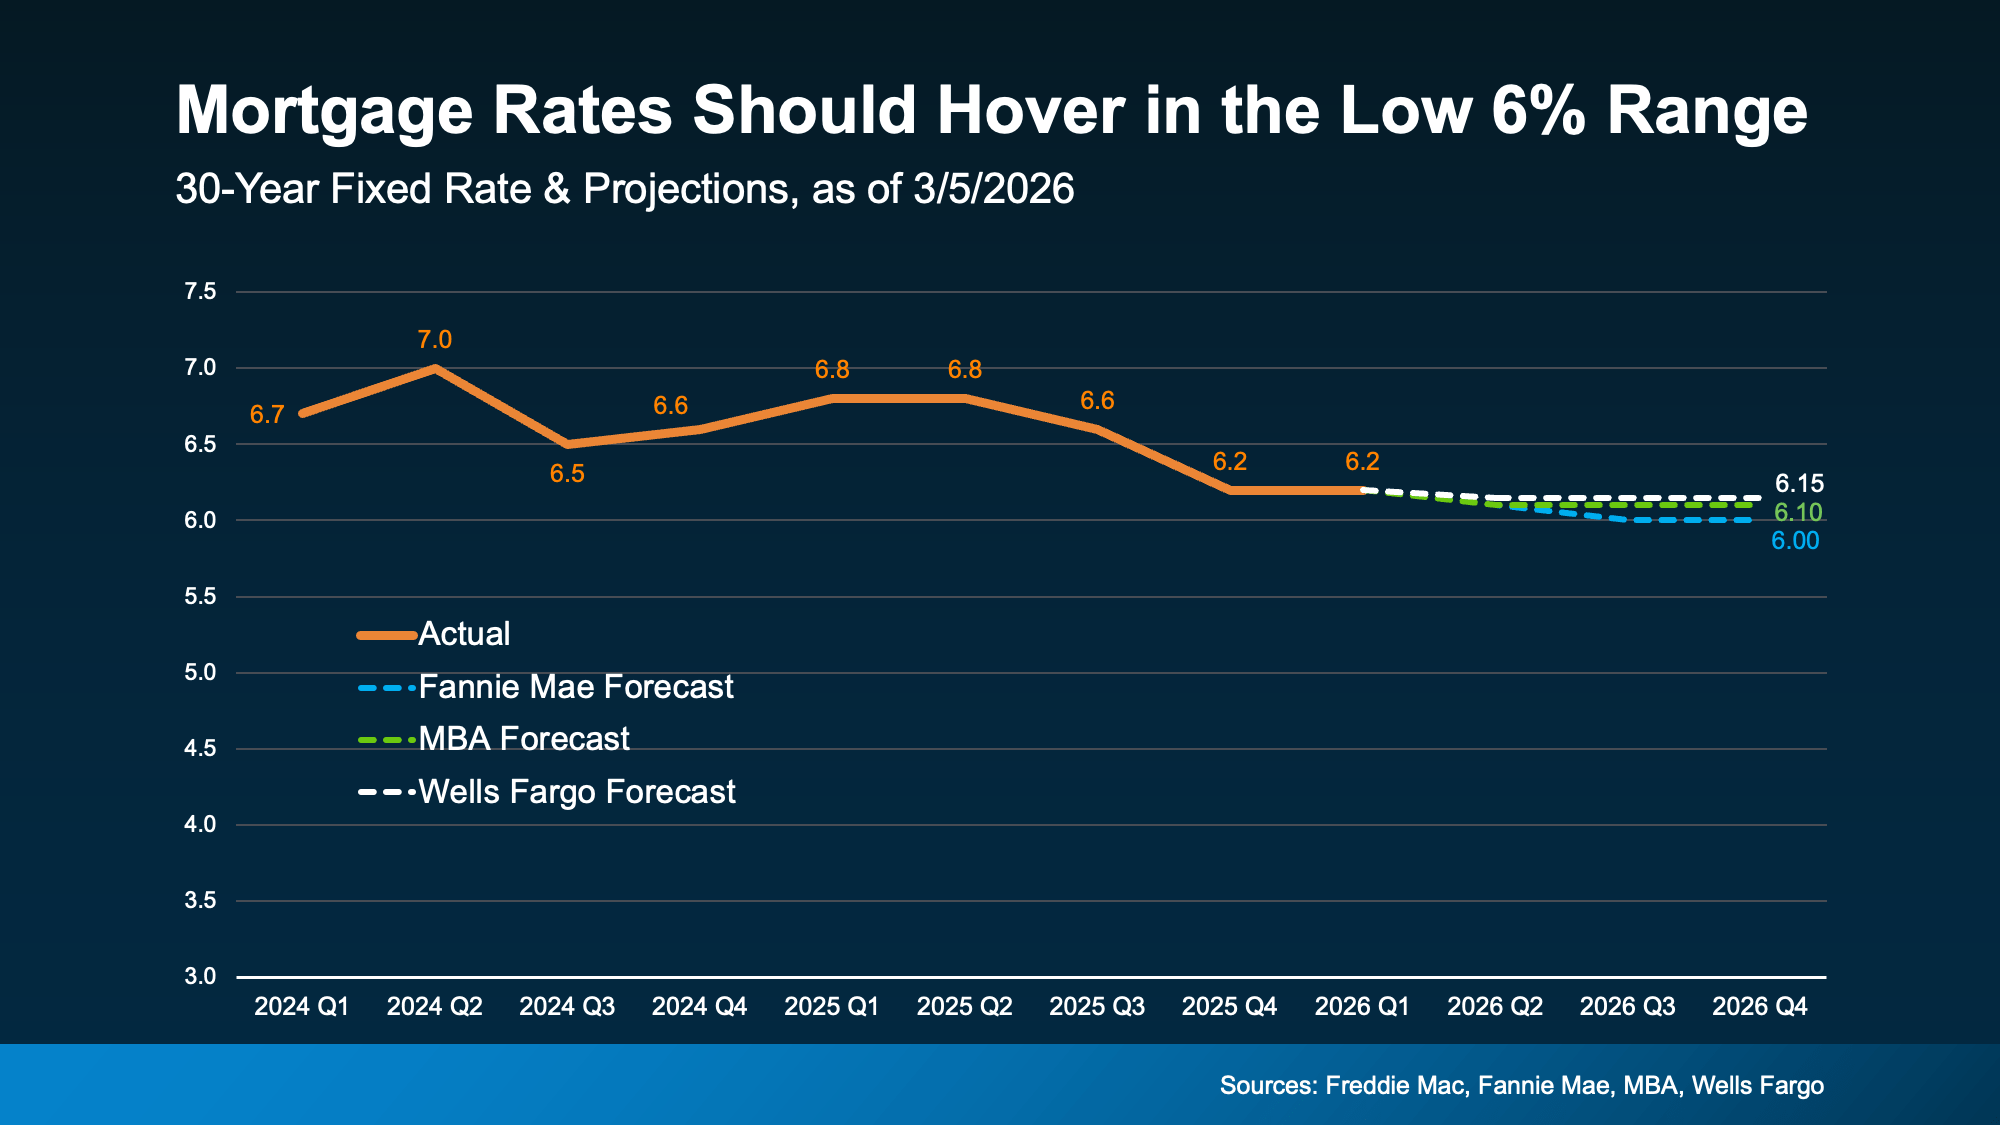
Another important piece to think about: most housing economists aren’t forecasting a long-term return to 5% territory anytime soon.
While rates will move up and down, likely hitting the high 5s here and there, the broader expectation is for mortgage rates to hover in the low 6% range this year, not stay in the 5’s or decline much more.
 While it certainly could happen, the reality is, waiting for a deep drop may not deliver the payoff you’re hoping for, if you’re holding out
The Bigger Question to Ask
Instead of asking, “Did I miss the 5s?” A better question is: “Does today’s payment work for me?”
If the monthly payment fits comfortably in your budget, and you’ve found a home that meets your needs, the difference between 6.1% and 5.9% likely isn’t the deciding factor. It might be one of them, but it shouldn’t be everything.
And remember, mortgage rates aren’t permanent. If they drop meaningfully later, refinancing is always an option. But you can’t refinance a home you didn’t buy.
Waiting Might Feel Safe, But It Isn’t Always Strategic
It’s natural to want the best possible rate. Everyone does. But sometimes buyers overestimate how much a rate in the high 5s will change things in today’s market.
Don’t miss the fact that rates have already come down. A year ago, they were in the 7s. Now? They’re hovering in the low 6s. And for a lot of people, that percentage point difference that’s already here is the real game changer.
If you paused your plans when rates were higher, now may be the right time to re-run your numbers. Not because rates are “perfect.” But because the monthly payment math might work better than you think, even with rates in the low 6s.
Before assuming you’ve missed your moment, take another look at the numbers.
You may find it never disappeared.
Bottom Line
If you’ve been sitting on the sidelines waiting for that magic five number for rates, that strategy may not pay off as much as you’d expect.
Connect with an agent or lender so you can double check the math at your price point. You may realize payments are already within your range.

Affordability Has Improved in All 50 States

3 Must-Do’s for First-Time Home Buyers

The #1 Reason Buyers Walk Away (And How To Get Ahead of It)


-

 Affordability4 weeks ago
Renting vs. Buying: The Numbers Might Surprise You
-

 For Sellers3 weeks ago
Top Mistakes Homeowners Are Making in 2026 (And How To Avoid Them)
-

 Equity4 weeks ago
How Your Equity Could Help Younger Generations Buy a Home
-

 Downsize3 weeks ago
The Hidden Advantage Repeat Buyers Have Right Now
-

 For Sellers2 weeks ago
Spring Sellers Have an Edge. Here’s Why.
-

 Equity3 weeks ago
Are Home Prices Dropping? Here’s the Real Story.
-

 Agent Value2 weeks ago
If Your House Isn’t Getting Offers, Read This.
-

 Affordability2 weeks ago
Should You Wait for Lower Rates?
You must be logged in to post a comment Login