

Economy
Not a Crash: 3 Graphs That Show How Today’s Inventory Differs from 2008
Even if you didn’t own a home at the time, you probably remember the housing crisis in 2008. That crash impacted the lives of countless people, and many now live with the worry that something like that could happen again. But rest easy, because things are different than they were back then. As Business Insider says:
“Though many Americans believe the housing market is at risk of crashing, the economists who study housing market conditions overwhelmingly do not expect a crash in 2024 or beyond.”
Here’s why experts are so confident. For the market (and home prices) to crash, there would have to be too many houses for sale, but the data doesn’t show that’s happening. Right now, there’s an undersupply, not an oversupply like the last time – and that’s true even with the inventory growth we’ve seen this year. You see, the housing supply comes from three main sources:
- Homeowners deciding to sell their houses (existing homes)
- New home construction (newly built homes)
- Distressed properties (foreclosures or short sales)
And if we look at those three main sources of inventory, you’ll see it’s clear this isn’t like 2008.
Homeowners Deciding To Sell Their Houses
Although the supply of existing (previously owned) homes is up compared to this time last year, it’s still low overall. And while this varies by local market, nationally, the current months’ supply is well below the norm, and even further below what we saw during the crash. The graph below shows this more clearly.
If you look at the latest data (shown in green), compared to 2008 (shown in red), we only have about a third of that available inventory today. 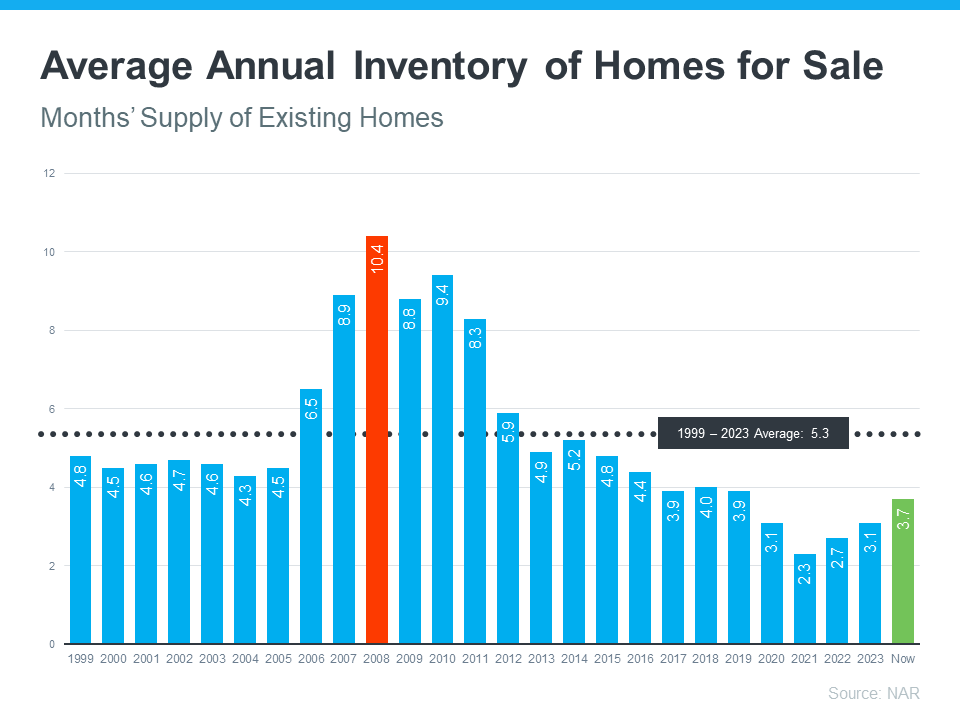
So, what does this mean? There just aren’t enough homes available to make values drop. To have a repeat of 2008, there’d need to be a lot more people selling their houses with very few buyers, and that’s not the case right now.
New Home Construction
People are also talking a lot about what’s going on with newly built houses these days, and that might make you wonder if homebuilders are overdoing it. Even though new homes make up a larger percentage of the total inventory than the norm, there’s no need for alarm. Here’s why.
The graph below uses data from the Census to show the number of new houses built over the last 52 years. The orange on the graph shows the overbuilding that happened in the lead-up to the crash. And, if you look at the red in the graph, you’ll see that builders have been underbuilding pretty consistently since then: 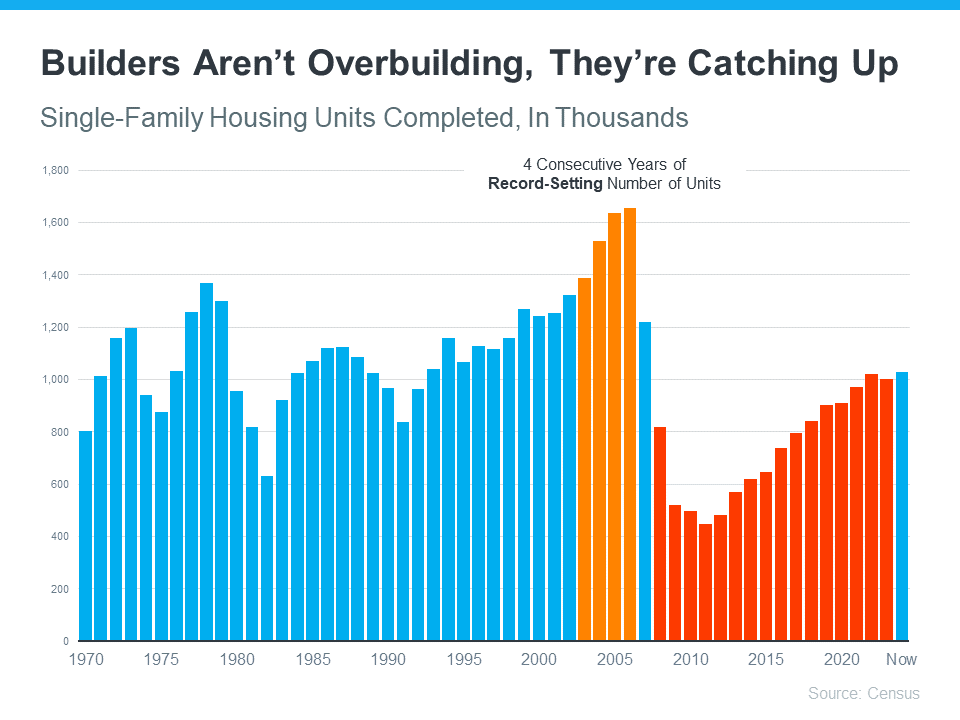
There’s just too much of a gap to make up. Builders aren’t overbuilding today, they’re catching up. A recent article from Bankrate says:
“What’s more, builders remember the Great Recession all too well, and they’ve been cautious about their pace of construction. The result is an ongoing shortage of homes for sale.”
Distressed Properties (Foreclosures and Short Sales)
The last place inventory can come from is distressed properties, including short sales and foreclosures. During the housing crisis, there was a flood of foreclosures due to lending standards that allowed many people to get a home loan they couldn’t truly afford.
Today, lending standards are much tighter, resulting in more qualified buyers and far fewer foreclosures. The graph below uses data from ATTOM to show how things have changed since the housing crash: 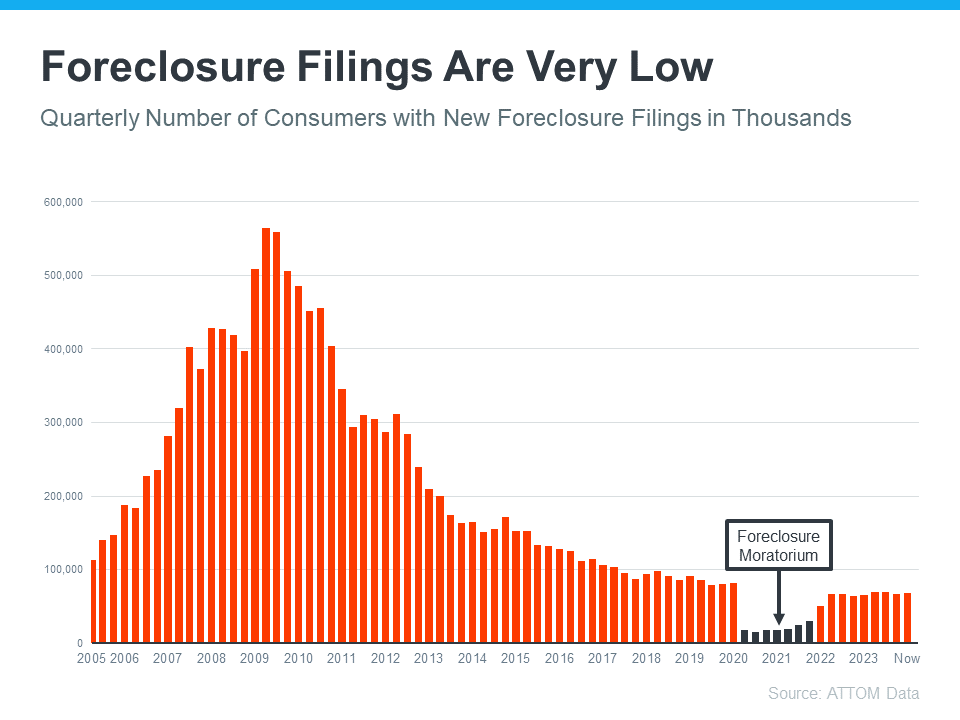
This graph makes it clear that as lending standards got tighter and buyers became more qualified, the number of foreclosures started to go down. And in 2020 and 2021, the combination of a moratorium on foreclosures (shown in black) and the forbearance program helped prevent a repeat of the wave of foreclosures we saw when the market crashed.
While you may see headlines that foreclosure volume is ticking up – remember, that’s only compared to recent years when very few foreclosures happened. We’re still below the normal level we’d see in a typical year.
What This Means for You
Inventory levels aren’t anywhere near where they’d need to be for prices to drop significantly and the housing market to crash. As Forbes explains:
“As already-high home prices continue trending upward, you may be concerned that we’re in a bubble ready to pop. However, the likelihood of a housing market crash—a rapid drop in unsustainably high home prices due to waning demand—remains low for 2024.”
Mark Fleming, Chief Economist at First American, points to the laws of supply and demand as a reason why we aren’t headed for a crash:
“There’s just generally not enough supply. There are more people than housing inventory. It’s Econ 101.”
And Lawrence Yun, Chief Economist at the National Association of Realtors (NAR), says:
“We will not have a repeat of the 2008–2012 housing market crash. There are no risky subprime mortgages that could implode, nor the combination of a massive oversupply and overproduction of homes.”
Bottom Line
The market doesn’t have enough available homes for a repeat of the 2008 housing crisis – and there’s nothing that suggests that will change anytime soon. That’s why housing experts and inventory data tell us there isn’t a crash on the horizon.

Data shows inflation is moving in the wrong direction. But before the headlines send anyone into a panic, here’s what’s actually going on, why it matters for the housing market, and what it means if you’re thinking about buying or selling.
Inflation Went Up – Here’s What That Actually Means
The government tracks inflation in a variety of ways. One is something called PCE – the Personal Consumption Expenditures Price Index. It measures how much more (or less) people are paying for goods and services compared to a year ago. And just based on your own expenses, you can probably guess which way that’s trending.
That’s the one everyone is talking about right now. Check out the yellow line to see how that’s spiked since February (see graph below). A big driver of this jump is the ongoing conflict in the Middle East, which has pushed gas and energy prices significantly higher.
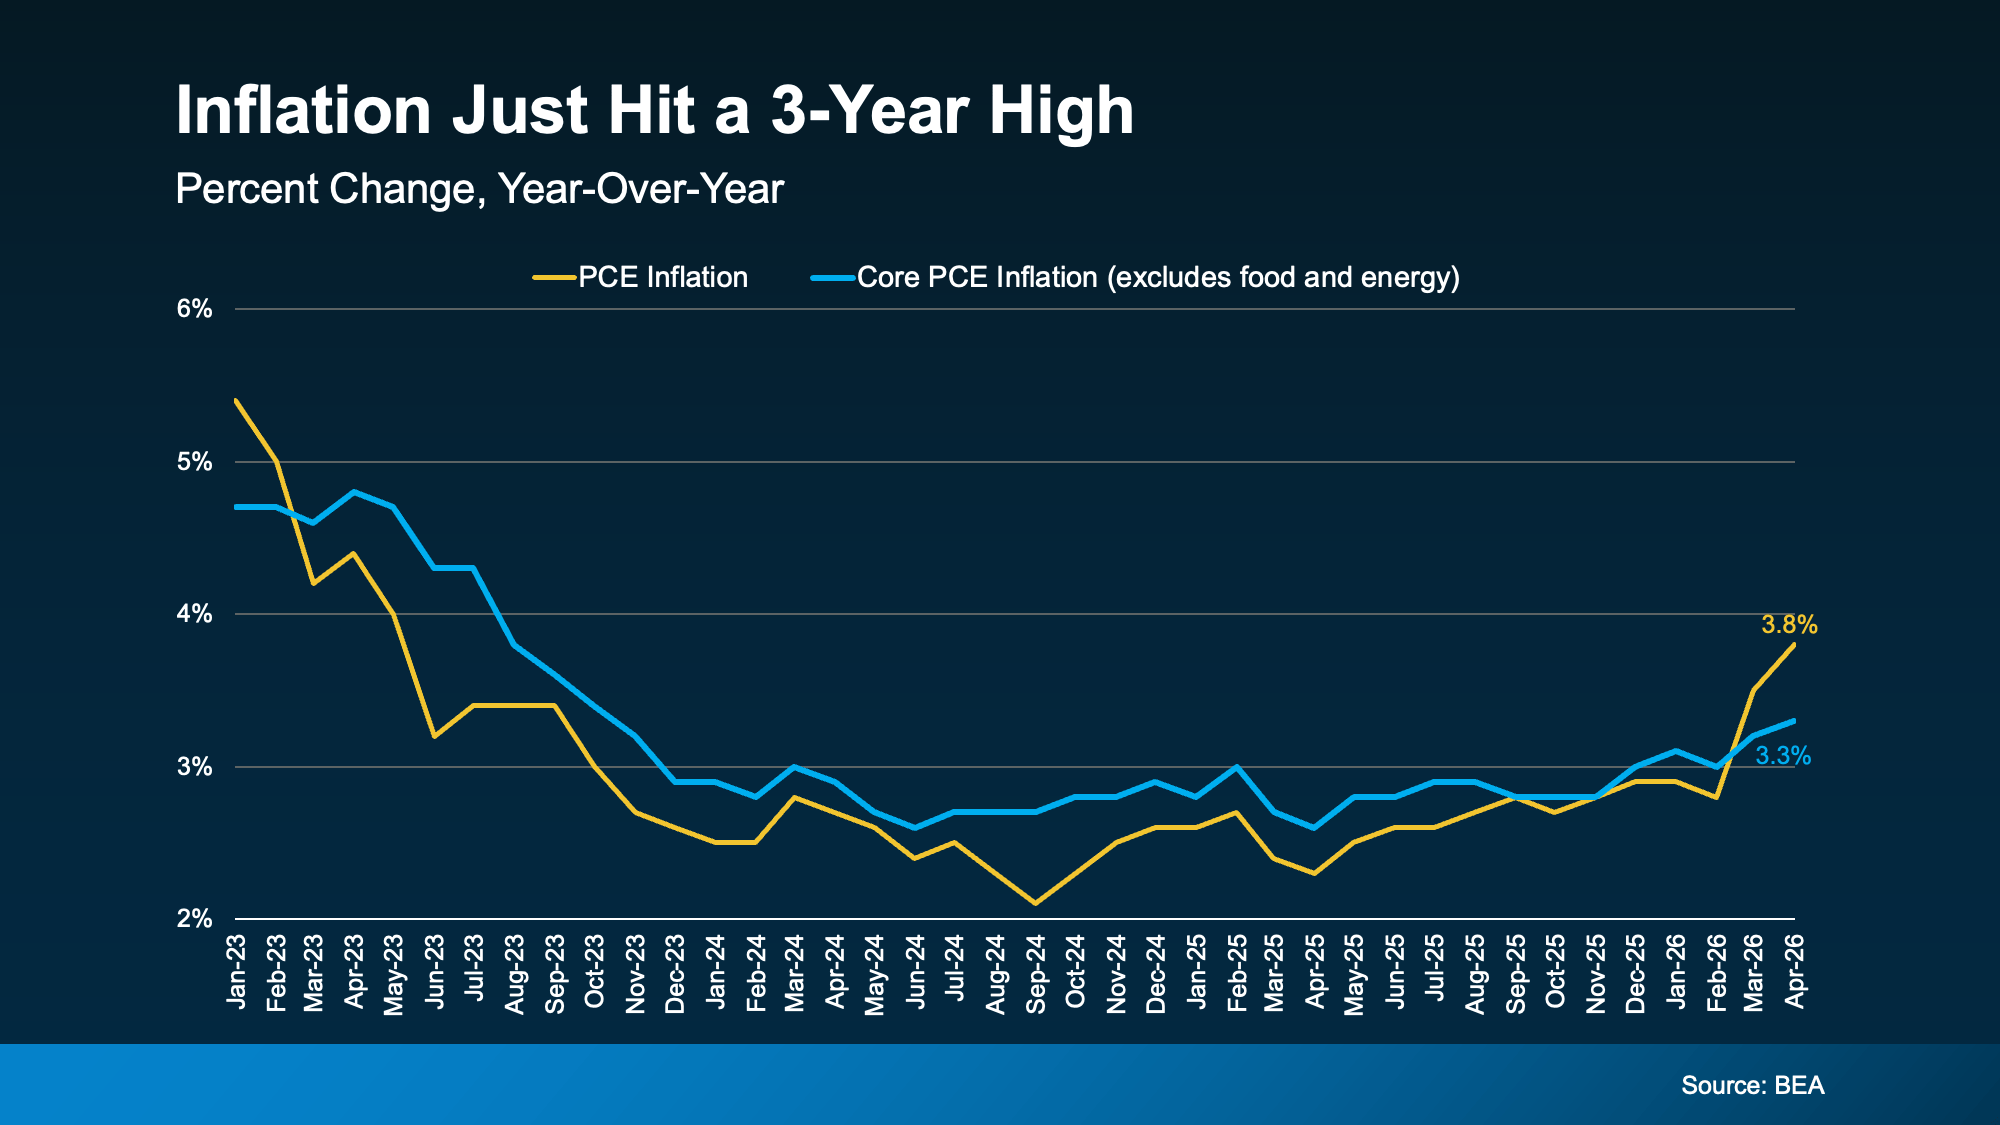
Now, you may have noticed there’s a second line. The blue line shows core PCE. That’s the same measure, but with gas and energy prices stripped out. The Federal Reserve (the Fed) actually watches this number most closely because energy prices swing around a lot and can be misleading.
And here’s the somewhat encouraging part.
Core PCE is rising, but not nearly as fast as the overall number. That suggests a good chunk of the inflation spike we’re seeing right now is tied directly to what’s happening overseas. So, when that situation settles down, inflation may settle a bit, too.
Why This Matters for Mortgage Rates
Here’s the housing connection. When inflation is high, the Fed tends to keep the Federal Funds Rate elevated or even raise it to try to taper spending and cool inflation back down. And while it’s not a one-for-one relationship, that Federal Funds Rate can have an impact on your mortgage rate when you buy.
Right now, based on the information we have, there’s roughly a 50/50 chance the Fed actually raises the Federal Funds Rate before the end of 2026, according to CME FedWatch (see graph below):
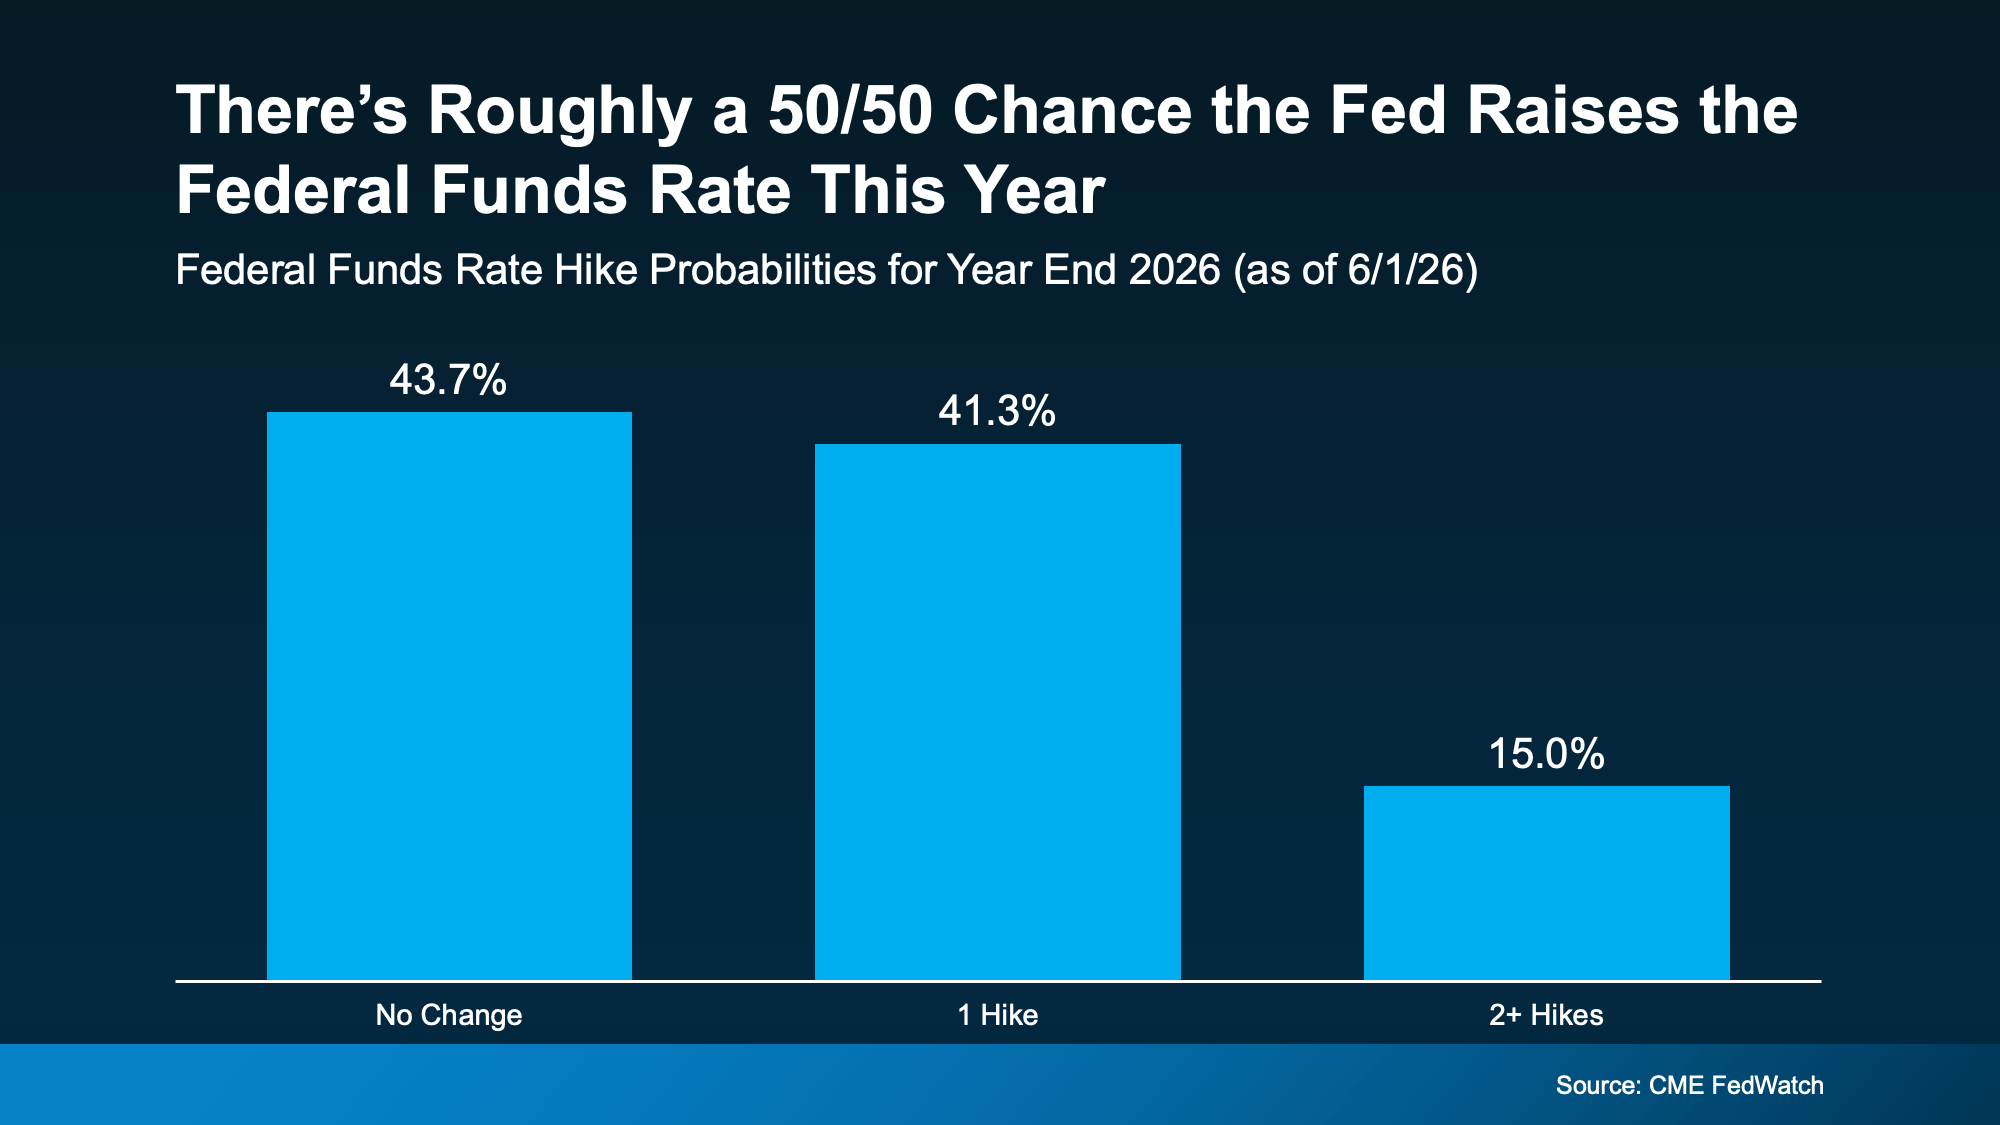
While it’s too soon to say where this goes for certain and if we’re headed for a rate hike, it does mean mortgage rates are probably not coming down as soon as most people were hoping.
If you’ve been waiting for rates to drop significantly before making a move, this report is a reminder that “higher for longer” is still very much on the table. It really all depends on where the economy goes from here. According to Bankrate:
“Oil prices and bond yields have dropped a bit . . . but they’re still way up compared to the start of spring. Until there’s a resolution to the war, look for both inflation and mortgage rates to stay high.”
But This Is Not 2008 – Not Even Close
Just remember, a tough economy does not equal a housing crash. The conditions today are very different from what led to the 2008 collapse. Here’s why:
-
Inventory is still relatively low. There’s no flood of homes hitting the market.
-
Most homeowners today have strong equity in their homes.
-
Lending standards are far stricter than they were before 2008.
-
Today’s challenge is affordability, not a wave of distressed underwater sellers.
Uncomfortable and unhealthy are not the same thing. The market feels hard right now, but “hard” and “crashing” are very different.
You Still Have Options. Here’s What To Do.
High rates don’t mean homeownership is out of reach. It just means the path looks a little different. There are real strategies that can help, depending on your situation:
-
Ask your lender about different loan options. Adjustable-rate mortgages (ARMs) or rate buydowns may help lower your monthly payment in the short term.
-
Explore first-time buyer programs, down payment assistance, or seller concessions that could help offset costs.
-
Stay in close touch with a trusted agent and lender. When rates shift, and they will, you’ll want to be ready to move fast.
The right strategy, tailored to your goals, matters a lot more than waiting for the perfect moment that may never come.
Bottom Line
Inflation is still above where the Fed wants it, and that means mortgage rates are likely to stay elevated for a while. But for people who need to move, strategy matters far more than trying to perfectly time the market.
Wondering what this means for your specific situation? Connect with a local agent or lender.

If the housing market feels confusing right now, you’re not alone.
Mortgage rates have risen. Home sales haven’t picked up like expected. And many buyers and sellers are wondering when things are going to feel easier or be more affordable.
The truth is: a lot changed over the first half of this year.
Back at the end of 2025, economists were forecasting a much stronger housing market for 2026. They expected mortgage rates to come down, affordability to improve more dramatically, and home sales to rebound.
But lingering inflation, economic uncertainty, and growing geopolitical tensions overseas pushed mortgage rates higher than expected. And because rates stayed elevated for longer, many buyers continued to hold off.
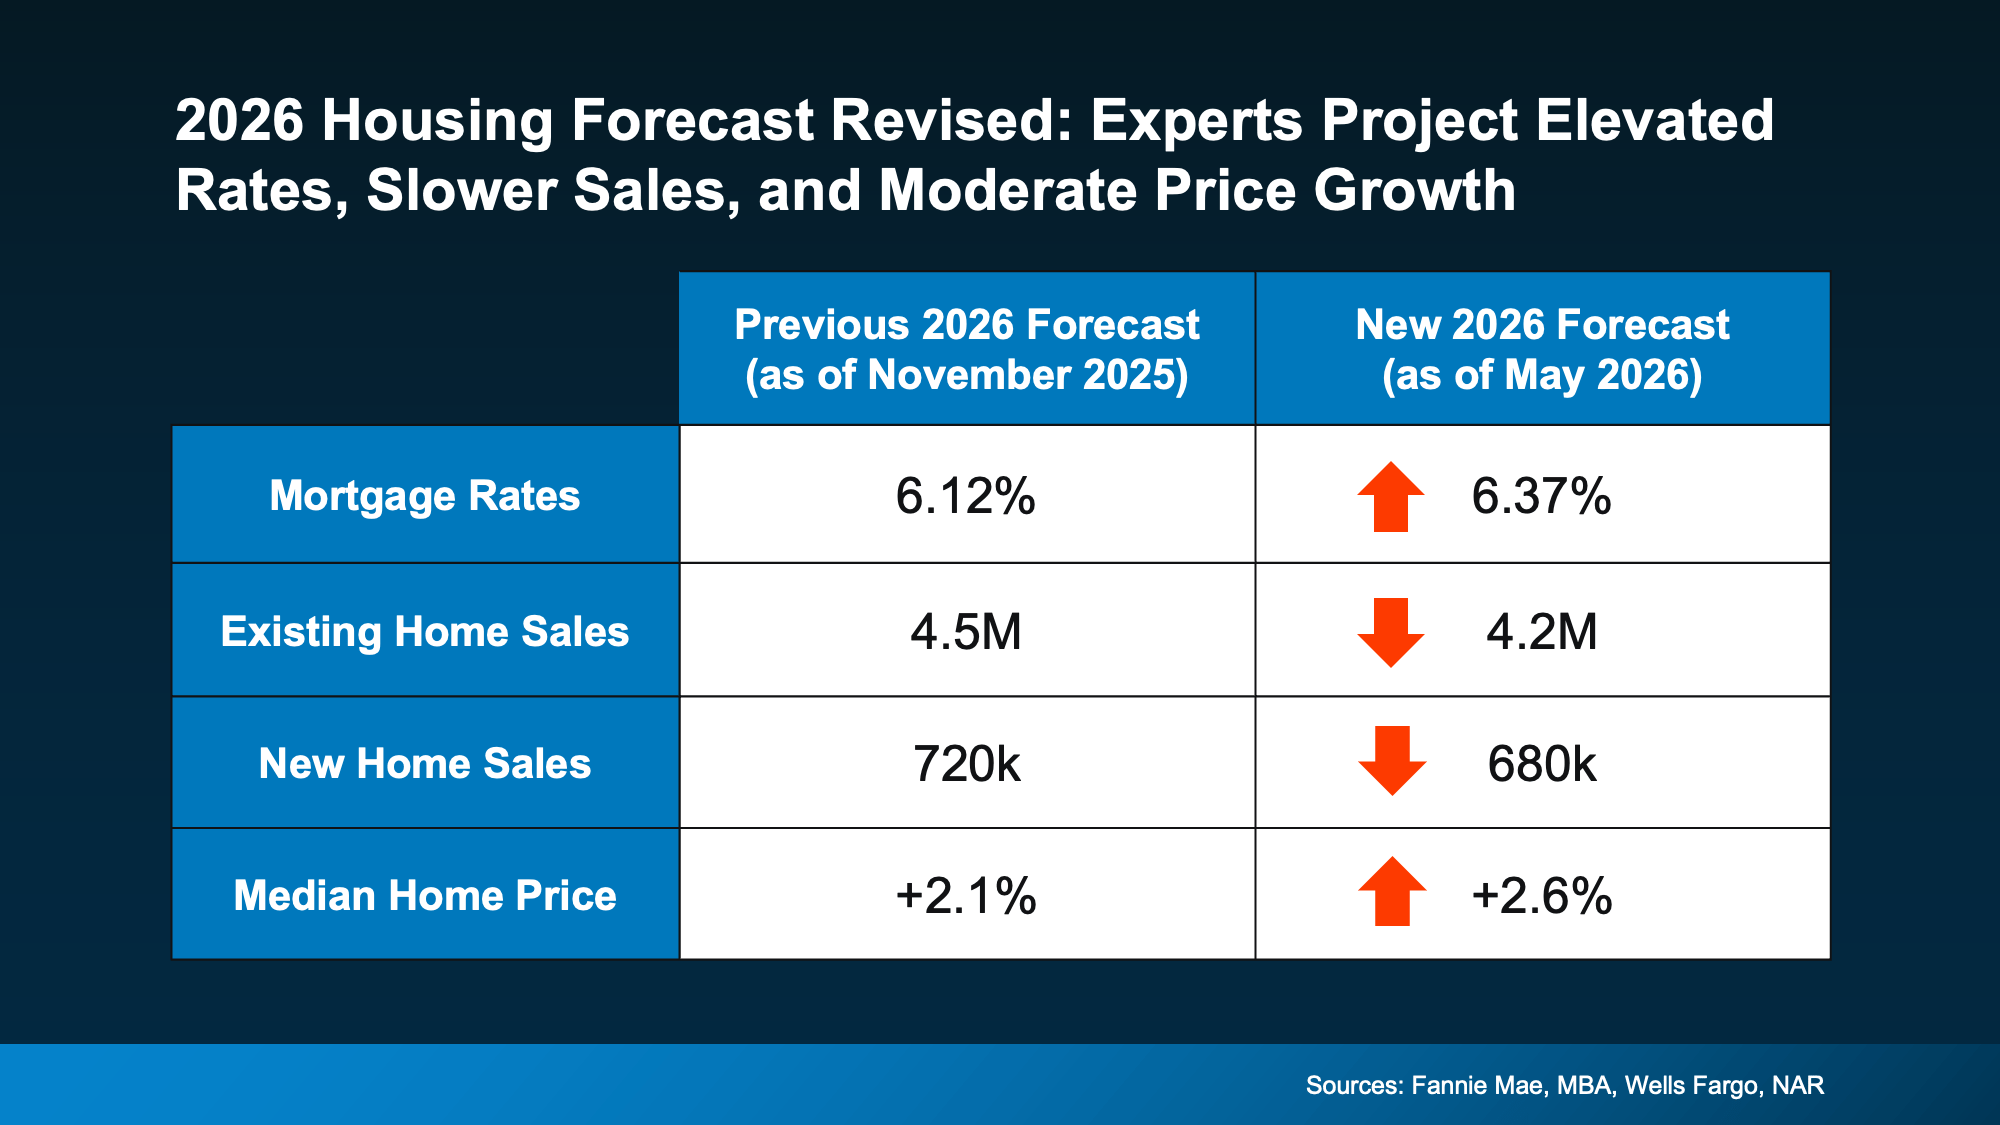
That’s why experts recently revised their housing forecasts for the rest of the year (see graph below):
So, what does this actually mean for you? Let’s break it down.
Mortgage Rates May Remain Elevated
While just about everyone wants mortgage rates to go back to the uppers 5s or low 6s we saw at the start of the year, as of right now, the experts don’t think that’s likely to happen this year.
Instead, forecasts have been updated from the low 6s they originally projected. Many industry organizations are saying rates will stay in roughly the mid 6s this year. The good news is, that’s still lower than rates were a year ago.
Of course, this is based on what we know today. If the conflict overseas comes to an end or inflation drops, this could change. But if you’re waiting for lower rates, it may not pay off in the way you expect.
Existing Home Sales Revised Lower
Back in late 2025, experts expected we’d sell an average of 4.5 million homes this year. Now? That’s dropped down a bit to 4.2 million.
That tells us something important: buyers are still hesitant because affordability remains challenging.
Higher mortgage rates have made monthly payments harder to manage, especially for first-time buyers. And that’s slowed the pace of the market compared to what was originally expected. But even though the forecast was revised down, we’re still expected to sell more homes than last year.
Once geopolitical tensions resolve and rates begin to settle down, many experts believe that group of buyers will be ready to jump back in. As Lawrence Yun, Chief Economist at NAR, explains:
“There is sizable pent-up demand that could be released into the market.”
There has already been a few glimmers of renewed hope lately. In recent months, pending homes sale have been improving month-over-month despite higher rates.
So, if you’re able to afford a home at today’s rates, it could still make sense to buy now. Because otherwise, if you wait, you’ll have more competition (and potentially fewer homes to choose from) when those others buyers jump back in.
New Home Sales Also Slowed
Builders also expected to have a stronger year. Earlier forecasts projected new home sales would top 700k in 2026. Now, economists expect we’ll be just shy of that number.
Again, mortgage rates are a major reason why.
But the upside for buyers is that builders may be even more motivated to sell. That means builder incentives, negotiation opportunities, and pricing flexibility may continue in many markets. So, if you live somewhere where there’s more new construction, this may actually be a bright spot for you.
Builders could be more ready to negotiate, and that gives you more leverage to get a better deal.
Home Prices Are Still Expected To Rise
This is one of the most important takeaways from the entire forecast. Even though sales activity is slower, on average, experts did not revise their home price forecast downward.
They still expect prices to rise nationally this year.
Why? Because while buyer demand has softened, the number of homes for sale is still relatively limited overall. That imbalance is helping support prices, even in a slower market.
Of course, conditions vary depending on where you live. Some markets are cooling more than others. But nationally, experts are still projecting steady price growth — not a major decline. And that should be a comfort whether you’re buying or selling.
Because sellers don’t want a major drop in prices. And while buyers may think they do, generally you feel better about a big purchase when it doesn’t depreciate right away.
Bottom Line
The housing market hasn’t rebounded as quickly as experts originally hoped. But that doesn’t mean it’s stalled.
Higher inflation and lingering economic uncertainty caused economists to revise their forecasts for this year. But importantly, when those two things settle down, many experts believe the market will regain its momentum.
So don’t see this revision in forecasts as a sign of trouble. See it as a temporary reaction to overall conditions and uncertainty.
If you want to know what’s happening in your local market, and what it could mean for your plans for the rest of this year, talk to a local agent.

Let’s be real with each other for a second about affordability. Because you deserve someone who will be honest and transparent about what’s going on, especially if you’ve got a move on your mind.
Here’s the full picture of what’s happening and why. The good – and the bad. So, you know what it truly means for your move. Because while rates are certainly a big part of affordability, they’re not the only factor at play.
Mortgage Rates Have Been Rising
After a year or more of rates trending down, they’ve started to climb again. And, if you’re looking to buy, that’s not what you want to see. But it has happened. And here’s why.
Uncertainty is the enemy of mortgage rates.
And with lingering global uncertainty, ongoing tensions in the Middle East, and inflation refusing to fully cool off, there’s a lot that’s having an effect on rates. Colin Robertson, Founder of The Truth About Mortgage, put it plainly:
“You can’t have $100 a barrel oil and not expect inflation to rise, which translates to higher bond yields and mortgage rates.”
Take a look at the graph below. It uses data from Mortgage News Daily to show just how much all of those factors have had an impact:
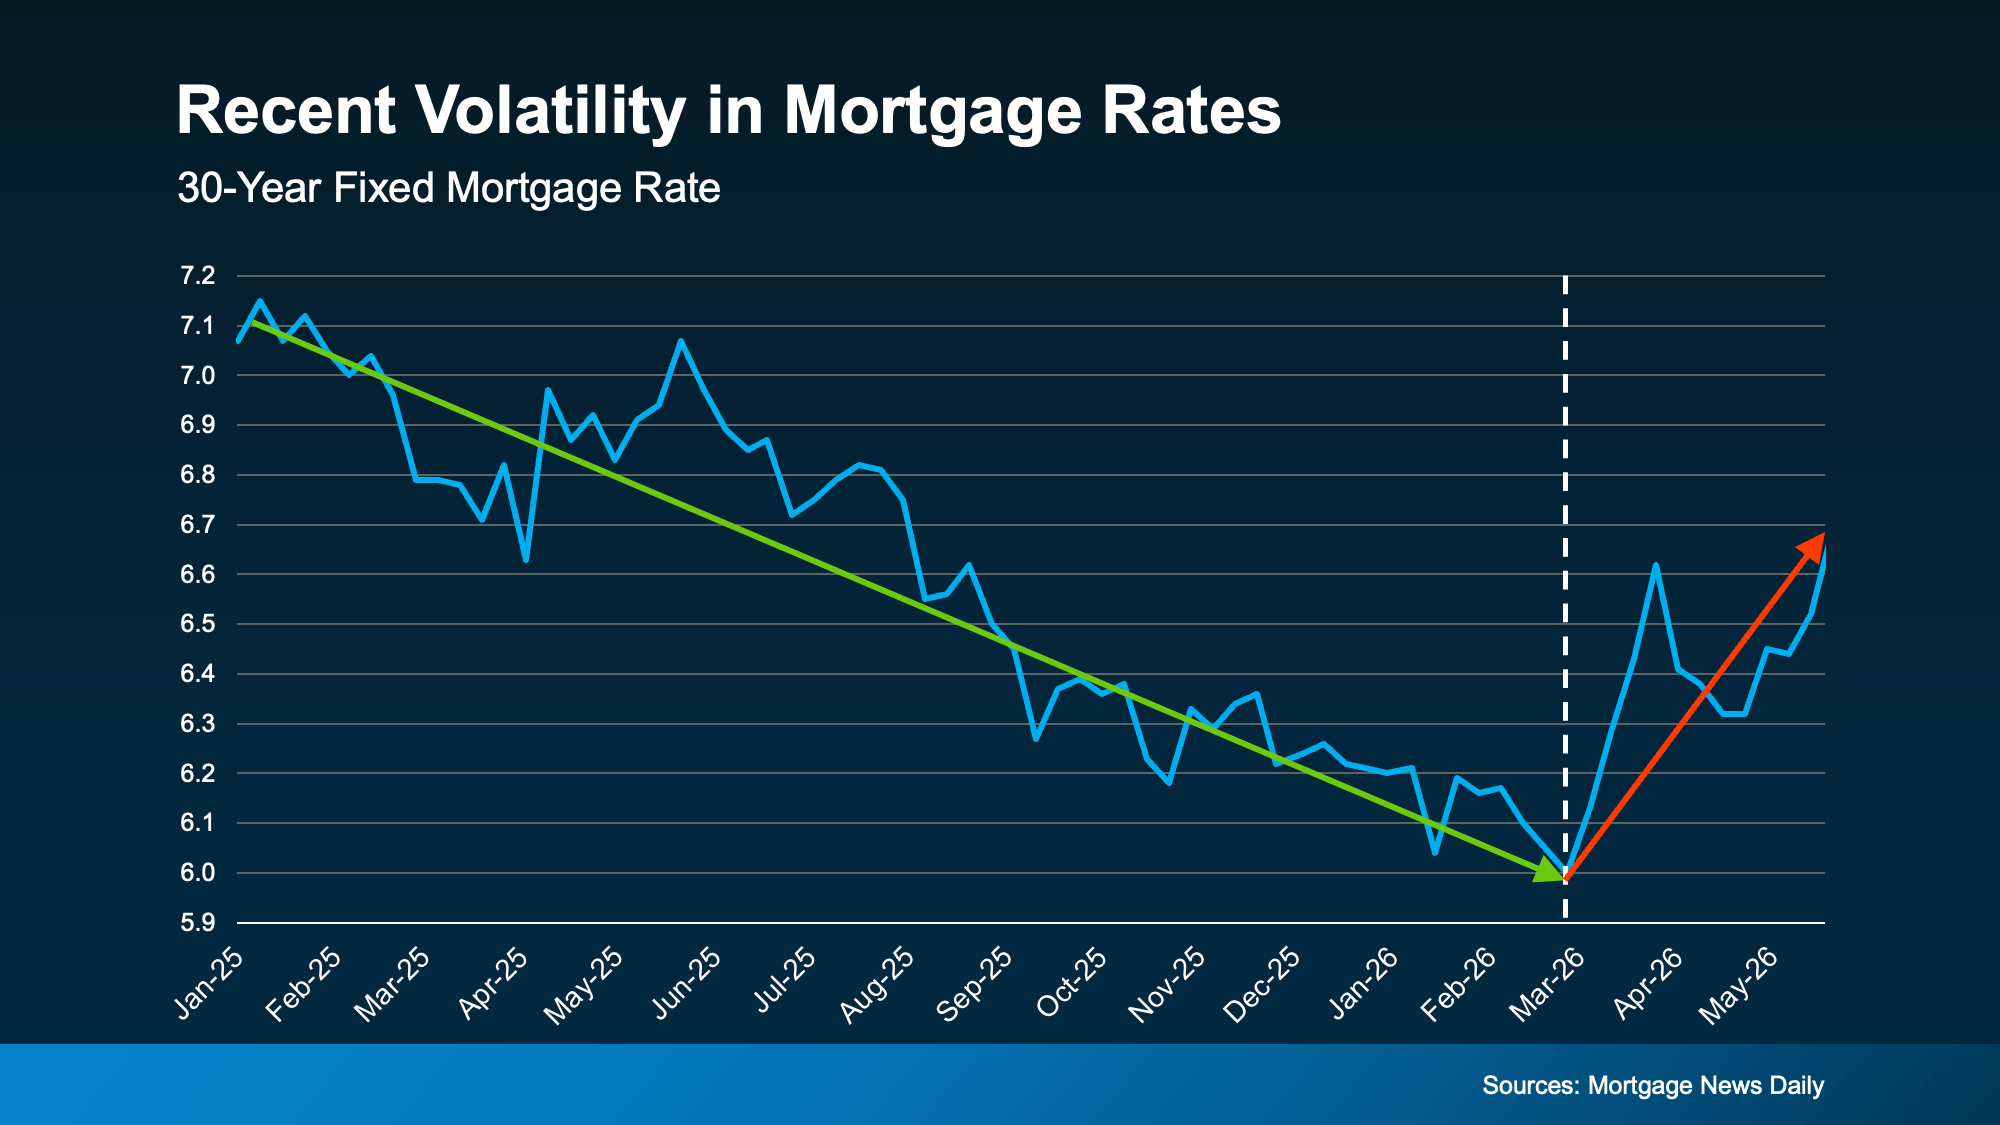 It’s a pretty sharp contrast from where we’ve been, in a relatively short window. And it’s probably making you wonder: Should I just wait this out? Will rates fall when the uncertainty eases?
It’s possible. But it all depends on how the ongoing geopolitical conflict plays out and whether inflation continues to run hot afterwards – and for how long.
Rates probably aren’t heading down until both of those things improve. And even when that does happen, experts agree rates likely won’t be dramatically lower – maybe in the low to mid-6s. That’s the reality, and it’s worth knowing.
So, should you wait for lower rates? The general consensus is, if you can afford to buy and you find a home you like, it’s still worth it. Because no one knows for sure when rates will start to come back down – and how long do you really want to put your life on hold?
Wages Are Outpacing Home Prices
You’ve probably heard that inflation is making everything more expensive, and there’s no shortage of headlines about the cost-of-living outpacing paychecks. It’s a legitimate concern. And maybe you’re feeling the pinch yourself. But here’s what doesn’t make the headlines. It’s not all bad news.
Data from the Federal Reserve Bank of Atlanta and Redfin shows wages have actually been growing faster than home prices.
-
Recently, wages have been increasing at around 4% year-over-year.
-
And home price growth is closer to 2% year-over-year.
As a buyer, you want your income to rise faster than prices because that helps make your purchase more manageable financially, and it quietly chips away at the affordability challenge over time. That’s exactly what we’re seeing lately. And every little bit is going to help.
A big reason wages have been gaining ground on home prices? Home prices have actually stayed pretty steady.
Existing Home Prices Have Held Steady
Check out the graph below. It shows home price data from the National Association of Realtors (NAR) over the past 4 years. Notice anything? There’s been no dramatic runup, and no crash either. Just relative stability and slow growth:
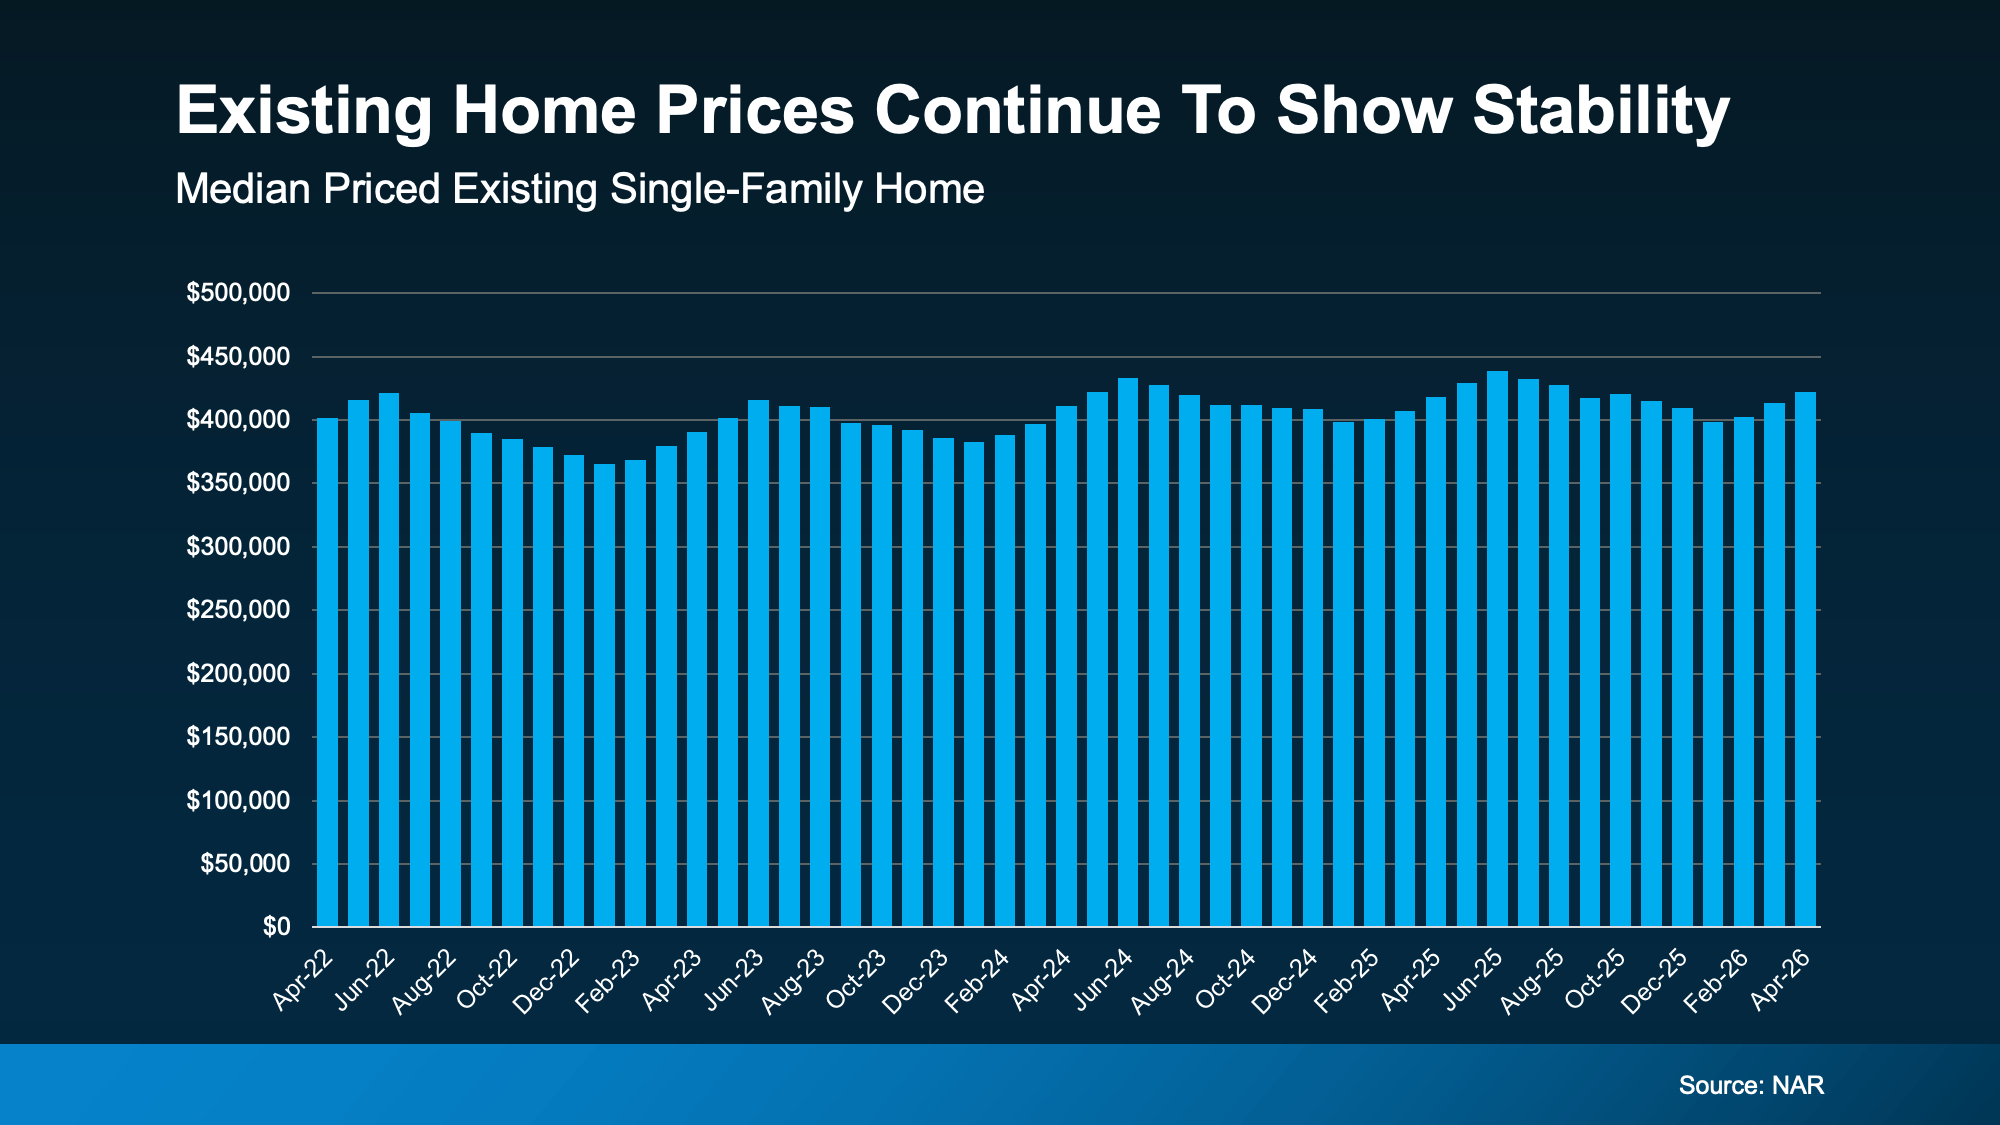
Part of what’s keeping prices this stable is that buyers finally have more choices. That means less competition, more negotiating power, and more time to find the home that actually fits your life, not just the one you had to grab before someone else did.
And that gives you a chance to hopefully find something that works for your budget, even with today’s rates. At the same time, you’re not losing ground pricewise while you take time to make a careful decision.
Bottom Line
Yes, rates have been volatile, and global instability is keeping them from settling down anytime soon. There’s no sugarcoating that. But the full picture of affordability is more nuanced than the headlines suggest.
Want to run the real numbers for your situation? Talk with a local real estate agent. They’d love to show you what’s actually possible in today’s market. Reach out to set up a quick, no-pressure conversation.

Two Big Reasons To Move This Summer

Lower Asking Prices Are a Win for Today’s Buyers

Could Moving a Bit Further Out Change Everything About Your Budget?


-

 Equity3 weeks ago
Record High Mortgage Debt Sounds Scary. Here’s What the Headlines Leave Out.
-

 Agent Value4 weeks ago
The Pricing Mistake That Could Cost You Your Sale
-
 Equity4 weeks ago
Are Home Prices Going To Fall?
-
 Affordability3 weeks ago
Newly Built Home Prices Hit a 5-Year Low
-

 Affordability3 weeks ago
What Most Veterans Don’t Know About Their VA Home Loan Benefit
-

 Affordability2 weeks ago
The Truth About Affordability Today
-

 For Sellers2 weeks ago
The Real Reason Some People Are Still Moving Right Now
-

 Economy1 week ago
The Mid-Year Housing Market Update: Why Forecasts Changed in 2026
You must be logged in to post a comment Login