
For Buyers
5 Simple Graphs Proving This Is NOT Like the Last Time
With all of the volatility in the stock market and uncertainty about the Coronavirus (COVID-19), some are concerned we may be headed for another housing crash like the one we experienced from 2006-2008. The feeling is understandable. Ali Wolf, Director of Economic Research at the real estate consulting firm Meyers Research, addressed this point in a recent interview:
“With people having PTSD from the last time, they’re still afraid of buying at the wrong time.”
There are many reasons, however, indicating this real estate market is nothing like 2008. Here are five visuals to show the dramatic differences.
1. Mortgage standards are nothing like they were back then.
During the housing bubble, it was difficult NOT to get a mortgage. Today, it is tough to qualify. The Mortgage Bankers’ Association releases a Mortgage Credit Availability Index which is “a summary measure which indicates the availability of mortgage credit at a point in time.” The higher the index, the easier it is to get a mortgage. As shown below, during the housing bubble, the index skyrocketed. Currently, the index shows how getting a mortgage is even more difficult than it was before the bubble.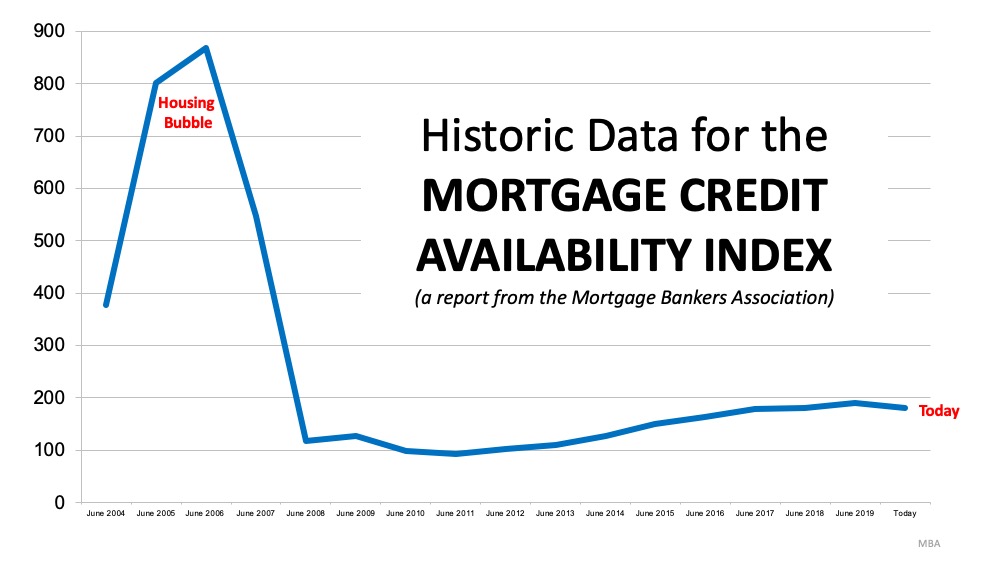
2. Prices are not soaring out of control.
Below is a graph showing annual house appreciation over the past six years, compared to the six years leading up to the height of the housing bubble. Though price appreciation has been quite strong recently, it is nowhere near the rise in prices that preceded the crash.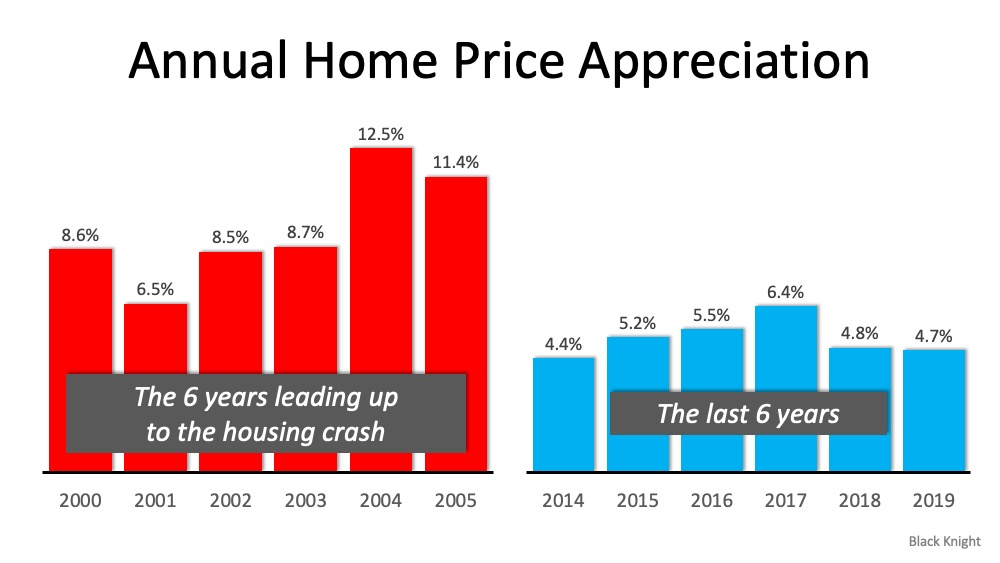 There’s a stark difference between these two periods of time. Normal appreciation is 3.6%, so while current appreciation is higher than the historic norm, it’s certainly not accelerating beyond control as it did in the early 2000s.
3. We don’t have a surplus of homes on the market. We have a shortage.
The months’ supply of inventory needed to sustain a normal real estate market is approximately six months. Anything more than that is an overabundance and will causes prices to depreciate. Anything less than that is a shortage and will lead to continued appreciation. As the next graph shows, there were too many homes for sale in 2007, and that caused prices to tumble. Today, there’s a shortage of inventory which is causing an acceleration in home values.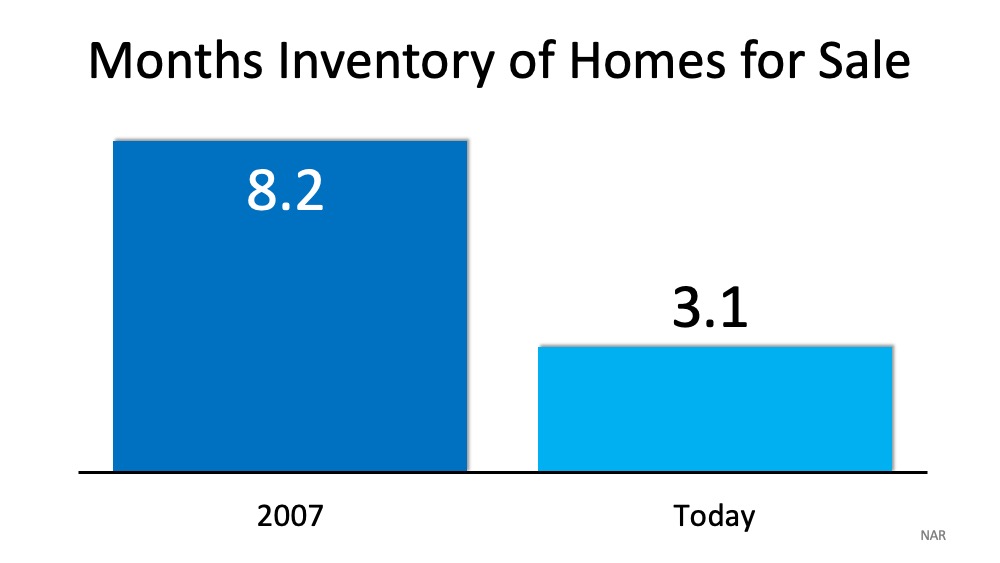
4. Houses became too expensive to buy.
The affordability formula has three components: the price of the home, the wages earned by the purchaser, and the mortgage rate available at the time. Fourteen years ago, prices were high, wages were low, and mortgage rates were over 6%. Today, prices are still high. Wages, however, have increased and the mortgage rate is about 3.5%. That means the average family pays less of their monthly income toward their mortgage payment than they did back then. Here’s a graph showing that difference: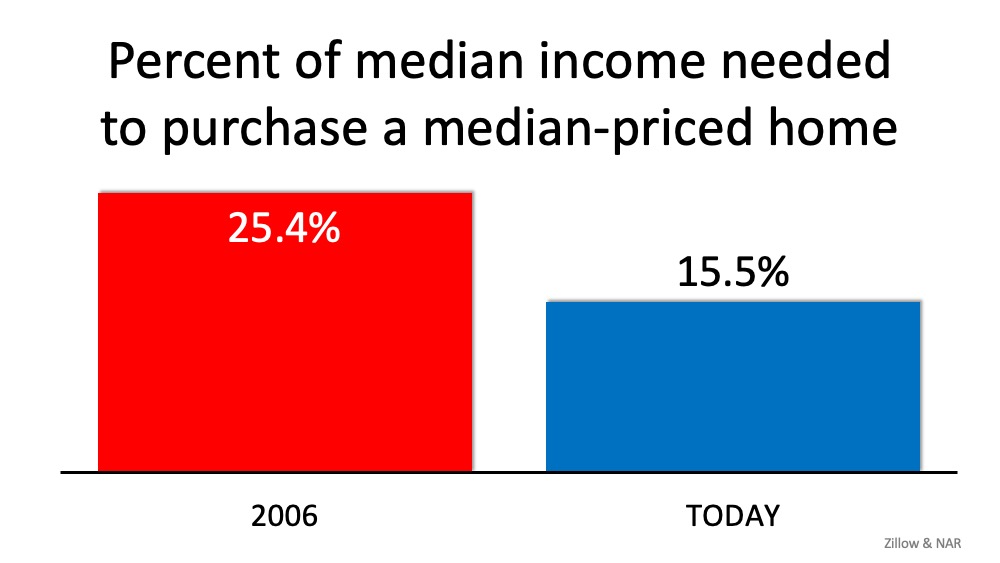
5. People are equity rich, not tapped out.
In the run-up to the housing bubble, homeowners were using their homes as a personal ATM machine. Many immediately withdrew their equity once it built up, and they learned their lesson in the process. Prices have risen nicely over the last few years, leading to over fifty percent of homes in the country having greater than 50% equity. But owners have not been tapping into it like the last time. Here is a table comparing the equity withdrawal over the last three years compared to 2005, 2006, and 2007. Homeowners have cashed out over $500 billion dollars less than before: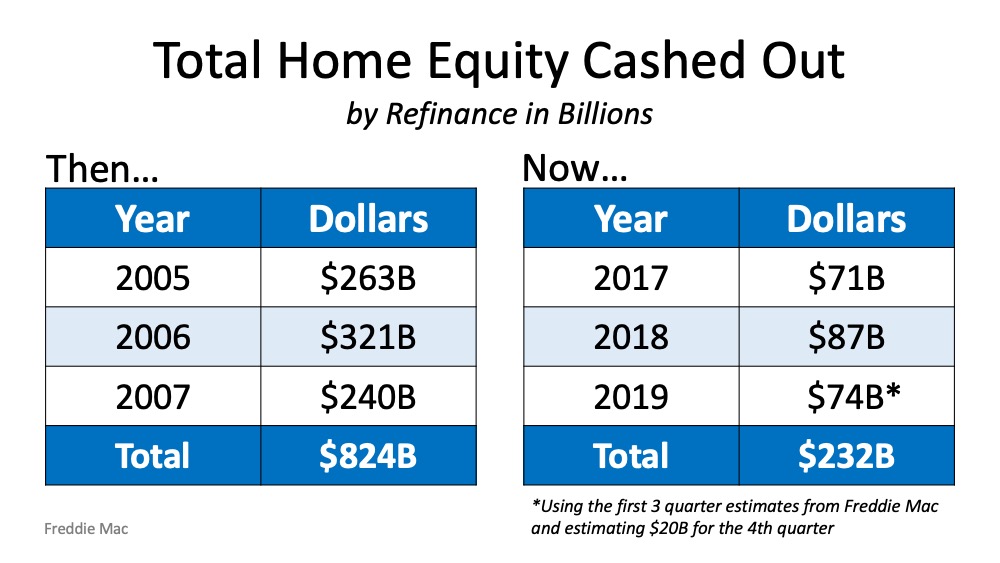 During the crash, home values began to fall, and sellers found themselves in a negative equity situation (where the amount of the mortgage they owned was greater than the value of their home). Some decided to walk away from their homes, and that led to a rash of distressed property listings (foreclosures and short sales), which sold at huge discounts, thus lowering the value of other homes in the area. That can’t happen today.
Bottom Line
If you’re concerned we’re making the same mistakes that led to the housing crash, take a look at the charts and graphs above to help alleviate your fears.

Today’s home prices have a lot of buyers – especially first-time buyers – wondering if there’s even anything out there that’s in their budget. But owning a home may be more within reach than you think. Sometimes, it just means considering a different type of home.
Condos and townhomes can be a great way to buy without stretching every last dollar. And right now, two things make them worth a serious look.
There Are More Condos and Townhomes To Choose From
Maybe you feel like there’s just nothing out there for you, and you’ve exhausted all your options. But have you considered condos or townhomes? A lot of buyers start by looking for a single-family, detached home without even realizing what that search omits from their pool of choices.
According to HousingWire Data, there were 233,030 condos and townhomes for sale this June. That’s more than any June in at least the past decade, and more than double the number available back in 2022 (see graph below):
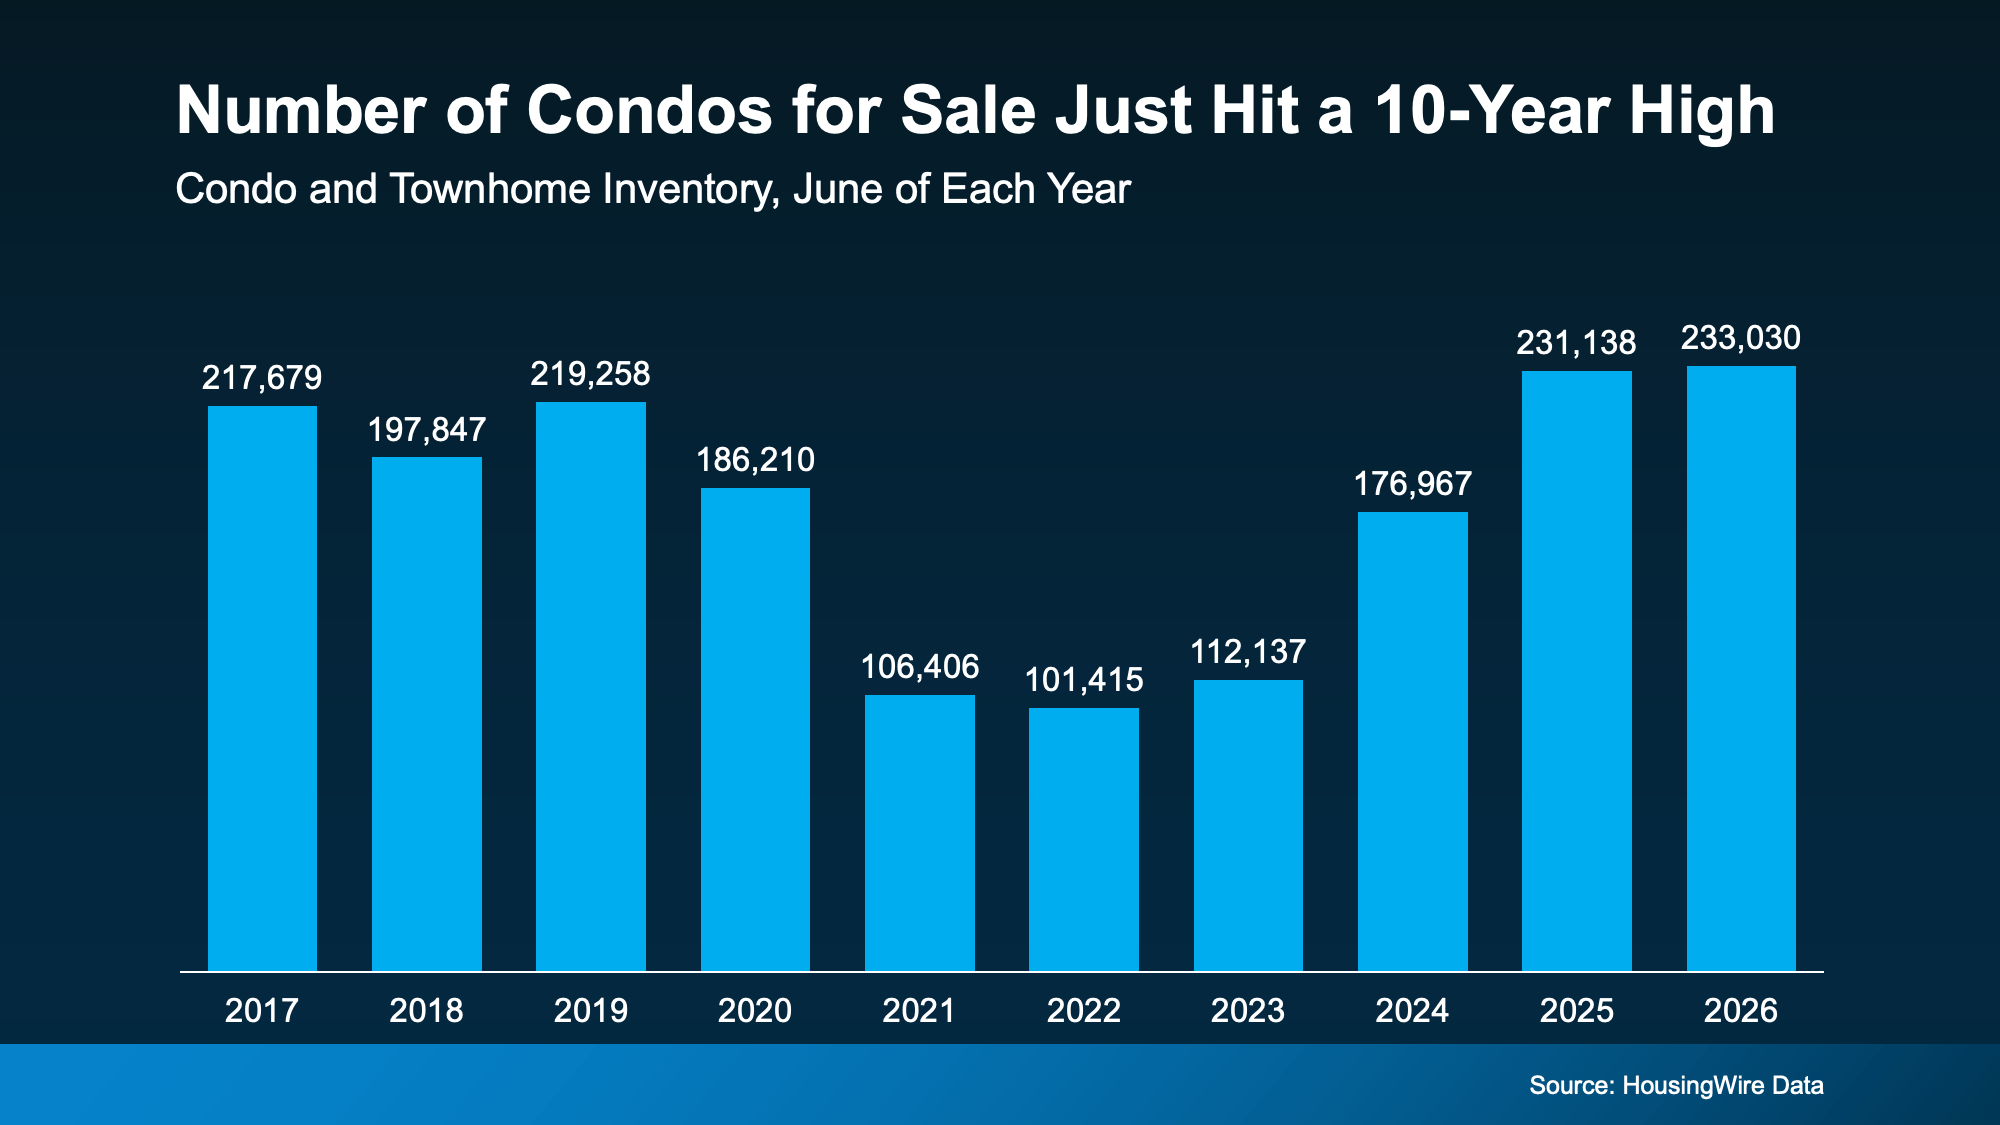
That means there are more options out there in this segment of the market – and that’s especially good news for first-time buyers. These types of homes can be a great way to break into the market for less.
Just remember, that’s the national number. What’s available will depend on where you’re looking. But generally speaking, more options means less competition, more time to decide, and more room to negotiate.
They Also Tend To Cost Less Than Single-Family Homes
Price is the other big draw. According to the National Association of Realtors (NAR), the median condo price was $380,000 in June. In contrast, the median single-family home price was $446,400 (see graph below):

That’s a difference of more than $66,000.
A big reason why? Condos are usually smaller than single-family homes. And smaller homes can come with smaller price tags.
And if you don’t need all that extra space, that lower entry price could be exactly what gets you through the door.
Condo or Townhome? How They’re Different.
For buyers who feel priced out of the market, a condo or townhome could be a way in. But there are some things to know. Before you start checking out homes, it’s good to understand how these two compare to each other – and to a single-family home.
-
With a single-family detached home, you own the house and the land it sits on, and you don’t share any walls with neighbors. That means the most space and privacy. But it also usually comes with a higher tag, and all the maintenance is on you.
-
With a townhome, you own the building and the lot it sits on. They’re usually multi-level, so you get more space, and you share two walls at most. You’ll also have more say over how your home looks and how repairs get done, but more of that upkeep falls on you.
-
With a condo, you own just the inside of your unit and may have access to community features like a pool or gym. The building and shared space belong to everyone who lives there, which means you have less maintenance responsibilities. But you’ll also likely have more neighbors around you, less control over building decisions, and higher HOA fees since the HOA handles the exterior and common areas.
Bottom Line
A condo or townhome could be your path to owning a home without blowing your budget. Connect with a local real estate agent to see what’s for sale in your area and figure out which type of home fits your lifestyle, and your bottom line.
If you’ve thought about buying a home in the past few years, you may have run into two frustrations: asking prices that kept climbing and too few homes to choose from.
In many places, both sticking points are letting up this summer, with lower asking prices and more homes for sale. Let’s look at the trends, and what they mean for your search.
Sellers Are Pricing To Attract Buyers
According to Realtor.com, the national median asking price was $430,000 in June, nearly $11,000 under what it was the year before (see graph below):
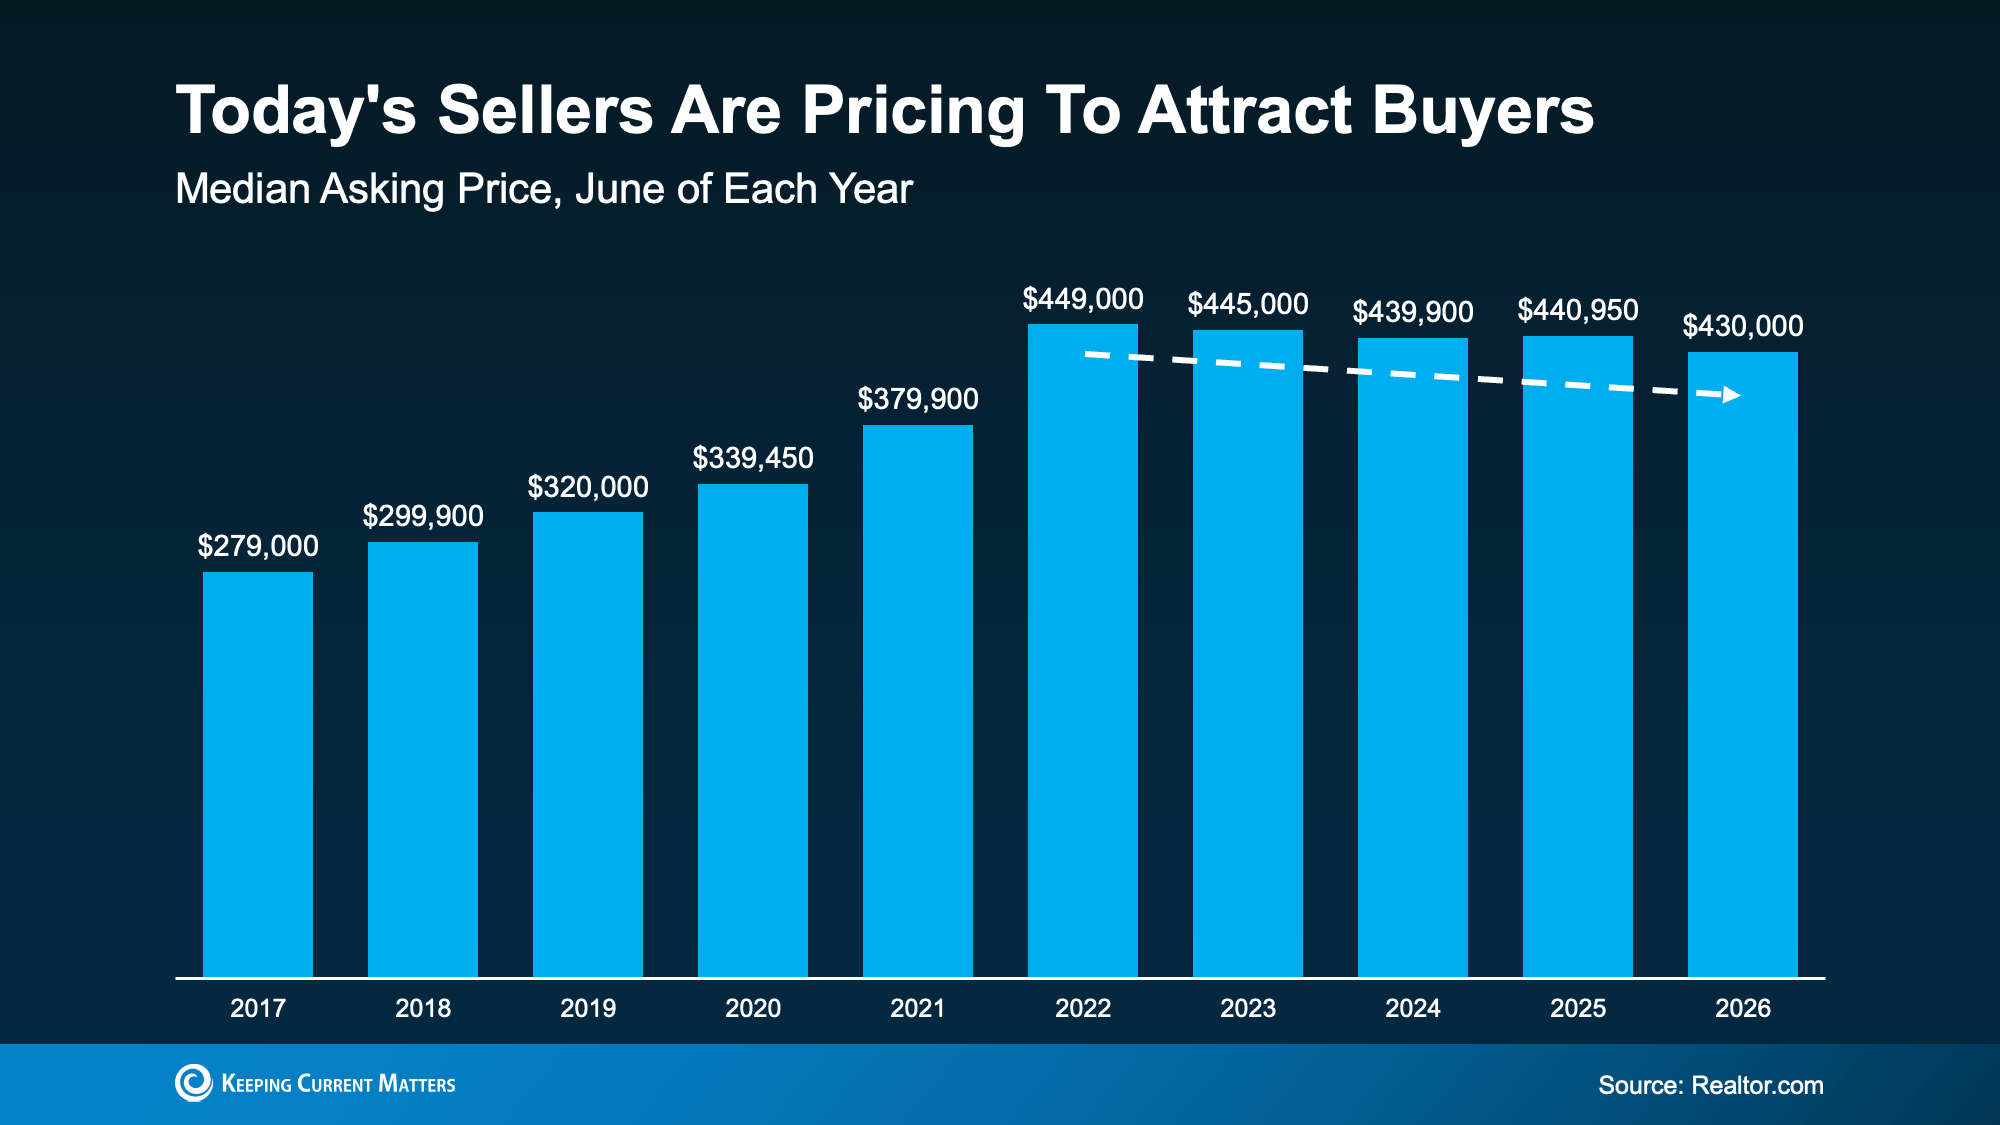
That’s the eighth month in a row that the typical asking price has dipped below where they were the previous year, according to the same Realtor.com report.
And while falling prices can sound worrying, this isn’t a sign of an impending crash. We’re talking about asking prices, not sold prices. This is a sign that today’s sellers are meeting the market where it is and pricing to draw buyers. And that’s actually something normal we’d expect from the market. As Danielle Hale, Chief Economist at Realtor.com, puts it:
“Sellers are reading market conditions and are pricing accordingly from the start rather than listing high and cutting later, and buyers are taking note and making bids. This is a welcome sign that we are in a functioning market.”
Asking prices were never going to climb forever – now they’re just settling closer to what buyers can actually pay. That signals a healthier market, and sellers re-adjusting their expectations.
More Homes Are Available Now
If you’ve spent the past few years watching homes disappear before you could even schedule a tour, this is for you.
Supply is starting to catch up. According to Realtor.com, the number of homes listed for sale in June was the highest June number we’ve seen in three years (see graph below):
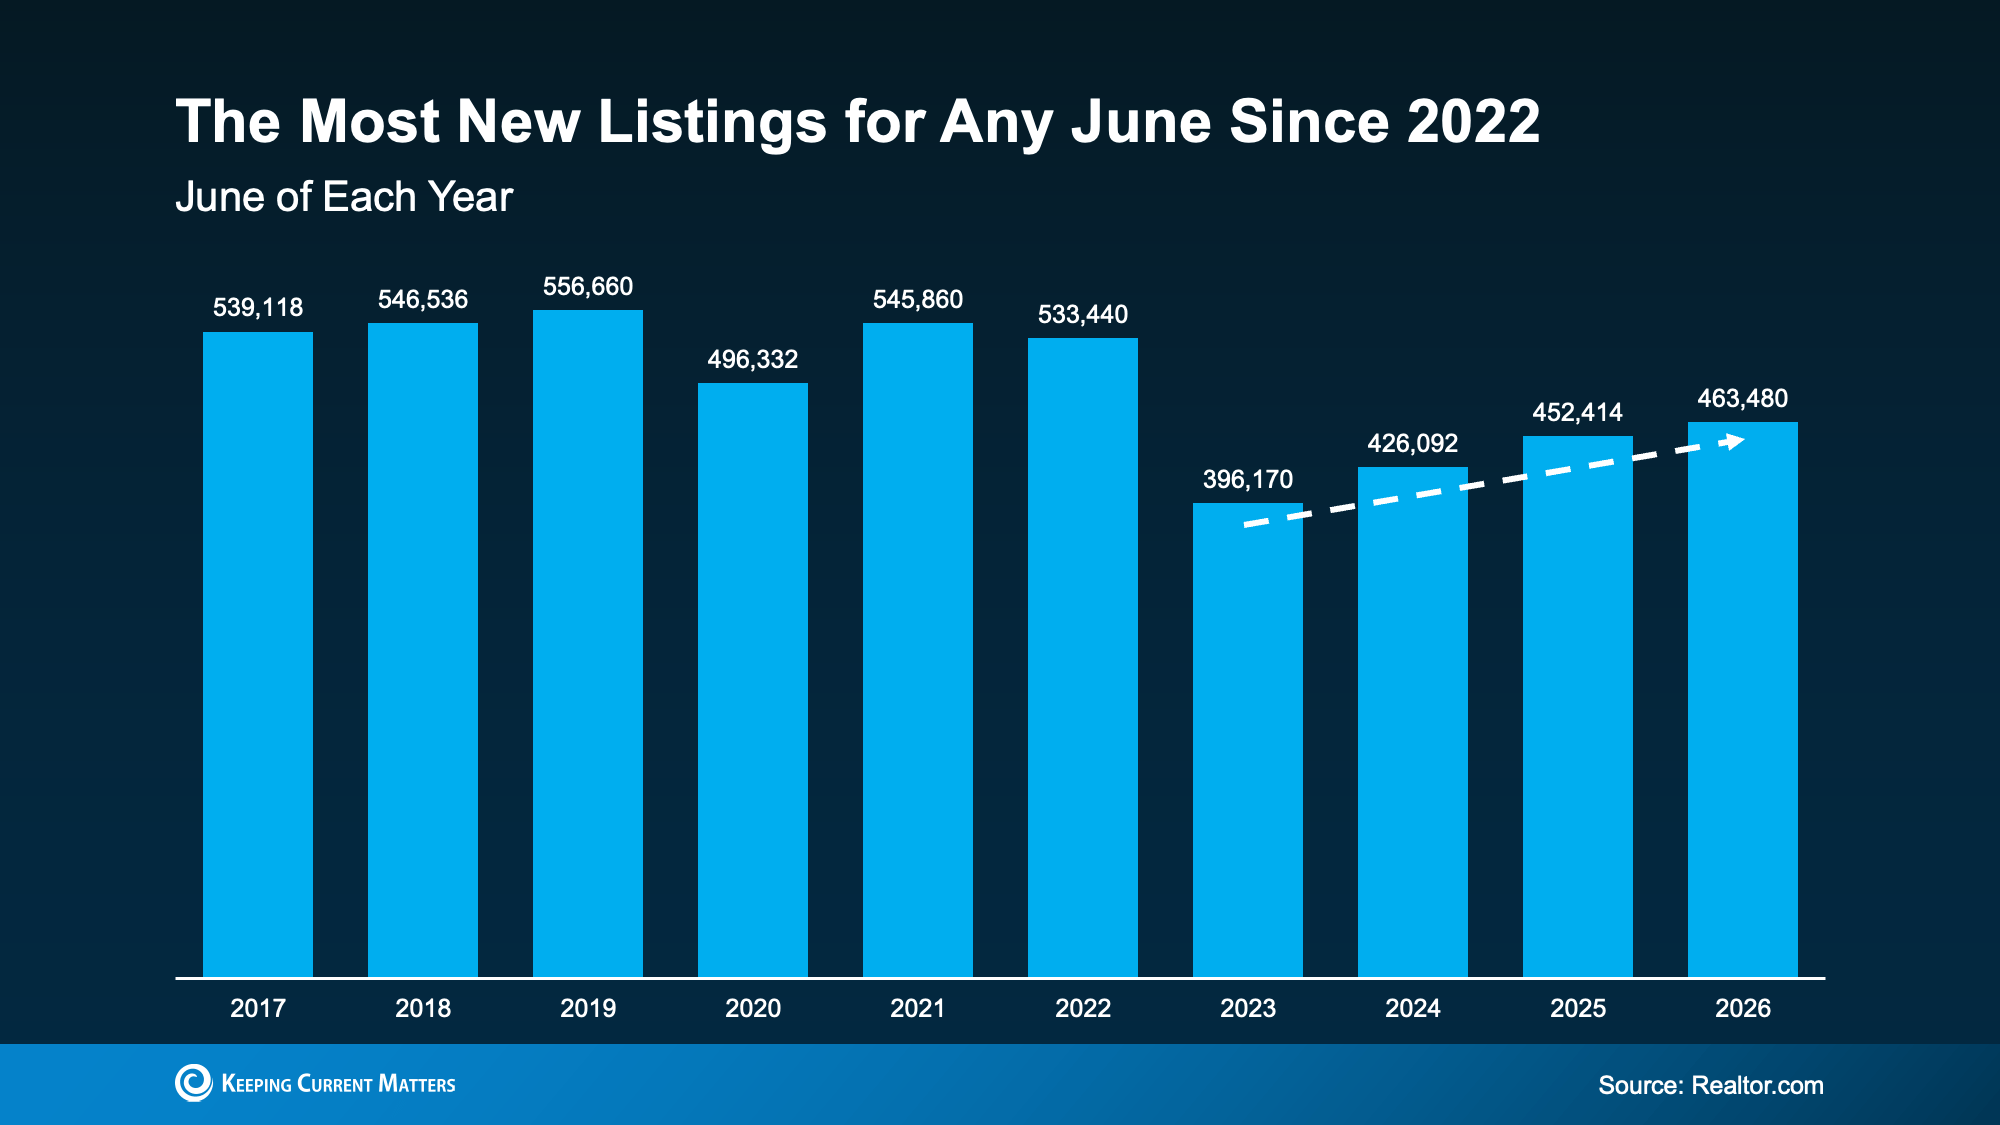
This means more options for you and less competition for each one.
Now, supply is not back to normal everywhere. As you can see, we’re still down from where we were back in 2017-2019. But in many places, it’s better than it’s been in a while. Here’s how that helps you.
You don’t have to rush an offer just to stay in the running, and you have better odds of finding and landing the right home, not just the one that’s available. Plus, you’ll have more room to negotiate, so you’re searching from a stronger position than buyers had even a year ago.
Why This Is Encouraging if You’re Buying Your First Home
For first-time buyers looking for lower-priced homes, these trends line up especially well. Mischa Fisher, Chief Economist at Zillow, explains:
“The lowest price tiers are exhibiting some softness in terms of price, they also had the most listing-activity growth, the first time since 2022 that’s been the case.”
So, if you’re searching for your first place or your next house, there’s a little more to choose from and a little more give on price.
Bottom Line
If a tight budget or a thin selection has kept you from buying a home, now might be the time to restart your search.
Connect with a local real estate agent to see what’s available where you’re looking.
Quick gut reaction. Which investment do Americans trust more than stocks, gold, savings accounts, and bonds? The answer hasn’t changed in 14 years.
It’s real estate. And this year, that answer comes with even more conviction behind it. New data shows people aren’t just saying homeownership is a smart move, they’re feeling better about it than they have in years. Let’s dig into why.
Real Estate Takes the Top Spot – Again
Every year, Gallup asks Americans to name the best long-term investment. And for the 14th year in a row, real estate came out on top (see graph below):
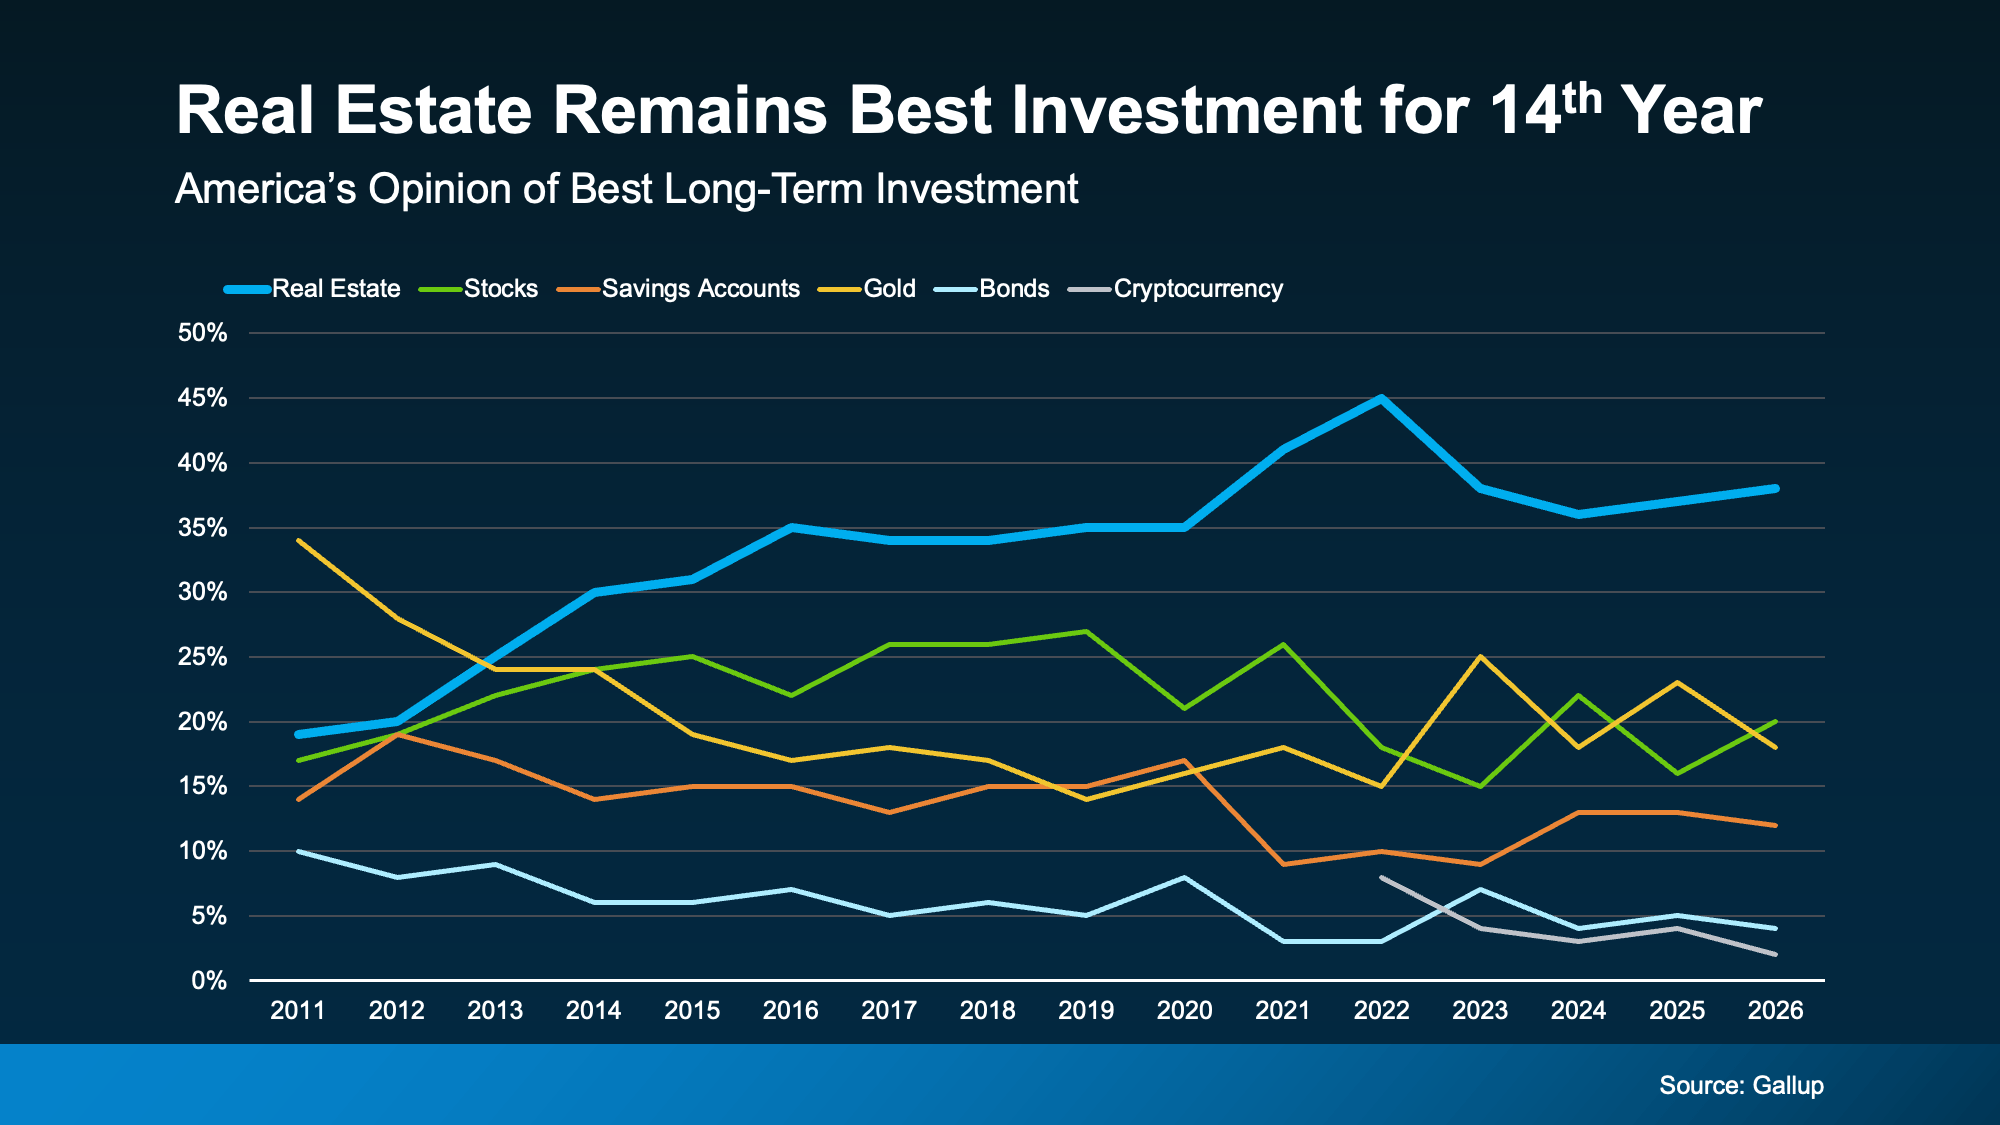
That’s not a fluke or a hot streak. That’s 14 straight years of beating out stocks, gold, and everything else.
Think about everything that’s happened in that stretch – rising rates, market swings, election years, you name it. Through all of it, Americans kept picking real estate. That kind of staying power says something about how people view homeownership – and it makes sense. Historically, it’s one of the best ways to build wealth in this country.
As Michelle Egan, Head of Credit Solutions, Impact Finance at JPMorgan Chase, explains:
“Owning a home has long been considered one of the most reliable ways to build wealth. Beyond providing shelter, a home is a valuable asset that can appreciate over time, build equity, and serve as a financial resource for generations.”
Now, you may have seen chatter online saying home prices are falling and wondered if that changes the math. It really shouldn’t. Nationally, home prices are still rising – just at a slower pace than a few years ago.
Yes, some local markets are seeing slight dips, but those dips are small compared to how much home values have grown over the past 5 years. Generally speaking, home prices almost always rise. As long as you plan to live there for a good length of time, you should still have the chance to build equity.
More People Say Buying Beats Renting
And while it’s true homeownership has been seen as a worthwhile pursuit for years now, something interesting is happening. It may actually be gaining a bit more popularity again.
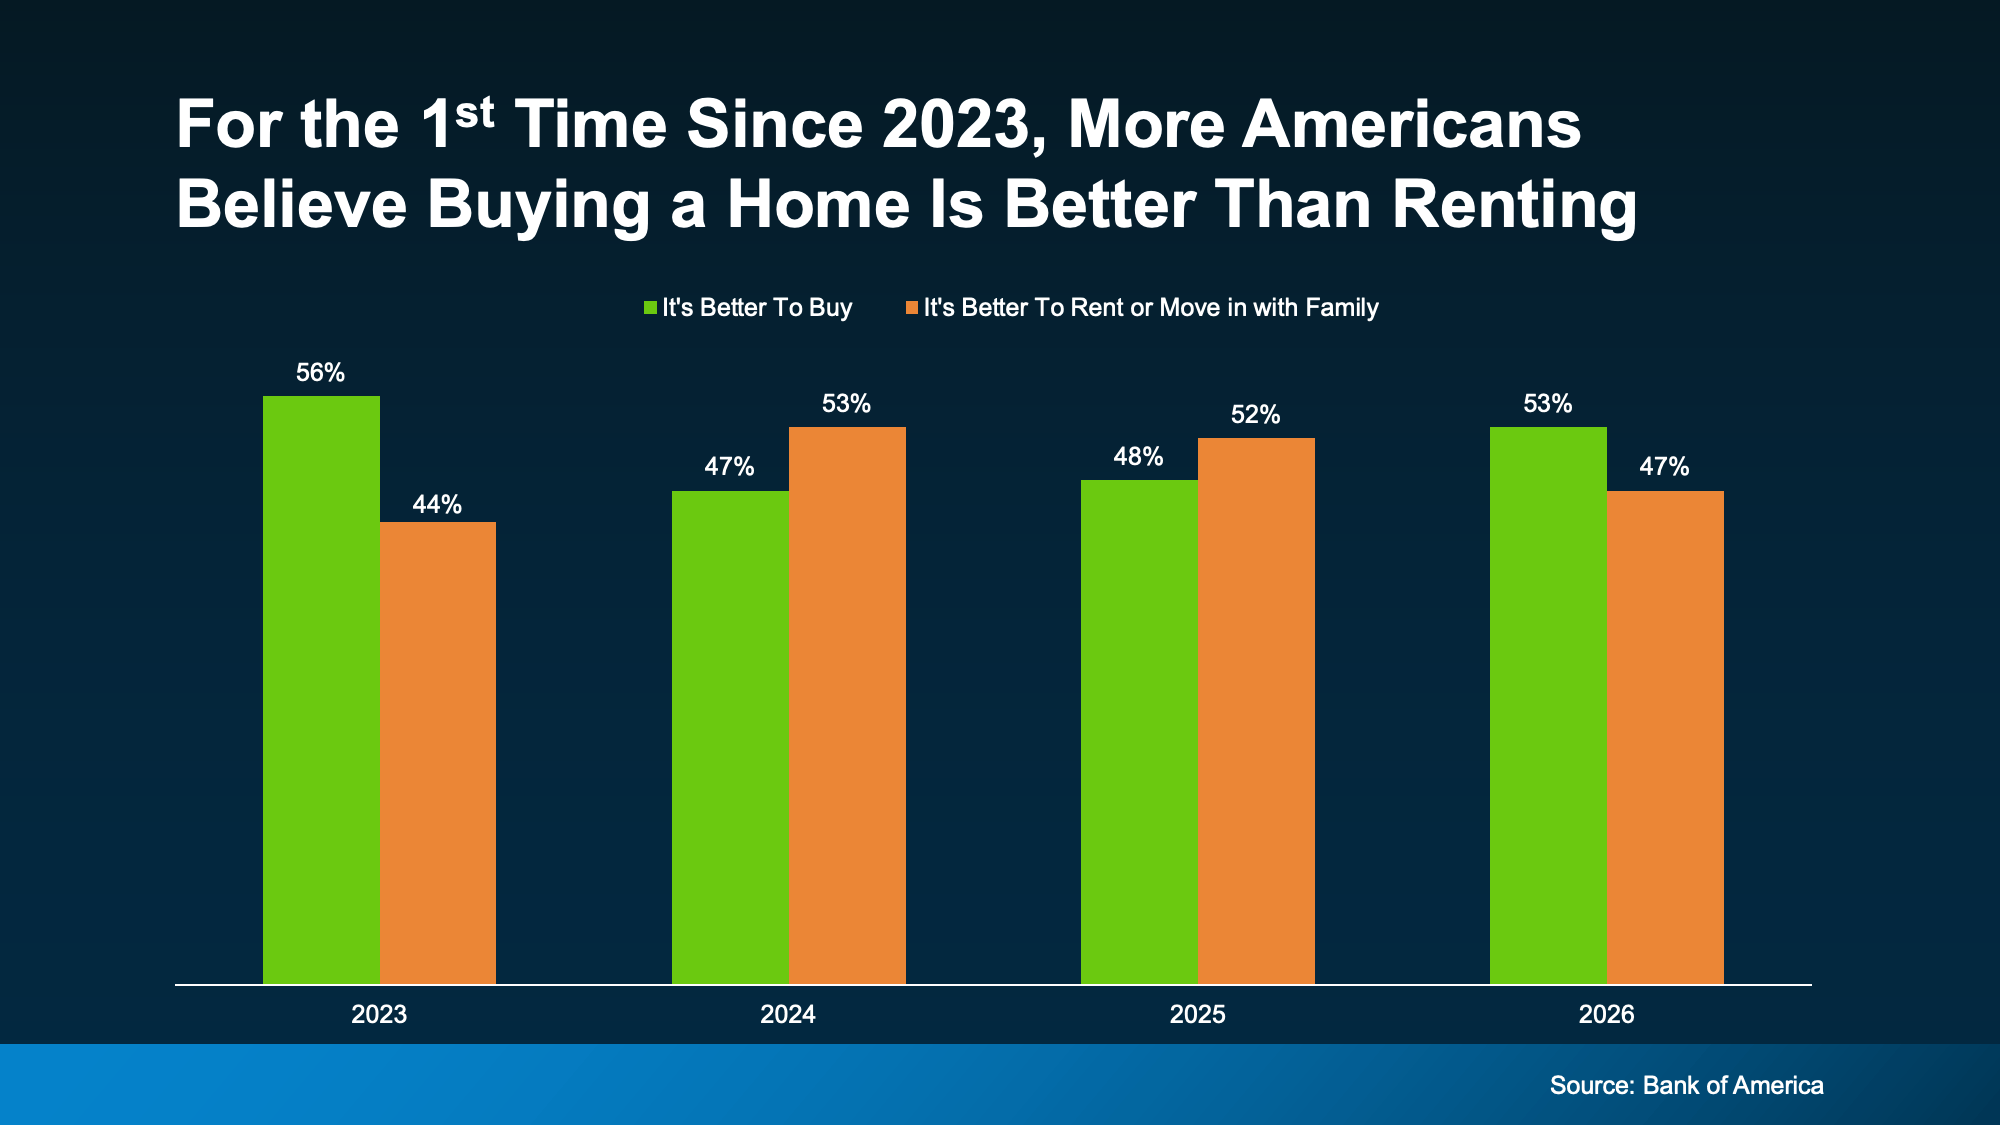
According to Bank of America‘s latest Homebuyer Insights Report, 53% of people now say it’s better to buy a home than to rent or move in with family. That’s the first time buying has taken the lead since 2023 (see graph below):
In that same report, here are a few other signals that confidence in homeownership is on the rise:
-
90% of people say a home is a valuable investment, up from 79% just last year.
-
And 94% say owning a home provides stability, up from 83% the year prior.
Those are relatively big jumps in a short amount of time. And here’s what may be driving it.
It’s About More Than Money
Sure, affordability is still tight and some markets are still hard to break into, but that hasn’t changed what people feel about homeownership as a goal. And the reason why is simple – it’s not just a financial decision. It’s a lifestyle choice.
A home pays you back in ways stocks never could. As Sheharyar Bokhari, Principal Economist at Redfin, says:
“For many homeowners, a home is more than a place to sleep and store belongings—it’s a reflection of who they are. Homeownership can help people put down roots, build relationships and create a space that feels uniquely their own.”
You can’t get that from a brokerage account. A home is the one investment that grows your wealth and gives you a place to build your life. And that means something.
Bottom Line
For 14 years straight, Americans have called real estate the best long-term investment, and confidence in owning a home is on the rise. If you’ve been weighing whether buying is worth it, connect with a local real estate agent and talk through what that first step could look like for you.

The House That Started It All Could Kickstart What’s Next

Priced Out? A Condo or Townhome Could Be Your Way In.

More Homes, Better Prices: A Buyer’s Summer


-
 Equity4 weeks ago
The Housing Market Is Stronger Than You Think
-
 Economy3 weeks ago
What Buying or Selling a Home Gives Back to Your Community
-
 Buying Tips4 weeks ago
The 1 Factor That Explains Everything Happening with Home Prices Right Now
-

 Affordability4 weeks ago
Down Payments Are Smaller Than They’ve Been Since 2021
-

 Buying Tips3 weeks ago
Student Loans Are Back in the News. Don’t Let It Put Your Homeownership Plans on Hold.
-

 Affordability3 weeks ago
What To Expect from the Housing Market in the Second Half of 2026
-

 Buying Tips2 weeks ago
The “Take It or Leave It” Attitude Is Fading from the Market – What That Means for You
-
 For Sellers2 weeks ago
Think Nobody’s Buying Homes Right Now? Think Again.
You must be logged in to post a comment Login