
For Buyers
Will Surging Unemployment Crush Home Sales?
Ten million Americans lost their jobs over the last two weeks. The next announced unemployment rate on May 8th is expected to be in the double digits. Because the health crisis brought the economy to a screeching halt, many are feeling a personal financial crisis. James Bullard, President of the Federal Reserve Bank of St. Louis, explained that the government is trying to find ways to assist those who have lost their jobs and the companies which were forced to close (think: your neighborhood restaurant). In a recent interview he said:
“This is a planned, organized partial shutdown of the U.S. economy in the second quarter. The overall goal is to keep everyone, households and businesses, whole.”
That’s promising, but we’re still uncertain as to when the recently unemployed will be able to return to work.
Another concern: how badly will the U.S. economy be damaged if people can’t buy homes?
A new concern is whether the high number of unemployed Americans will cause the residential real estate market to crash, putting a greater strain on the economy and leading to even more job losses. The housing industry is a major piece of the overall economy in this country.
Chris Herbert, Managing Director of the Joint Center for Housing Studies of Harvard University, in a post titled Responding to the Covid-19 Pandemic, addressed the toll this crisis will have on our nation, explaining:
“Housing is a foundational element of every person’s well-being. And with nearly a fifth of US gross domestic product rooted in housing-related expenditures, it is also critical to the well-being of our broader economy.”
How has the unemployment rate affected home sales in the past?
It’s logical to think there would be a direct correlation between the unemployment rate and home sales: as the unemployment rate went up, home sales would go down, and when the unemployment rate went down, home sales would go up.
However, research reviewing the last thirty years doesn’t show that direct relationship, as noted in the graph below. The blue and grey bars represent home sales, while the yellow line is the unemployment rate. Take a look at numbers 1 through 4: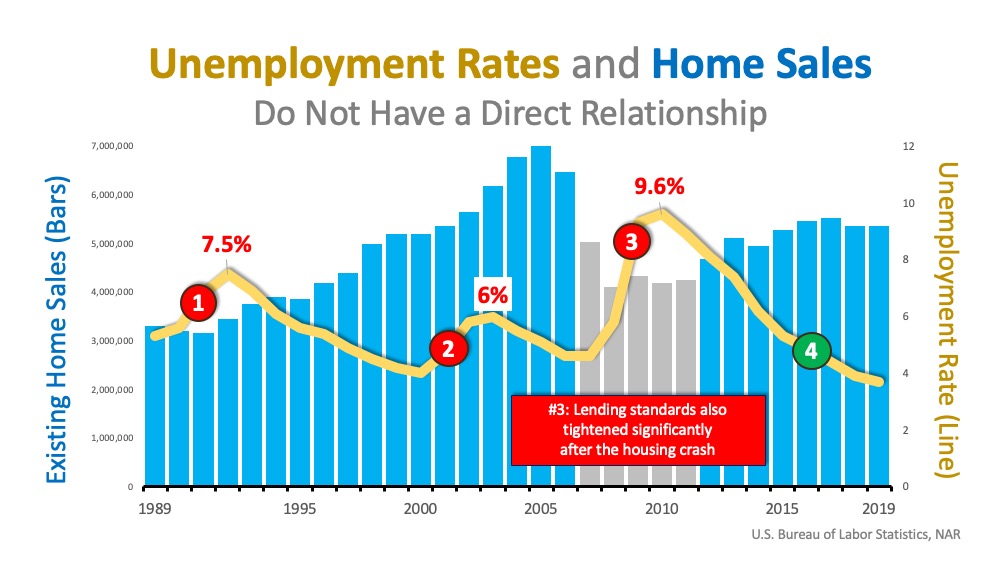
- The unemployment rate was rising between 1992-1993, yet home sales increased.
- The unemployment rate was rising between 2001-2003, and home sales increased.
- The unemployment rate was rising between 2007-2010, and home sales significantly decreased.
- The unemployment rate was falling continuously between 2015-2019, and home sales remained relatively flat.
The impact of the unemployment rate on home sales doesn’t seem to be as strong as we may have thought.
Isn’t this time different?
Yes. There is no doubt the country hasn’t seen job losses this quickly in almost one hundred years. How bad could it get? Goldman Sachs projects the unemployment rate to be 15% in the third quarter of 2020, flattening to single digits by the fourth quarter of this year, and then just over 6% percent by the fourth quarter of 2021. Not ideal for the housing industry, but manageable.
How does this compare to the other financial crises?
Some believe this is going to be reminiscent of The Great Depression. From the standpoint of unemployment rates alone (the only thing this article addresses), it does not compare. Here are the unemployment rates during the Great Depression, the Great Recession, and the projected rates moving forward: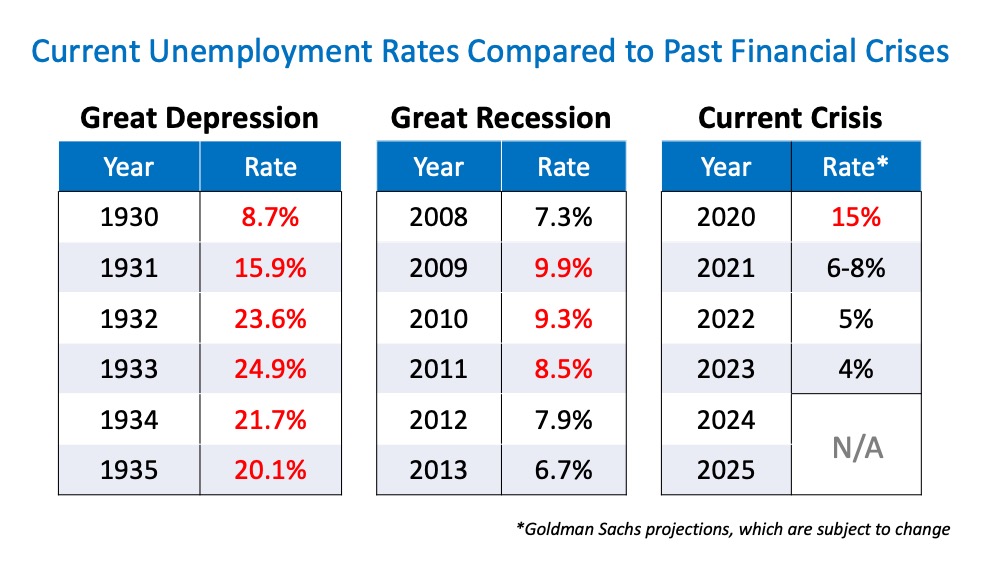
Bottom Line
We’ve given you the facts as we know them. The housing market will have challenges this year. However, with the help being given to those who have lost their jobs and the fact that we’re looking at a quick recovery for the economy after we address the health problem, the housing industry should be fine in the long term. Stay safe.

After more than a year of headlines talking about how home prices are going to crash, the latest data shows that price growth may be starting to pick back up again. And depending on whether you’re buying or selling, that shift means something different for you.
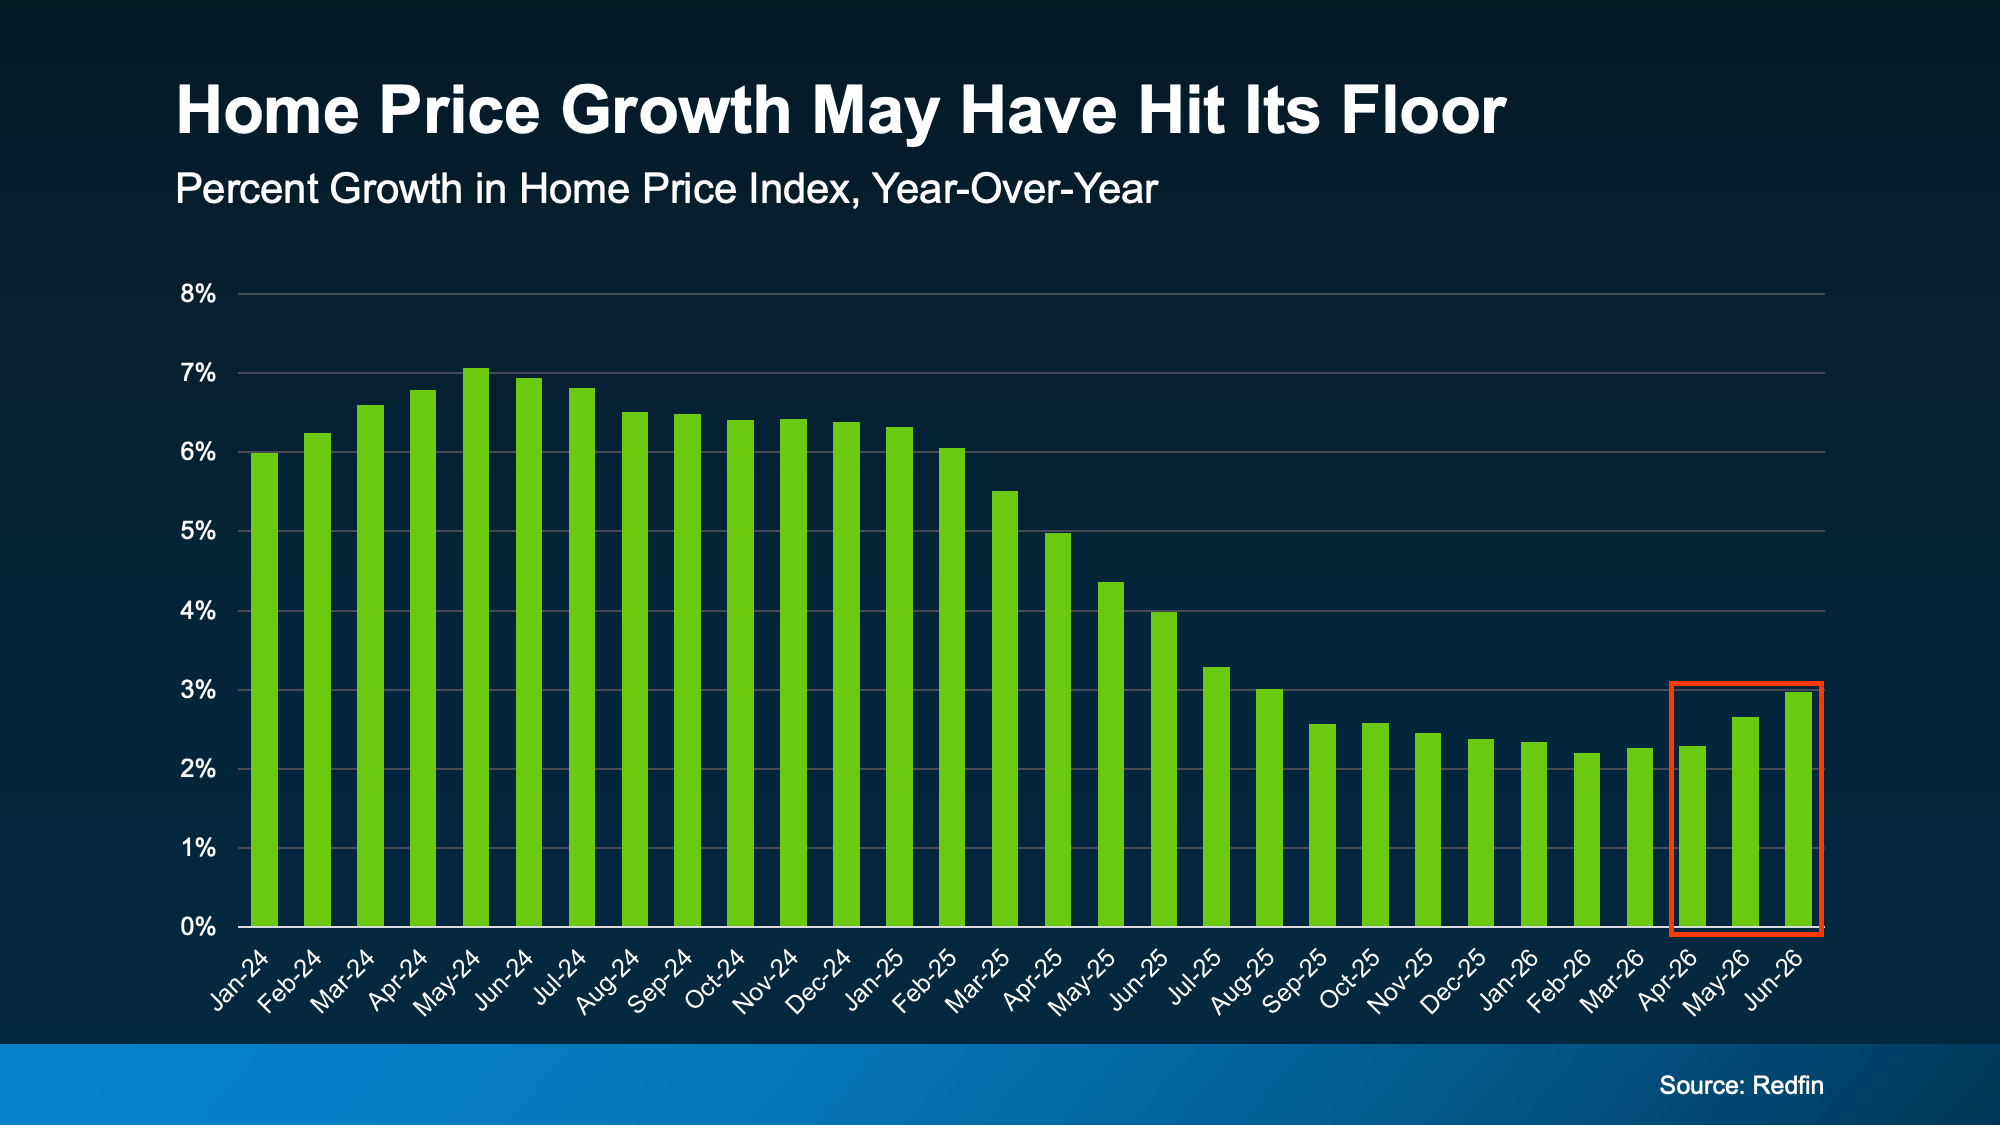
The Numbers May Be Starting To Turn
For the past couple of years, home price growth has been moderating – cooling from around 7% in mid-2024, according to Redfin (see graph below). But look at the right side of that graph. The pace of that growth appears to have hit its low point and started to turn.
While a couple months of data doesn’t necessarily mean this will be a lasting trend, there are some other signs that this could continue.
For example, fewer markets are seeing prices decline. According to ResiClub and Zillow, about 36% of the 300 largest housing markets had falling prices as of the middle of last year. Since the start of this year, that share has been shrinking. Now? Only 23% are experiencing those mild dips (see graph below):
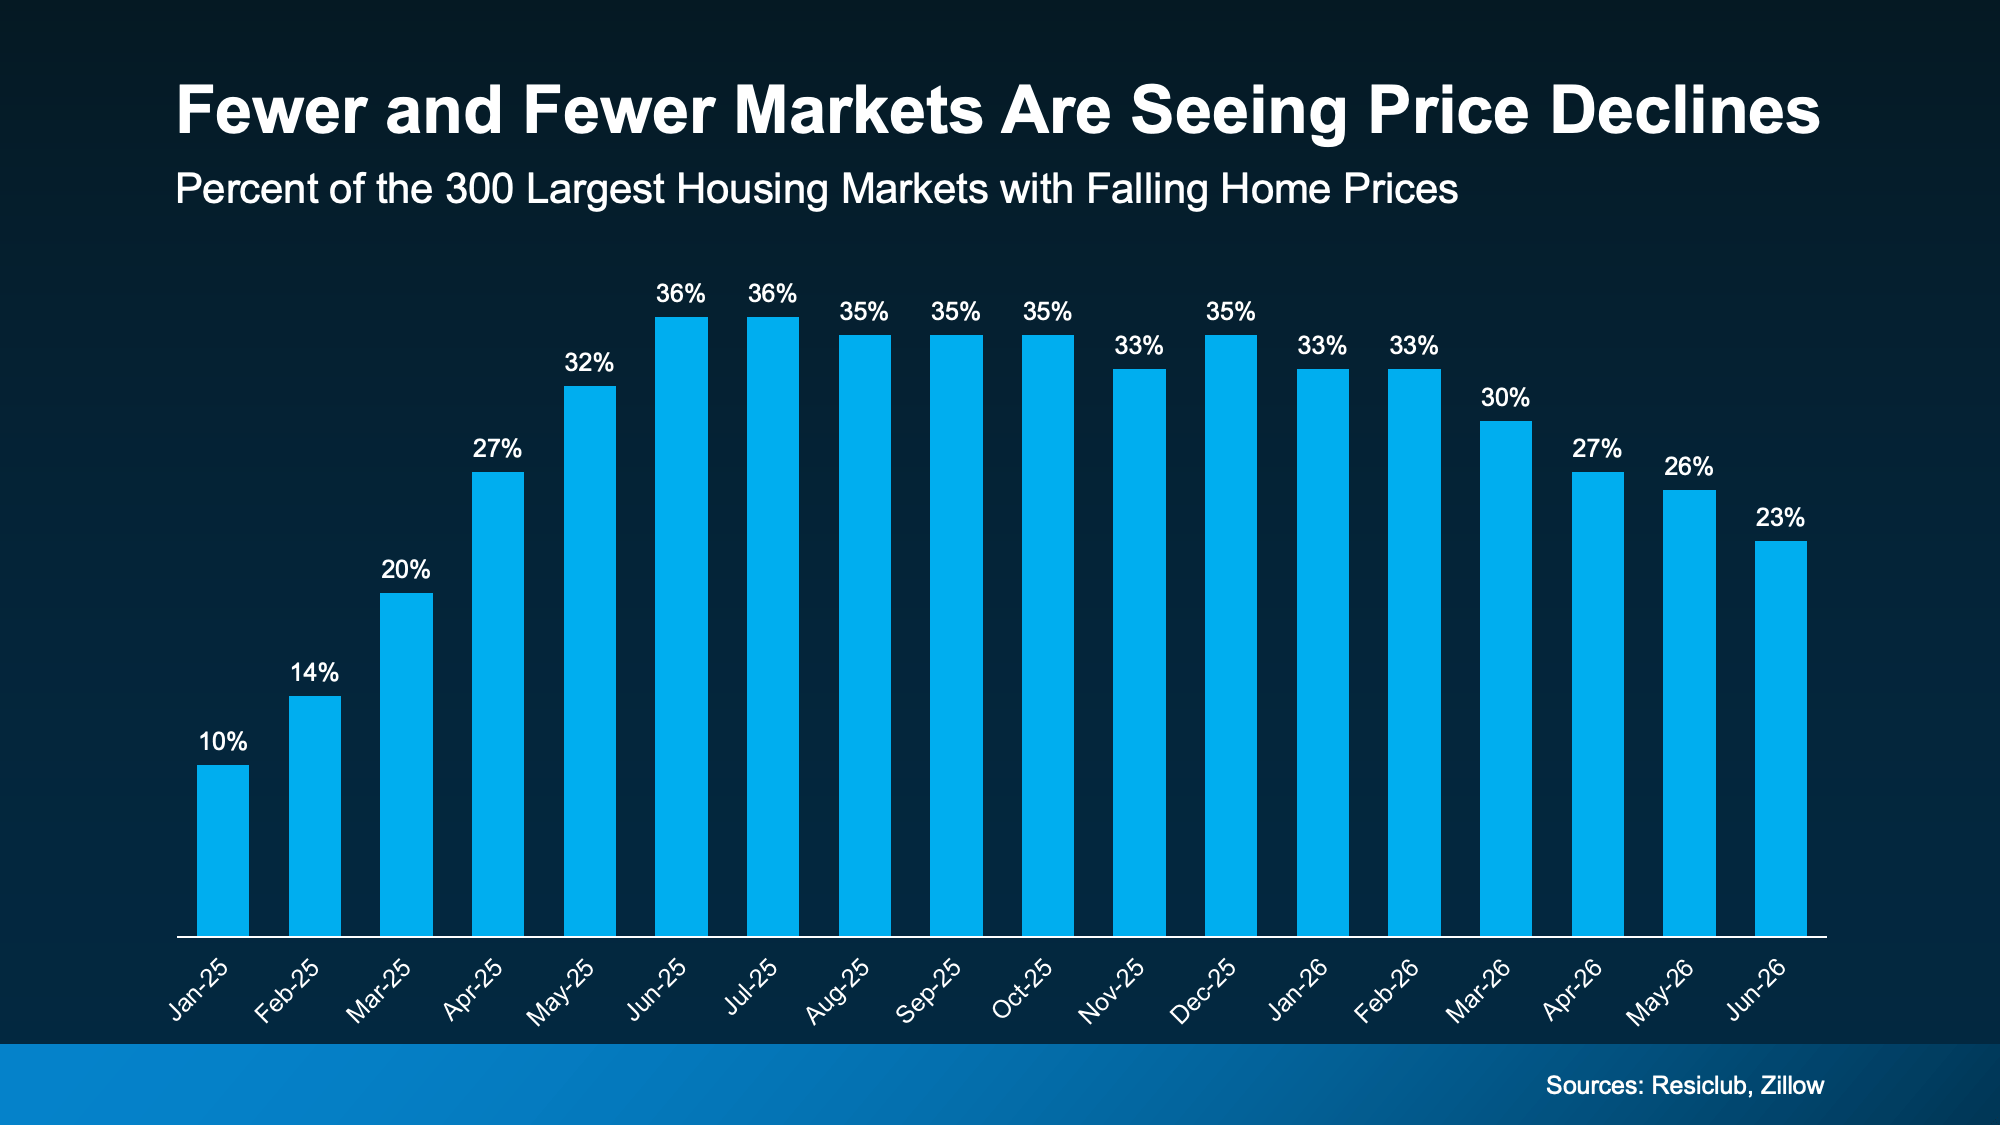
When fewer markets see prices falling, that means more markets are seeing prices rise again.
And forecasts suggest this shift has room to run. On average, experts project home prices will rise about 2.3% nationally this year. And for that to happen, price growth would have to pick up a bit in the second half of 2026.
But Remember, Real Estate Is Local
While it looks like national prices may be starting to pick back up a tiny bit, that doesn’t mean that’s what’s happening in your neighborhood.
National home prices are really just an average of hundreds of local markets. Some are climbing faster. Others are still cooling. But one reason the national average may be looking up is because a growing number of metros may actually be net positive for prices this year.
Not long ago, the major metros were split about 50/50 – half seeing prices rise and half seeing them fall. Now, that balance looks like it’s starting to tip in a more positive direction. Just last month, more than half of the major metros saw prices go up, according to Redfin (see graph below):
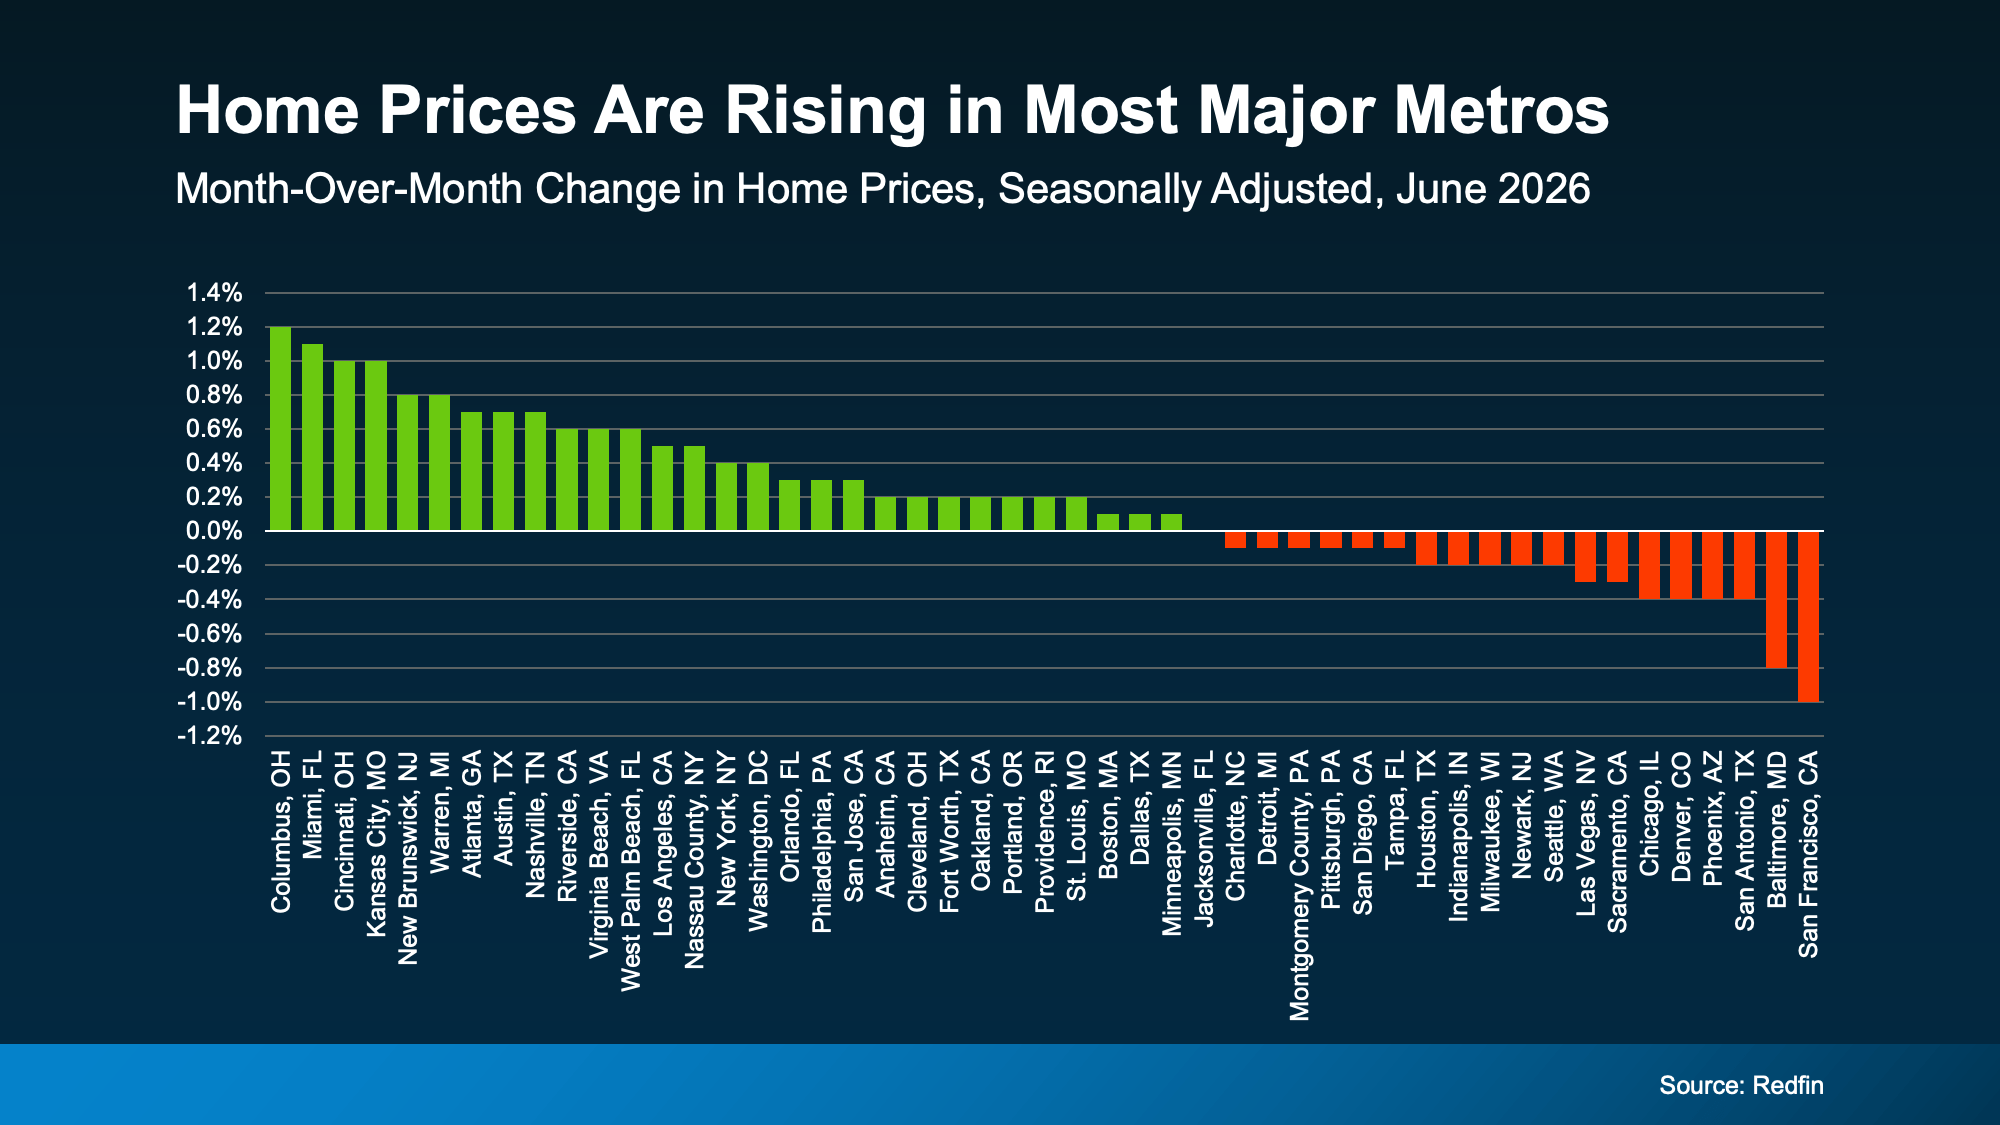
As Selma Hepp, Chief Economist at Cotality, explains:
“. . . local markets continue to tell very different stories. Annual home price growth has changed little since the start of the year, but some markets, especially those supported by strong job and income growth in the West and more affordable Midwest markets, have seen notable acceleration in price gains.”
What This Means for You
Home price headlines can be confusing because they don’t always tell the full picture. Lean on an agent to understand what’s happening in your local market and what the early signs say for where prices may go from here.
That’s the best way to stay one step ahead of the market.
If you’re buying: slower price growth has worked in your favor. You’ve had more room to negotiate and a budget you could plan around. If price growth is picking up in your area, buying now may mean paying less than you would later this year.
If you own a home: you’ve been gaining equity all along, even while growth moderated. If growth keeps picking up, those gains could speed up, too. Lawrence Yun, Chief Economist at the National Association of Realtors (NAR), projects the typical homeowner will gain roughly $16,000 in housing wealth this year. And if you’re thinking about selling, this shift is a good early sign for you. Just remember, the market is still pretty balanced and buyer-friendly in a lot of areas right now.
Home price growth slowed way down, and now it’s showing early signs of picking back up. Whether you’re buying or selling, let’s connect so you can see exactly what prices are doing in our local market and what that means for your plans.
Bottom Line
Home price growth slowed way down, and now it’s showing early signs of picking back up. Whether you’re buying or selling, connect with a local real estate agent so you can see exactly what prices are doing in your local market and what that means for your plans.

Today’s home prices have a lot of buyers – especially first-time buyers – wondering if there’s even anything out there that’s in their budget. But owning a home may be more within reach than you think. Sometimes, it just means considering a different type of home.
Condos and townhomes can be a great way to buy without stretching every last dollar. And right now, two things make them worth a serious look.
There Are More Condos and Townhomes To Choose From
Maybe you feel like there’s just nothing out there for you, and you’ve exhausted all your options. But have you considered condos or townhomes? A lot of buyers start by looking for a single-family, detached home without even realizing what that search omits from their pool of choices.
According to HousingWire Data, there were 233,030 condos and townhomes for sale this June. That’s more than any June in at least the past decade, and more than double the number available back in 2022 (see graph below):
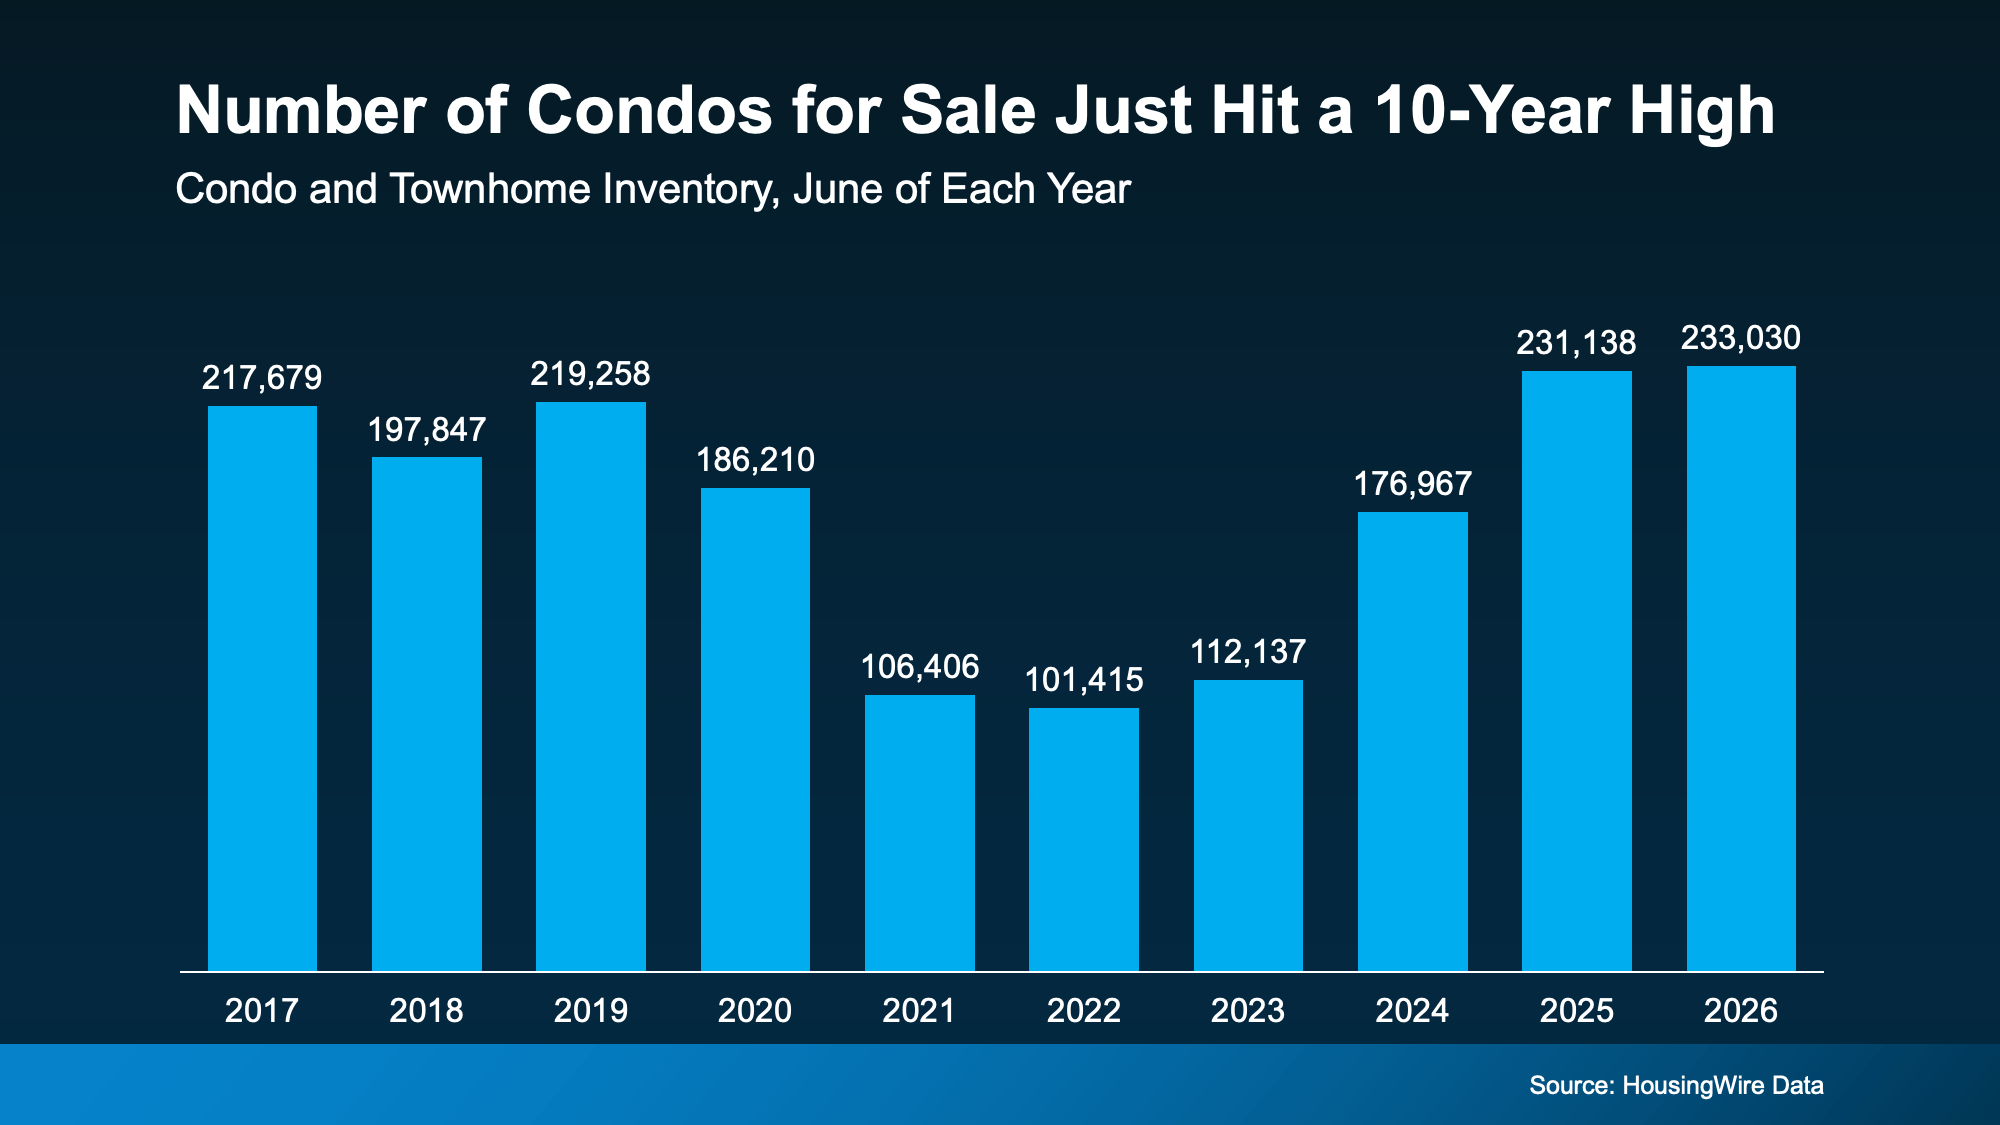
That means there are more options out there in this segment of the market – and that’s especially good news for first-time buyers. These types of homes can be a great way to break into the market for less.
Just remember, that’s the national number. What’s available will depend on where you’re looking. But generally speaking, more options means less competition, more time to decide, and more room to negotiate.
They Also Tend To Cost Less Than Single-Family Homes
Price is the other big draw. According to the National Association of Realtors (NAR), the median condo price was $380,000 in June. In contrast, the median single-family home price was $446,400 (see graph below):

That’s a difference of more than $66,000.
A big reason why? Condos are usually smaller than single-family homes. And smaller homes can come with smaller price tags.
And if you don’t need all that extra space, that lower entry price could be exactly what gets you through the door.
Condo or Townhome? How They’re Different.
For buyers who feel priced out of the market, a condo or townhome could be a way in. But there are some things to know. Before you start checking out homes, it’s good to understand how these two compare to each other – and to a single-family home.
-
With a single-family detached home, you own the house and the land it sits on, and you don’t share any walls with neighbors. That means the most space and privacy. But it also usually comes with a higher tag, and all the maintenance is on you.
-
With a townhome, you own the building and the lot it sits on. They’re usually multi-level, so you get more space, and you share two walls at most. You’ll also have more say over how your home looks and how repairs get done, but more of that upkeep falls on you.
-
With a condo, you own just the inside of your unit and may have access to community features like a pool or gym. The building and shared space belong to everyone who lives there, which means you have less maintenance responsibilities. But you’ll also likely have more neighbors around you, less control over building decisions, and higher HOA fees since the HOA handles the exterior and common areas.
Bottom Line
A condo or townhome could be your path to owning a home without blowing your budget. Connect with a local real estate agent to see what’s for sale in your area and figure out which type of home fits your lifestyle, and your bottom line.
If you’ve thought about buying a home in the past few years, you may have run into two frustrations: asking prices that kept climbing and too few homes to choose from.
In many places, both sticking points are letting up this summer, with lower asking prices and more homes for sale. Let’s look at the trends, and what they mean for your search.
Sellers Are Pricing To Attract Buyers
According to Realtor.com, the national median asking price was $430,000 in June, nearly $11,000 under what it was the year before (see graph below):
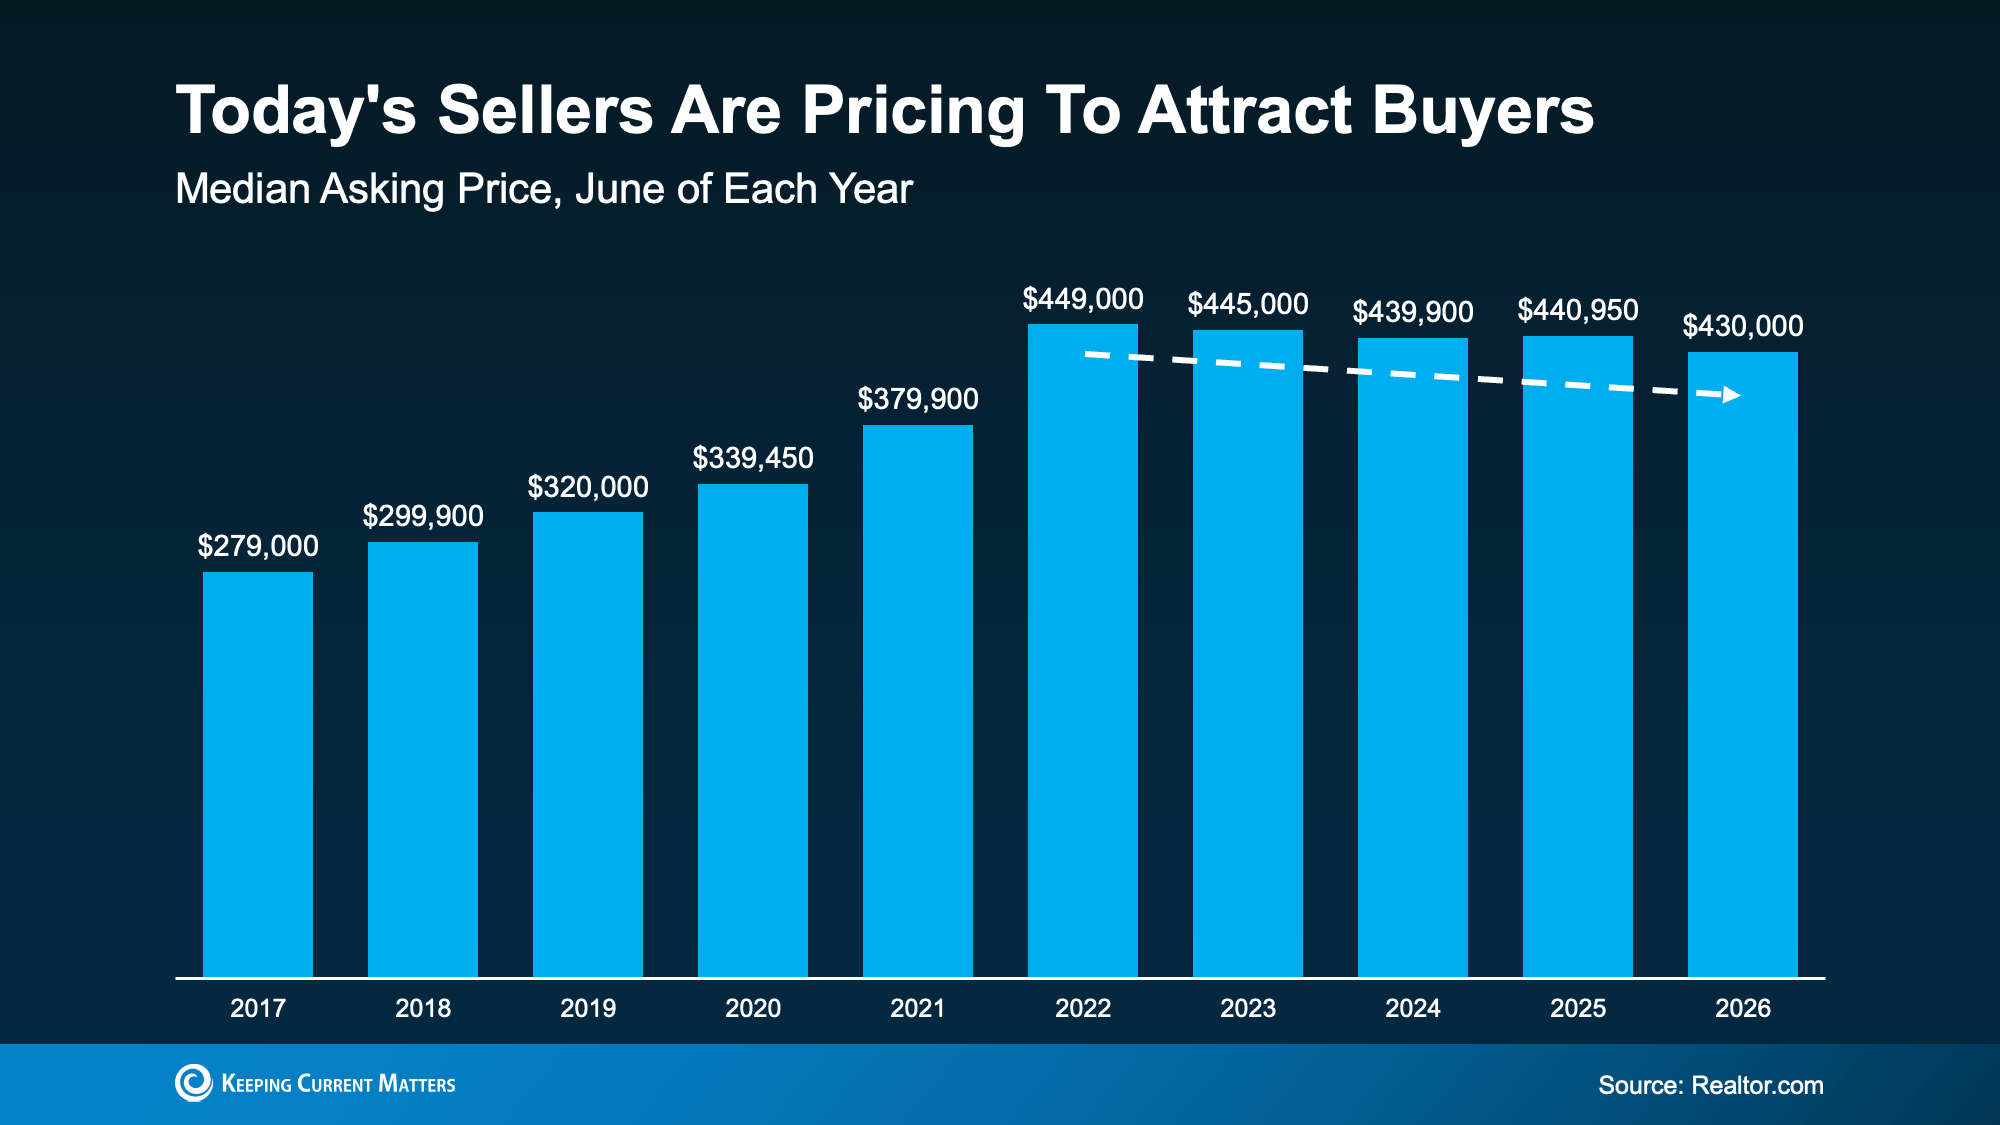
That’s the eighth month in a row that the typical asking price has dipped below where they were the previous year, according to the same Realtor.com report.
And while falling prices can sound worrying, this isn’t a sign of an impending crash. We’re talking about asking prices, not sold prices. This is a sign that today’s sellers are meeting the market where it is and pricing to draw buyers. And that’s actually something normal we’d expect from the market. As Danielle Hale, Chief Economist at Realtor.com, puts it:
“Sellers are reading market conditions and are pricing accordingly from the start rather than listing high and cutting later, and buyers are taking note and making bids. This is a welcome sign that we are in a functioning market.”
Asking prices were never going to climb forever – now they’re just settling closer to what buyers can actually pay. That signals a healthier market, and sellers re-adjusting their expectations.
More Homes Are Available Now
If you’ve spent the past few years watching homes disappear before you could even schedule a tour, this is for you.
Supply is starting to catch up. According to Realtor.com, the number of homes listed for sale in June was the highest June number we’ve seen in three years (see graph below):
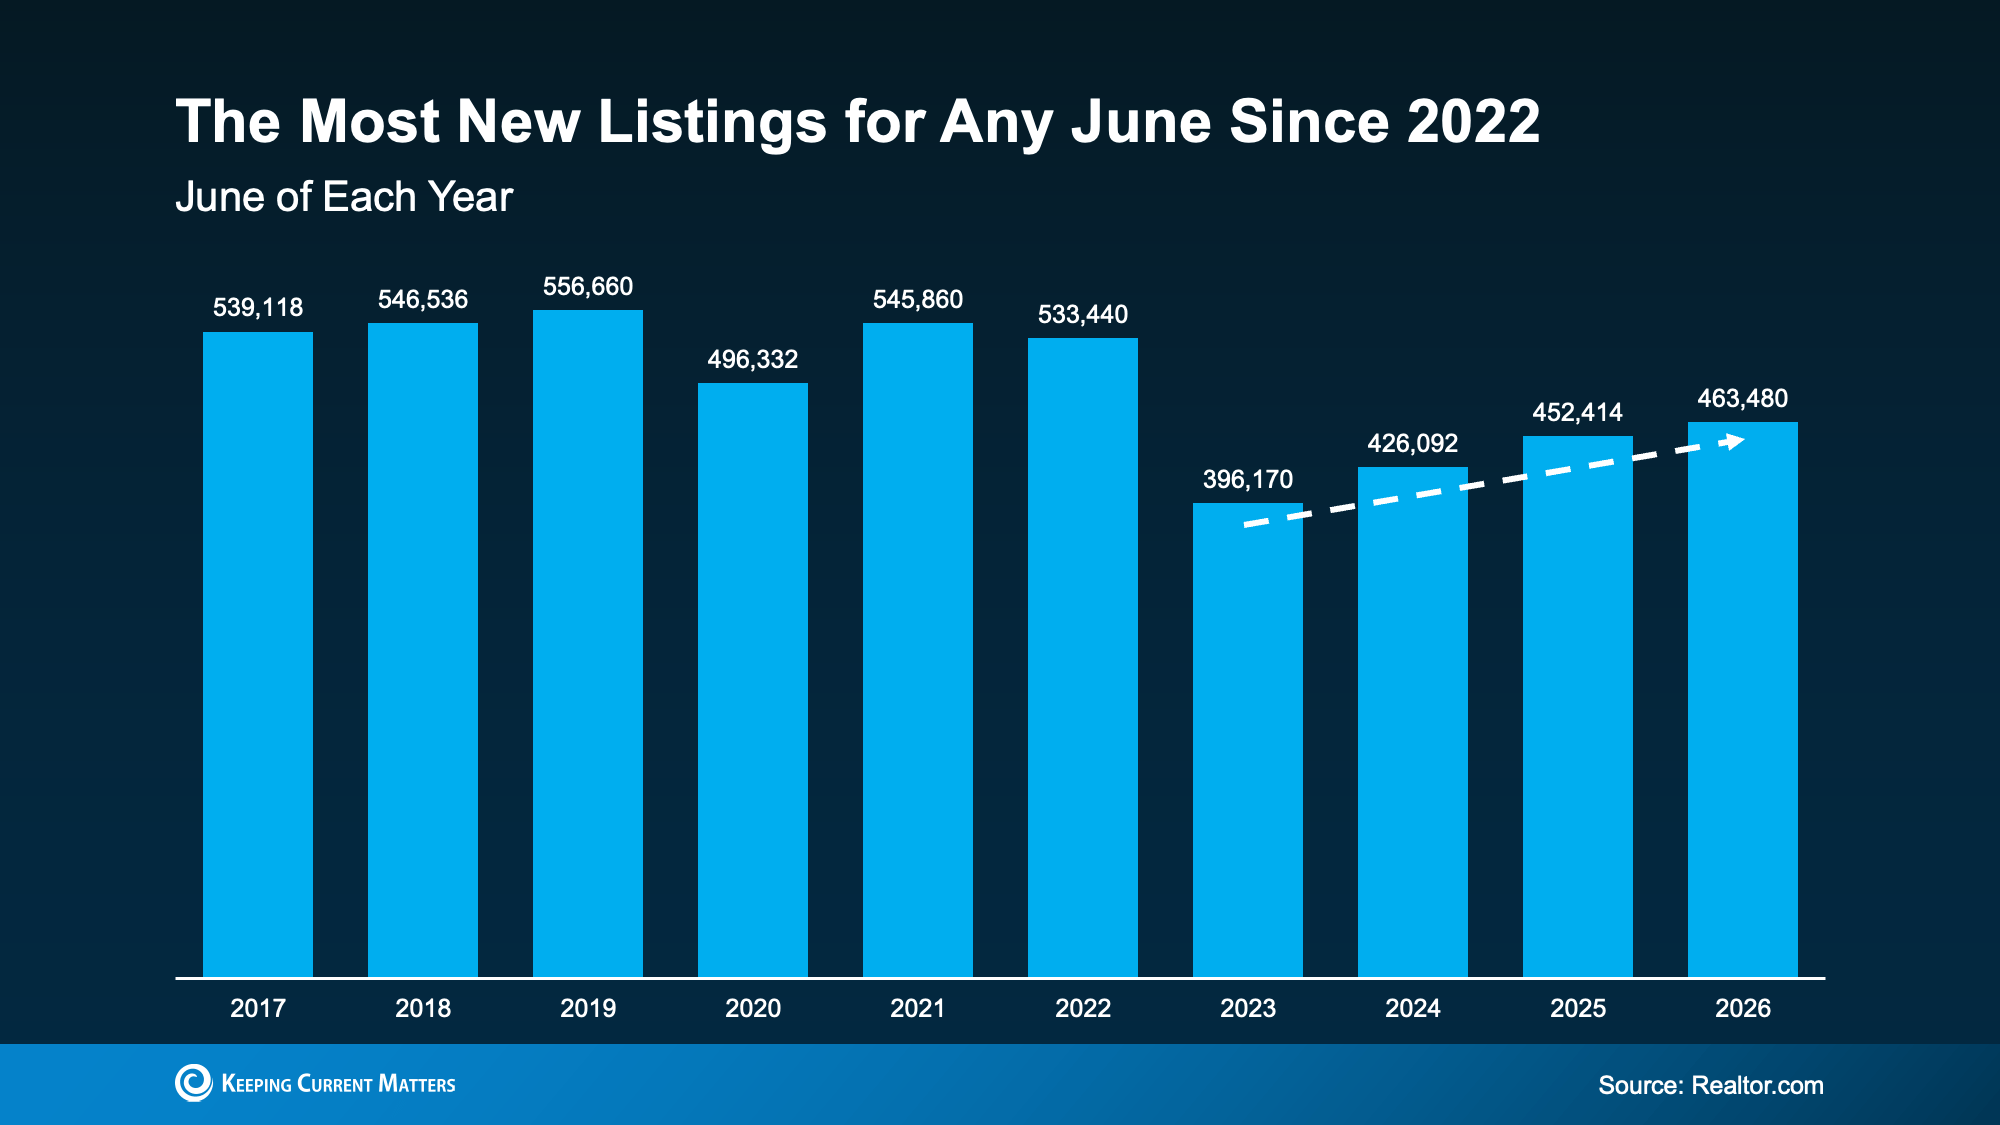
This means more options for you and less competition for each one.
Now, supply is not back to normal everywhere. As you can see, we’re still down from where we were back in 2017-2019. But in many places, it’s better than it’s been in a while. Here’s how that helps you.
You don’t have to rush an offer just to stay in the running, and you have better odds of finding and landing the right home, not just the one that’s available. Plus, you’ll have more room to negotiate, so you’re searching from a stronger position than buyers had even a year ago.
Why This Is Encouraging if You’re Buying Your First Home
For first-time buyers looking for lower-priced homes, these trends line up especially well. Mischa Fisher, Chief Economist at Zillow, explains:
“The lowest price tiers are exhibiting some softness in terms of price, they also had the most listing-activity growth, the first time since 2022 that’s been the case.”
So, if you’re searching for your first place or your next house, there’s a little more to choose from and a little more give on price.
Bottom Line
If a tight budget or a thin selection has kept you from buying a home, now might be the time to restart your search.
Connect with a local real estate agent to see what’s available where you’re looking.

Home Price Growth Slowed Down. That May Be Changing.

Selling a Luxury House? Here’s Why Now Is a Good Time

The House That Started It All Could Kickstart What’s Next


-
 Equity4 weeks ago
The Housing Market Is Stronger Than You Think
-
 Economy3 weeks ago
What Buying or Selling a Home Gives Back to Your Community
-

 Affordability4 weeks ago
Down Payments Are Smaller Than They’ve Been Since 2021
-

 Buying Tips3 weeks ago
Student Loans Are Back in the News. Don’t Let It Put Your Homeownership Plans on Hold.
-

 Affordability3 weeks ago
What To Expect from the Housing Market in the Second Half of 2026
-
 For Sellers2 weeks ago
Think Nobody’s Buying Homes Right Now? Think Again.
-

 Buying Tips2 weeks ago
The “Take It or Leave It” Attitude Is Fading from the Market – What That Means for You
-

 First-Time Buyers2 weeks ago
14 Years Running: Why Real Estate Is Still America’s Favorite Investment
You must be logged in to post a comment Login