
For Buyers
5 Simple Graphs Proving This Is NOT Like the Last Time
With all of the volatility in the stock market and uncertainty about the Coronavirus (COVID-19), some are concerned we may be headed for another housing crash like the one we experienced from 2006-2008. The feeling is understandable. Ali Wolf, Director of Economic Research at the real estate consulting firm Meyers Research, addressed this point in a recent interview:
“With people having PTSD from the last time, they’re still afraid of buying at the wrong time.”
There are many reasons, however, indicating this real estate market is nothing like 2008. Here are five visuals to show the dramatic differences.
1. Mortgage standards are nothing like they were back then.
During the housing bubble, it was difficult NOT to get a mortgage. Today, it is tough to qualify. The Mortgage Bankers’ Association releases a Mortgage Credit Availability Index which is “a summary measure which indicates the availability of mortgage credit at a point in time.” The higher the index, the easier it is to get a mortgage. As shown below, during the housing bubble, the index skyrocketed. Currently, the index shows how getting a mortgage is even more difficult than it was before the bubble.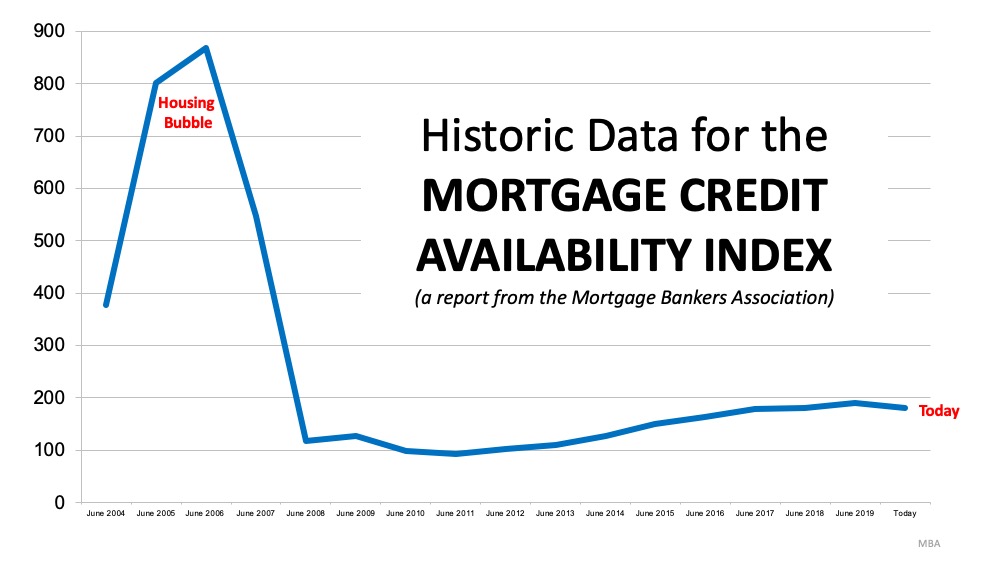
2. Prices are not soaring out of control.
Below is a graph showing annual house appreciation over the past six years, compared to the six years leading up to the height of the housing bubble. Though price appreciation has been quite strong recently, it is nowhere near the rise in prices that preceded the crash.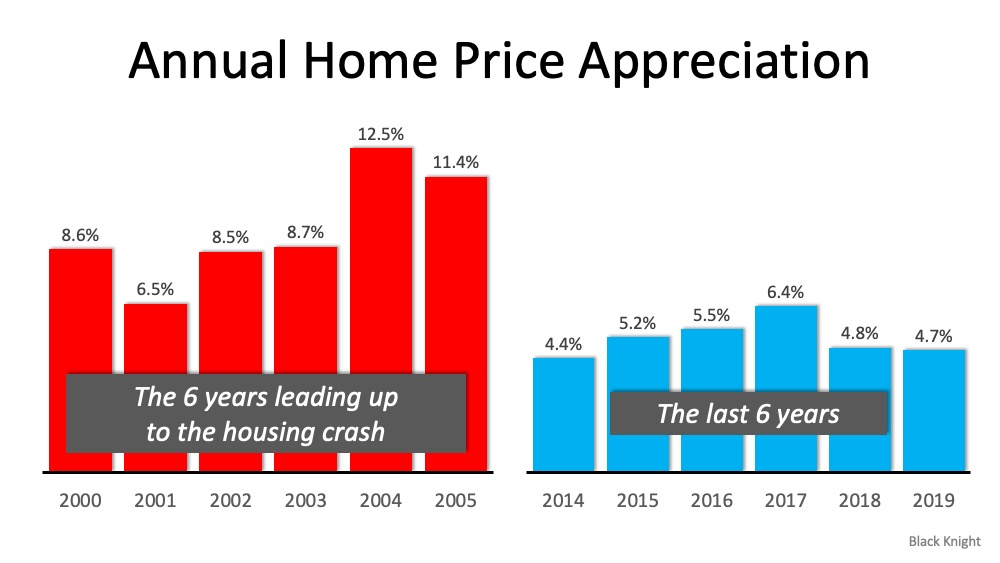 There’s a stark difference between these two periods of time. Normal appreciation is 3.6%, so while current appreciation is higher than the historic norm, it’s certainly not accelerating beyond control as it did in the early 2000s.
3. We don’t have a surplus of homes on the market. We have a shortage.
The months’ supply of inventory needed to sustain a normal real estate market is approximately six months. Anything more than that is an overabundance and will causes prices to depreciate. Anything less than that is a shortage and will lead to continued appreciation. As the next graph shows, there were too many homes for sale in 2007, and that caused prices to tumble. Today, there’s a shortage of inventory which is causing an acceleration in home values.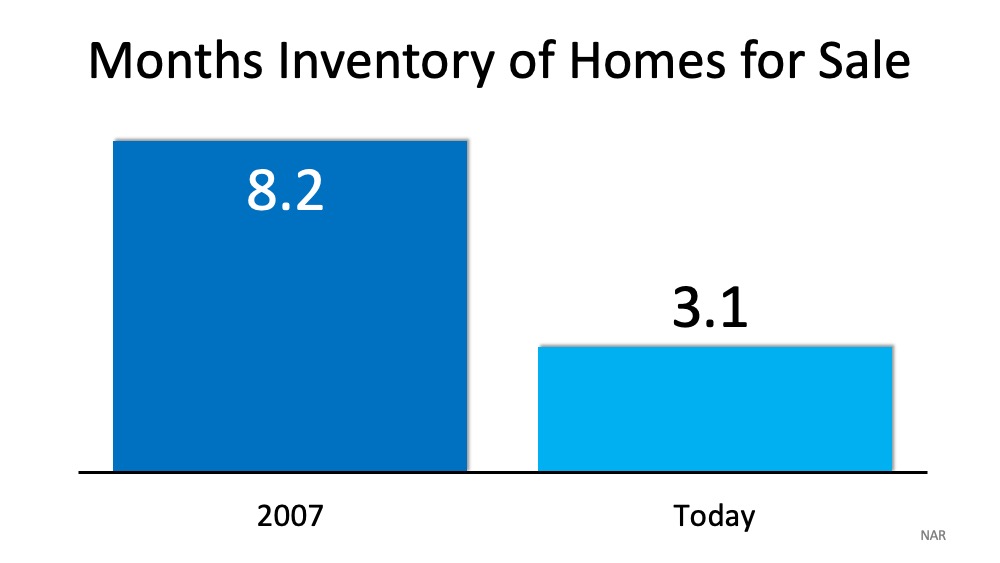
4. Houses became too expensive to buy.
The affordability formula has three components: the price of the home, the wages earned by the purchaser, and the mortgage rate available at the time. Fourteen years ago, prices were high, wages were low, and mortgage rates were over 6%. Today, prices are still high. Wages, however, have increased and the mortgage rate is about 3.5%. That means the average family pays less of their monthly income toward their mortgage payment than they did back then. Here’s a graph showing that difference: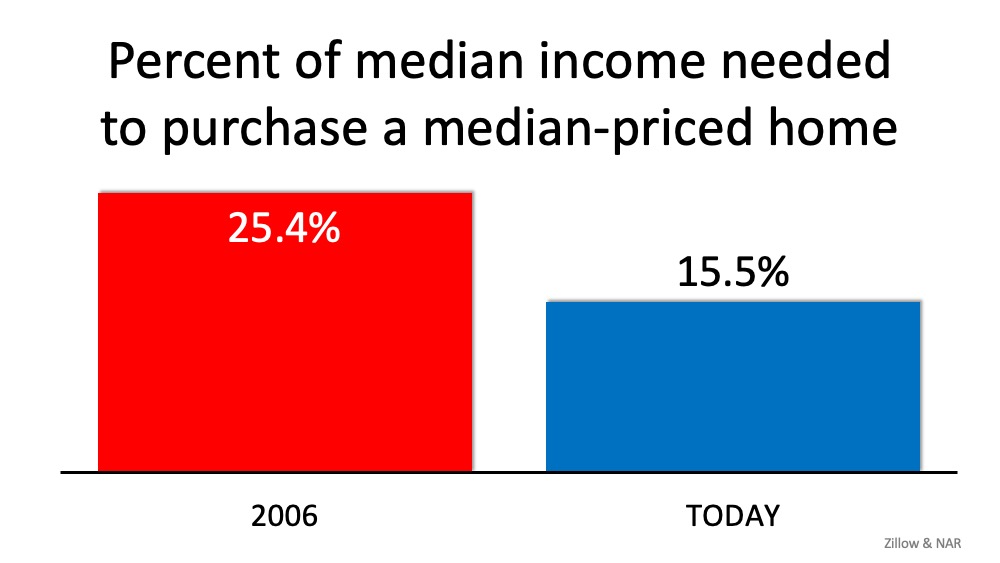
5. People are equity rich, not tapped out.
In the run-up to the housing bubble, homeowners were using their homes as a personal ATM machine. Many immediately withdrew their equity once it built up, and they learned their lesson in the process. Prices have risen nicely over the last few years, leading to over fifty percent of homes in the country having greater than 50% equity. But owners have not been tapping into it like the last time. Here is a table comparing the equity withdrawal over the last three years compared to 2005, 2006, and 2007. Homeowners have cashed out over $500 billion dollars less than before: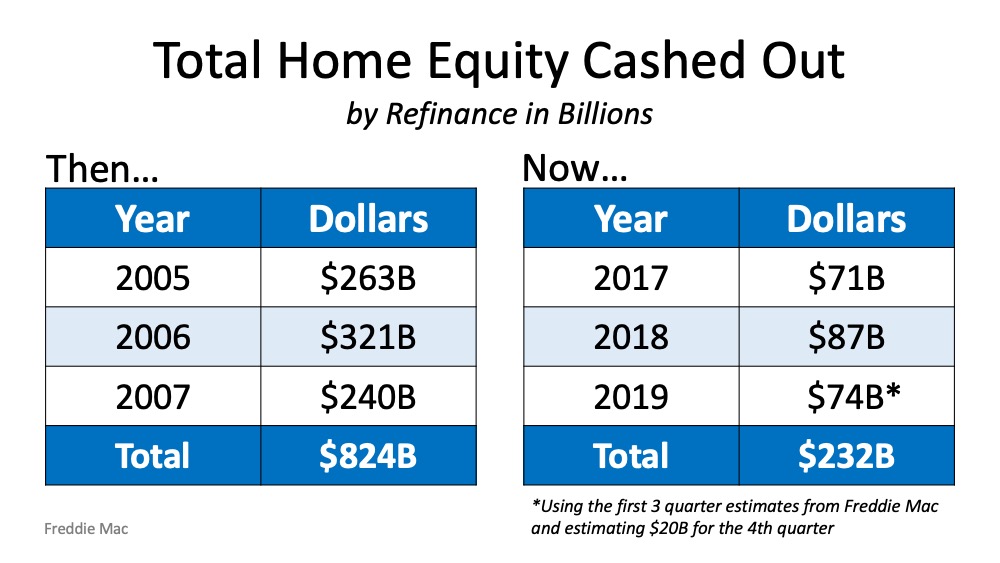 During the crash, home values began to fall, and sellers found themselves in a negative equity situation (where the amount of the mortgage they owned was greater than the value of their home). Some decided to walk away from their homes, and that led to a rash of distressed property listings (foreclosures and short sales), which sold at huge discounts, thus lowering the value of other homes in the area. That can’t happen today.
Bottom Line
If you’re concerned we’re making the same mistakes that led to the housing crash, take a look at the charts and graphs above to help alleviate your fears.

Saving for a down payment can feel like the hardest part of buying a home. And with affordability as tight as it’s been lately, it’s fair to wonder how anyone manages it right now. Here’s something you may not have seen coming.
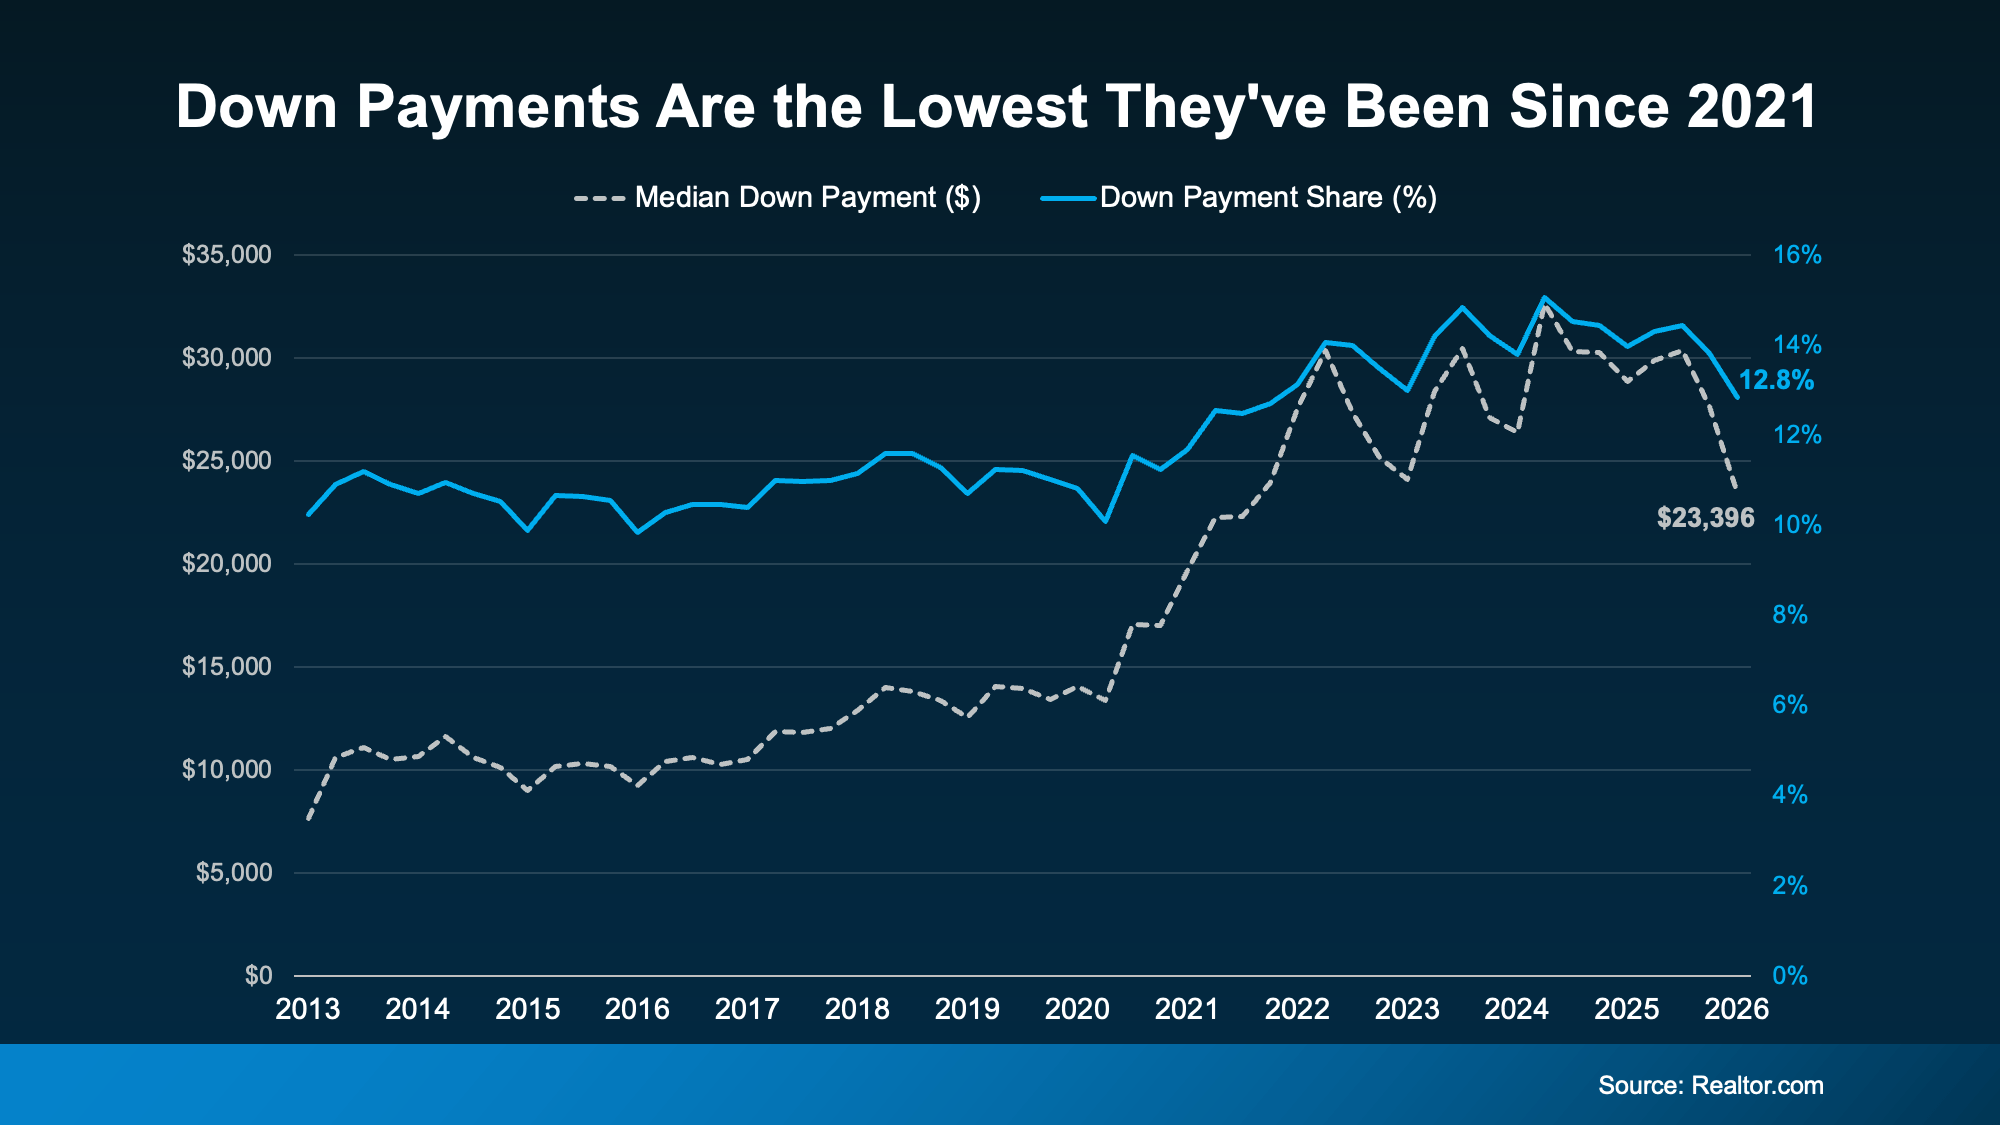
Some people are getting their foot in the door with a smaller down payment.
According to Realtor.com, the typical buyer put down about $23,400 in early 2026 – that’s around $5,000 below what was typical the year before (a 19% drop year over year). That’s the lowest down payments have been since 2021 (see graph below):
So why are buyers putting less money down, and how can you put less down, too? Here’s your answer.
Why Down Payments Are Getting Smaller
There are a few things driving the trend:
-
Less competition between buyers. Part of it comes down to a more balanced market. With buyers facing less competition than they did a few years ago, there’s less pressure to put a big sum down just to stand out.
-
More moderate home prices. Your down payment is a percentage of the purchase price. So, as price growth cools, the amount you need to put down may change too. In a lot of markets, prices have slowed or leveled off, and some areas are even seeing slight dips. That can translate into smaller down payments.
-
Buyers opting for loans with lower down payments. More buyers are also turning to government-backed loans, like FHA and VA, which often need little or no money down. FHA loans have made up more than 24% of purchase mortgages for five straight quarters, and VA loans recently hit their highest share in over a decade, according to Mortgage Professional America.
But even a smaller down payment is still a significant chunk of cash, and saving it can be hard. So where does the rest come from? For many buyers, two things make the difference: programs built to help, and a hand from loved ones.
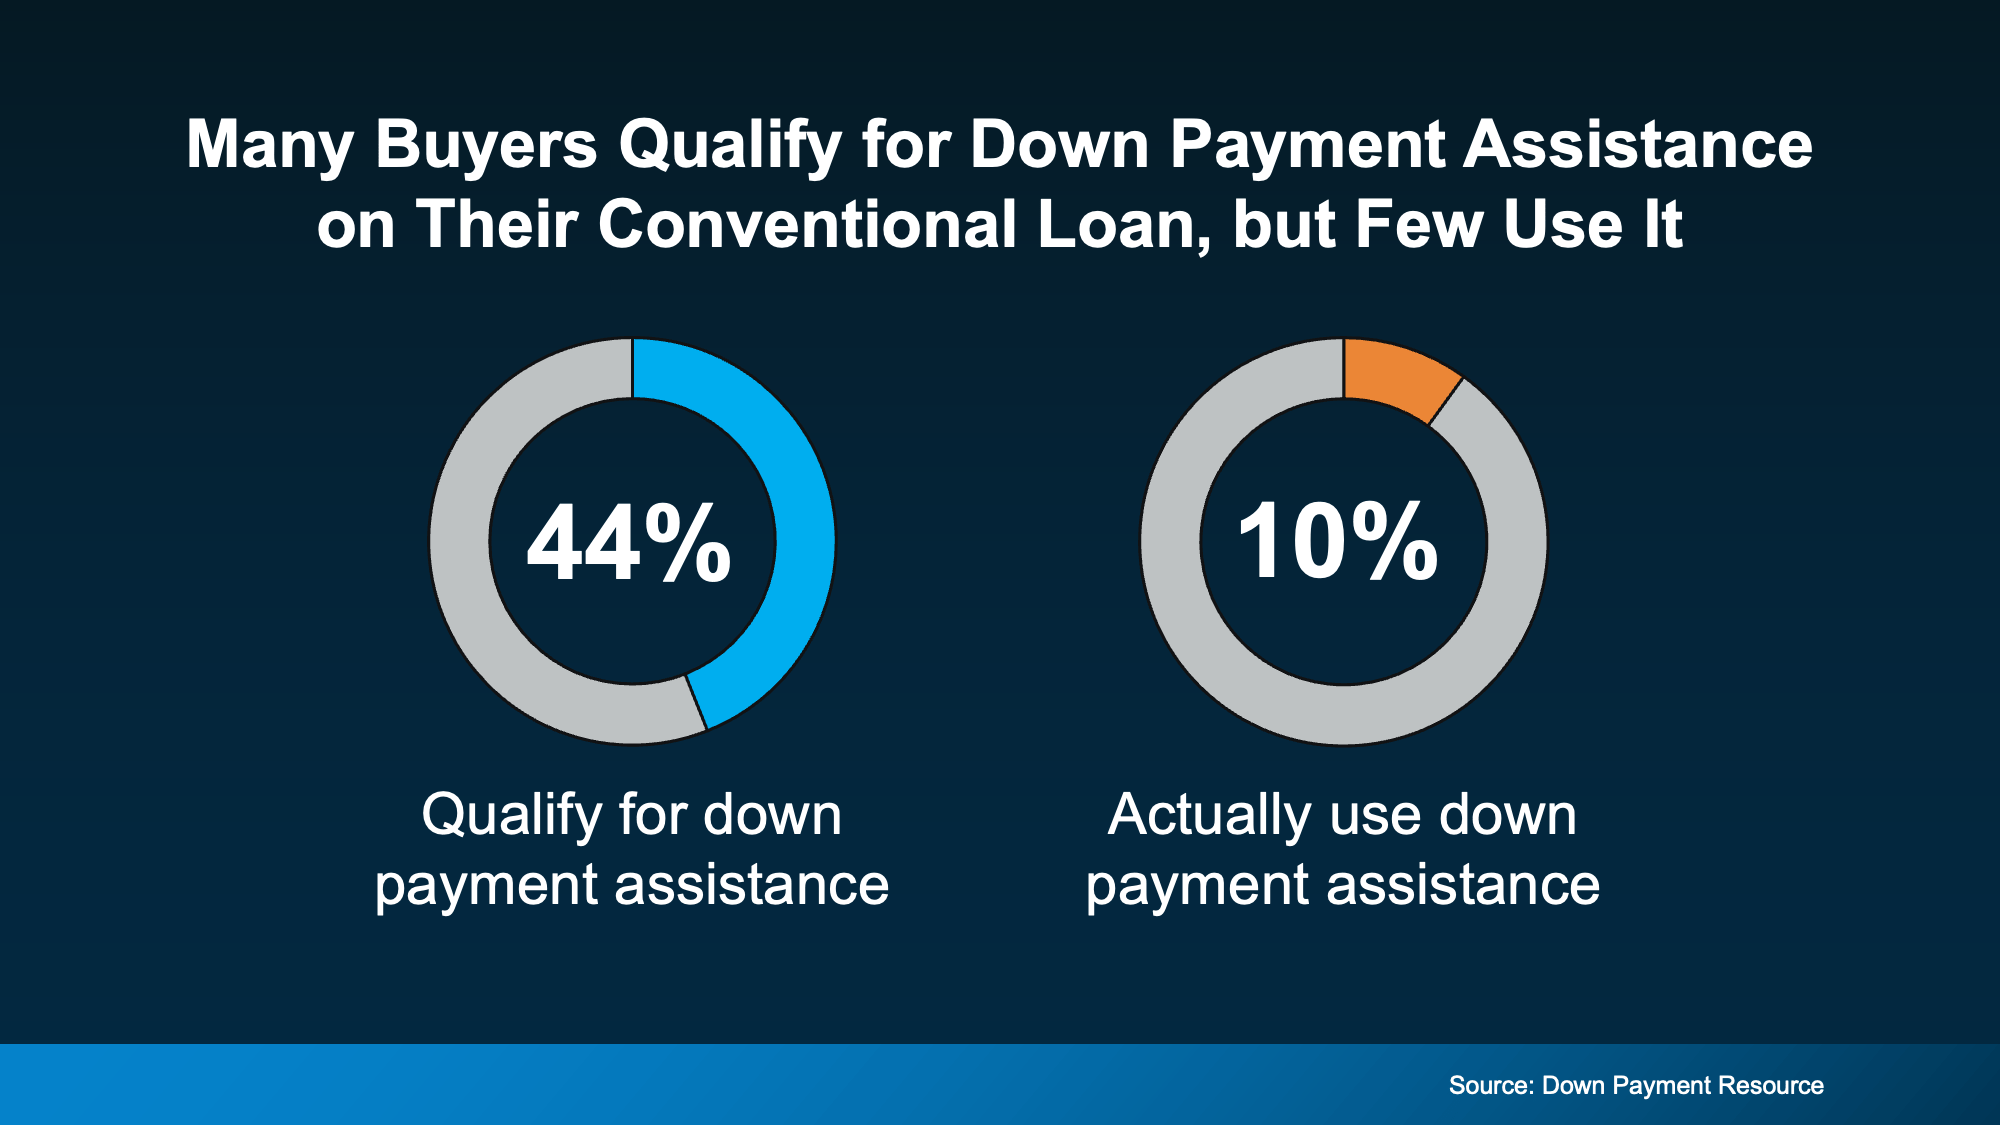
Help You May Not Know You Qualify For
Down payment assistance is one of the most overlooked tools out there. Looking at the 10 largest U.S. metros, Urban Institute and Down Payment Resource found nearly 44% of recent buyers already qualified for a down payment program, but many of them closed on their loan without tapping the help (see chart below):
The options are broader than you might assume, too. According to Down Payment Resource:
-
There are more than 2,600 down payment assistance programs available
-
More than half (62%) are designed to help first-time buyers
-
38% have no first-time buyer requirement, so you may qualify even if you’ve owned before
-
62% are open to buyers earning $100,000 or more
A Boost from Loved Ones
For a growing number of buyers, help comes from closer to home. Research from Veterans United shows about 59% of parents have provided or plan to provide financial support to help their child buy a home.
That support most often goes toward the down payment, followed by help qualifying for a mortgage and covering closing costs. Chris Birk, VP of Mortgage Insight at Veterans United, puts it this way:
“For many families, helping a child buy a home has become less of an optional gesture and more of a practical response to today’s affordability challenges.”
If your loved ones are in a position to help, it can make a real difference in how soon you can buy.
Bottom Line
Down payments are smaller than they’ve been in years, and that opens the door for more buyers.
And with added help from assistance programs and a little help from loved ones, you may have more ways forward than you realized. Connect with a trusted lender to talk through your options.
You’ve probably heard plenty of doom and gloom about the housing market lately. High rates. Stretched budgets. Headlines that make buying or selling sound like a terrible idea. But the data tells a very different story.
This isn’t 2020 or 2021. It was never going to be. Those were the “unicorn years” – historic low mortgage rates, bidding wars on everything, homes flying off the market in days. That kind of market was a once-in-a-generation anomaly, not a baseline. So, when people compare today to that, of course it looks rough.
But compared to almost any other housing market in modern history? This one is holding up remarkably well.
Homeowners Are Sitting on a Mountain of Equity
One of the biggest reasons this market hasn’t cracked is the financial strength of the American homeowner. According to Federal Reserve data, homeowner equity and mortgage debt were nearly identical in 2008. That means, if someone hit a rough patch, they had almost nothing to fall back on. That’s what made that crash so bad.
Today? Total homeowner equity across the country sits at $35 trillion – dwarfing total mortgage debt (see graph below):
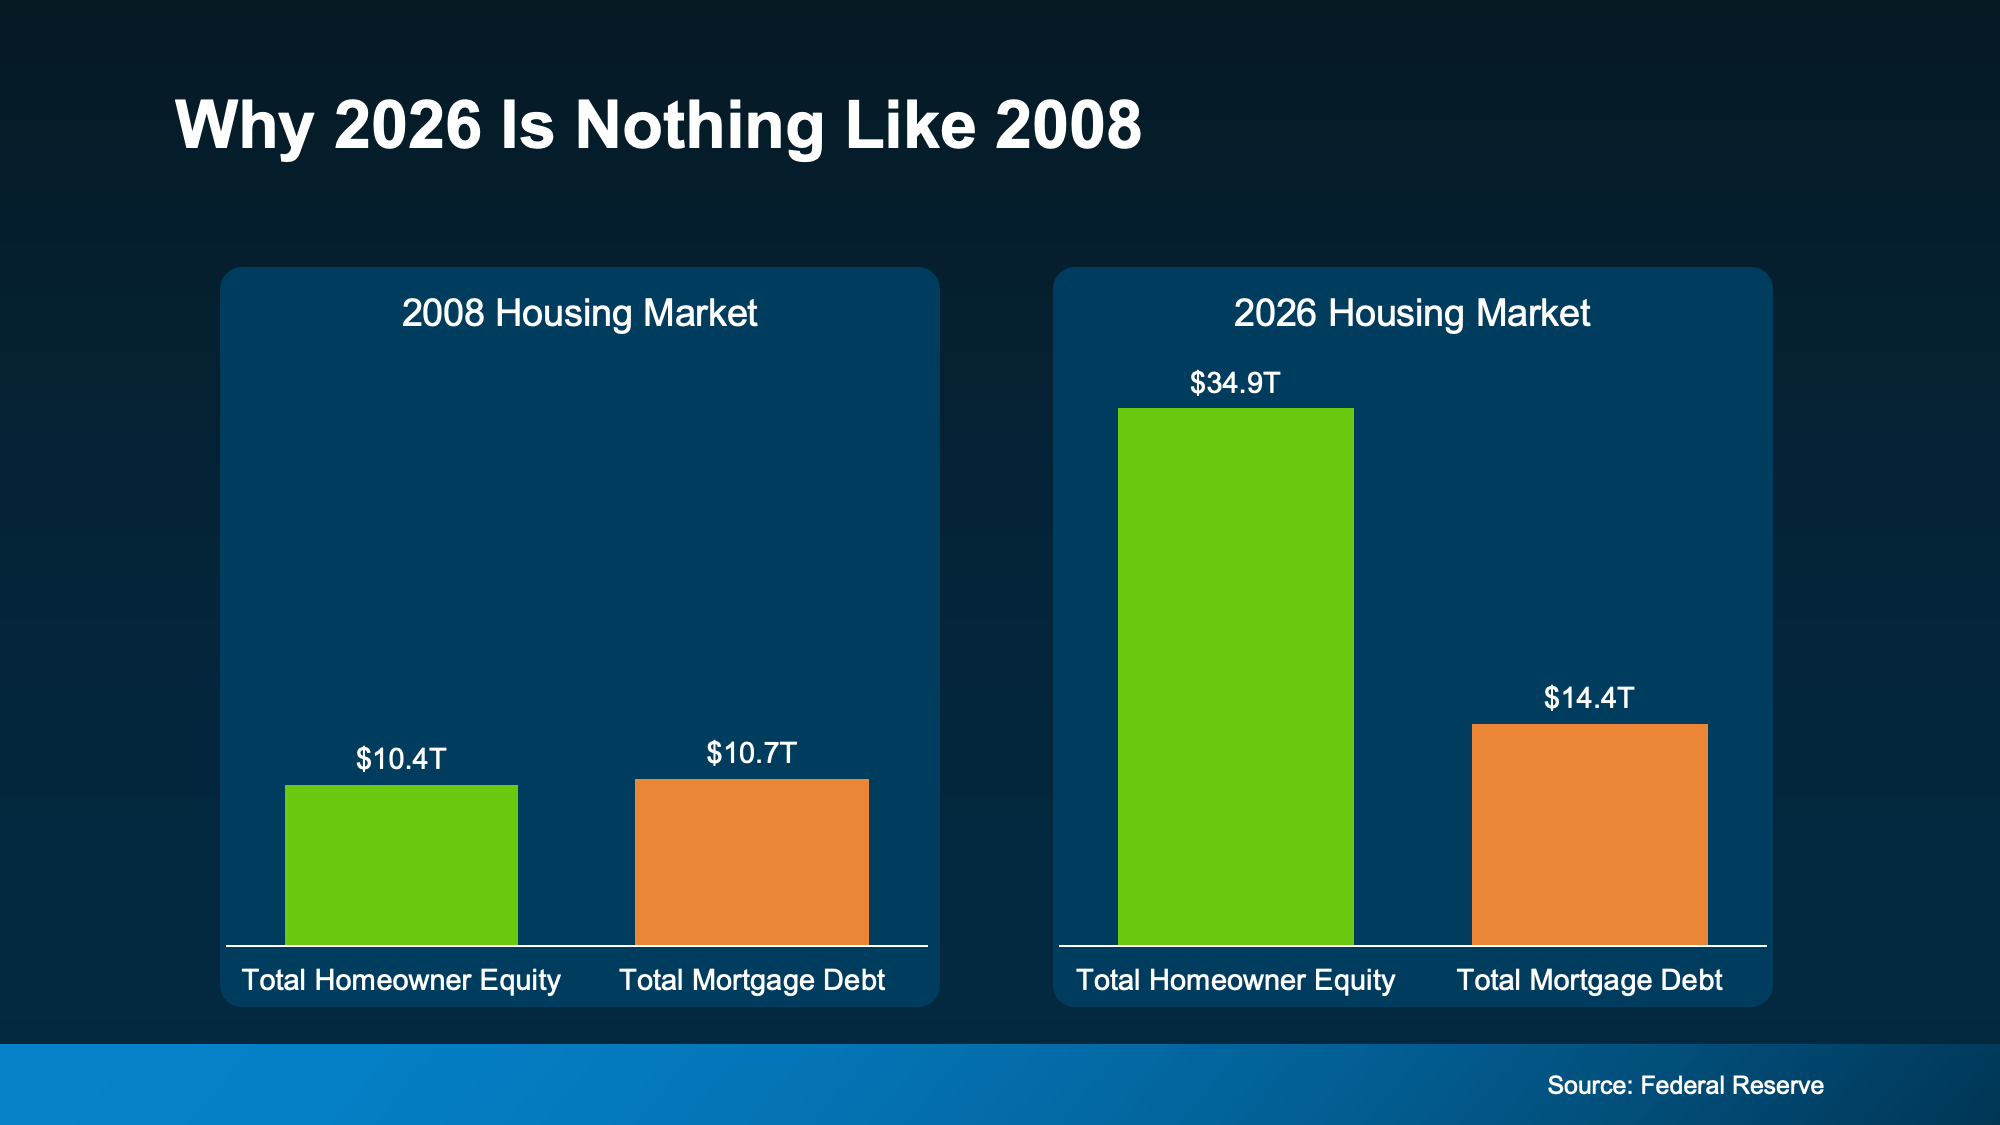 That gap means most homeowners aren’t stretched thin or one bad month away from trouble. They own a meaningful chunk of their home and that gives them options. If they needed to sell, many could because they have a cushion. And that cushion grows over time.
-
Realtor.com found that homeowners who’ve been in their home just 5 years have built up around $180,000 in equity on average. Stick around 6-10 years, and that jumps to over $340,000.
-
Data from ATTOM and the Census shows two-thirds of homeowners either own their home outright or have more than 50% equity.
That’s not a fragile market. That’s a population of homeowners who are financially positioned to sell, to stay, or to make their next move from a place of strength rather than pressure.
Low Rates and Low Foreclosures
At the same time, Federal Housing Finance Agency (FHFA) data shows more than half of all active mortgages still carry a rate below 4% (see graph below):
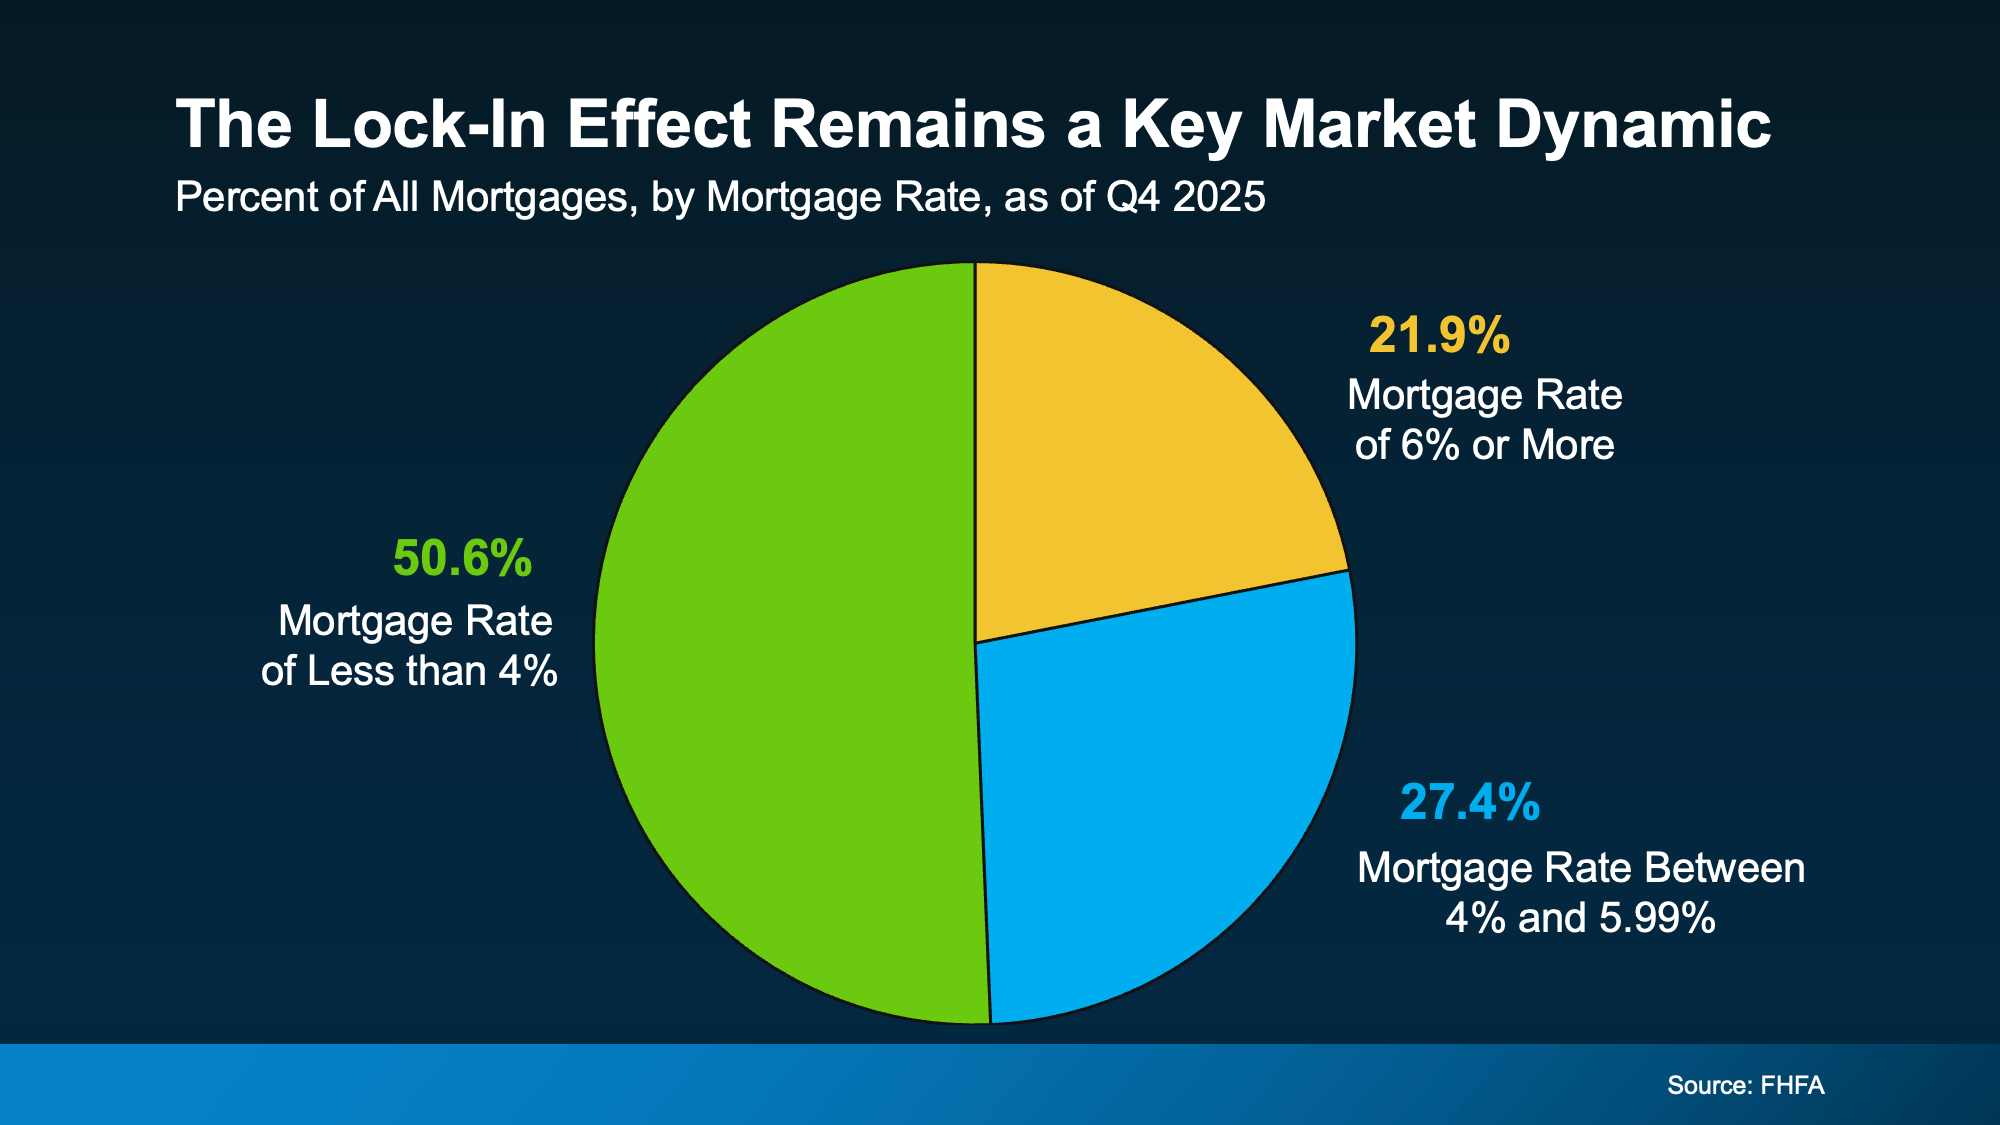 That’s a big reason inventory stays tight. Those homeowners aren’t in a rush to trade their rate for a higher one. They’re sitting comfortably in a strong financial position, not scrambling.
That comfort shows up in the foreclosure numbers, too. Despite a slight recent uptick, foreclosure volumes remain dramatically below historical norms, according to ATTOM. Homeowners aren’t losing their homes in droves. They have equity, they have breathing room, and most have options that keep them out of financial distress.
Prices Are Stabilizing, Not Crashing
Here’s another point on the resilience of the market. Redfin research shows home prices are still rising, but the pace has slowed, now closer to 2% year-over-year nationally (see graph below):
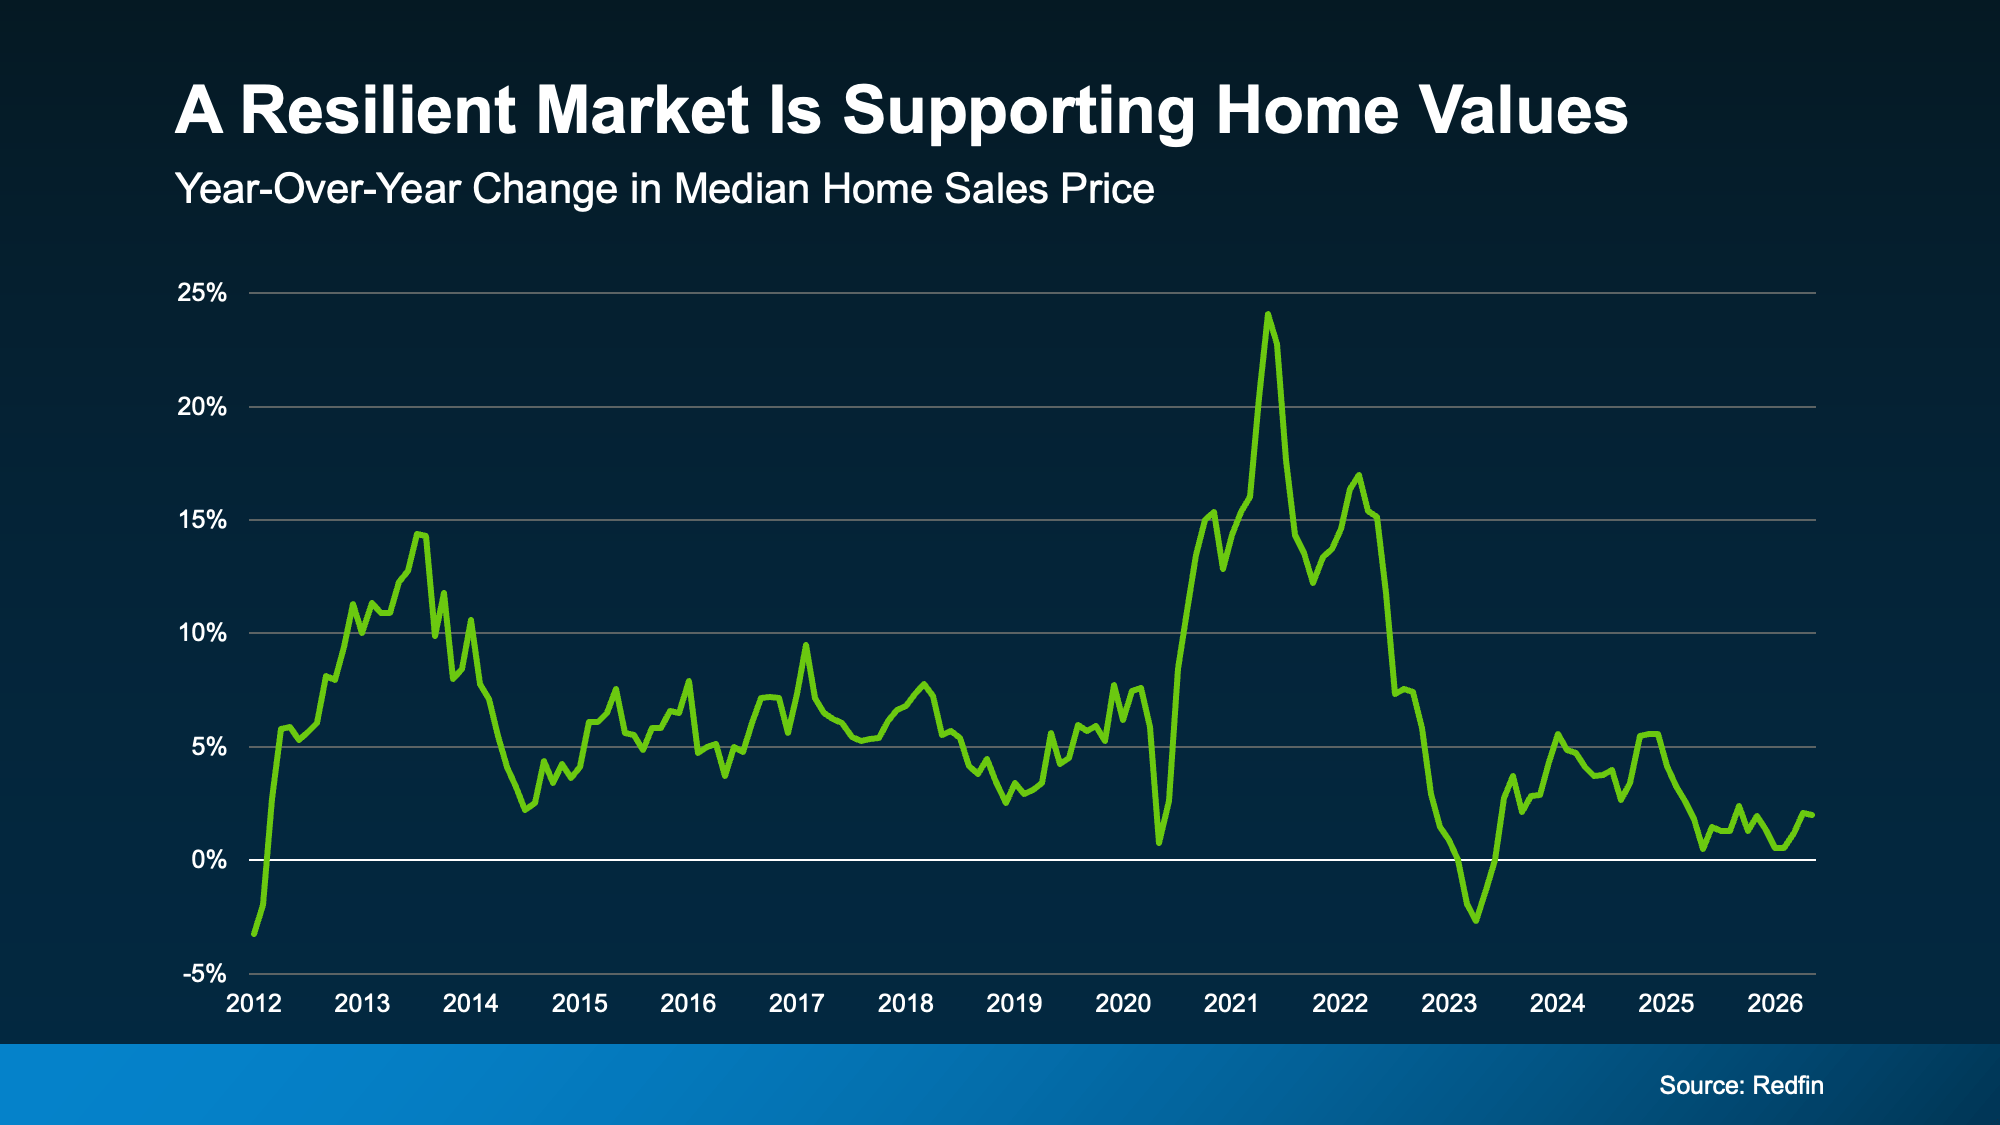 That slowdown is good news, as Daryl Fairweather, Chief Economist at Redfin, explains:
“We’re in the middle of a long-term housing market correction, not a housing market crash. After the pandemic-era frenzy sent prices soaring and inventory to historic lows, the market needed a reset.”
Bottom Line
This market isn’t broken, and waiting for a crash that isn’t coming has a cost. Every month spent on the sidelines is a month someone else is building equity, locking in a price, or getting ahead of what most experts expect to be a housing surge once broader economic conditions settle.
Whether you’re thinking about buying or selling, a local real estate agent can help you figure out what this market means for your specific situation and what your next move could look like.

You’ve probably heard that home prices are cooling off. And that’s true – nationally. But zoom in on individual markets across the country, and the picture looks completely different depending on where you are.
Some areas are still seeing solid price growth. Others have gone flat. A few have actually dipped slightly negative. So, what’s causing all of that variation?
It All Comes Down to Inventory
Here’s the simple version:
-
When there are more homes for sale, buyers have options.
-
More options, means less competition.
-
Less competition means sellers can’t push prices as high.
On the flip side, when inventory is tight, buyers are competing over a small pool of homes, and that pushes prices up.
That dynamic is playing out right now in a really visible way across the country.
Markets where inventory has climbed back to, or above, normal pre-pandemic levels are seeing prices flatten or fall slightly. Markets where inventory is still well below those 2019 benchmarks are still seeing prices rise. As Lance Lambert, CEO of ResiClub, puts it:
“Home prices are still climbing a little year-over-year in many regions where active inventory remains well below pre-pandemic 2019 levels, such as pockets of the Northeast and Midwest.
In contrast, some pockets in states like Texas, Florida, and Colorado — where active inventory exceeds pre-pandemic 2019 levels by a solid clip — are seeing modest home price pullbacks or flat pricing.”
The Maps Say It All
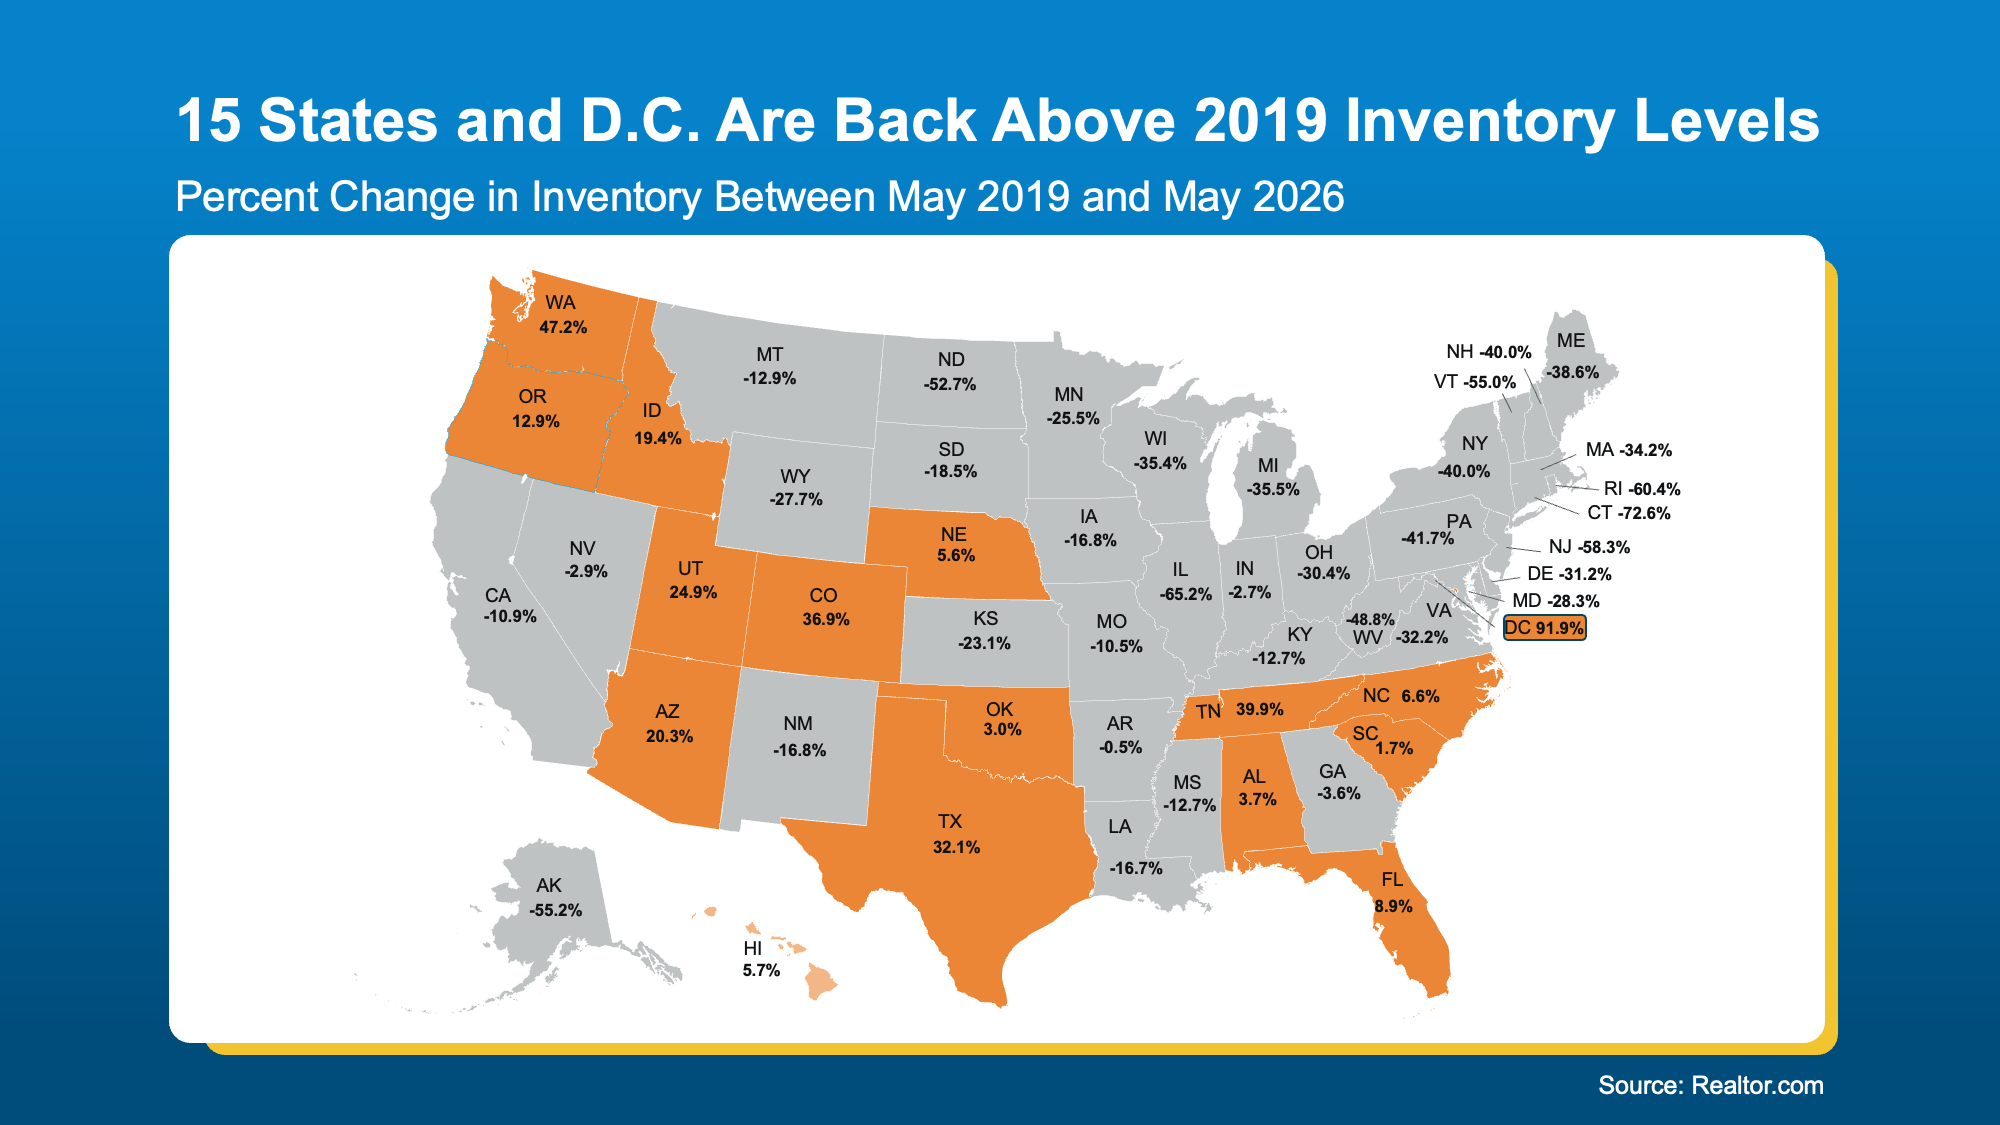
Take a look at where inventory stands today compared to 2019. In most places (the states in gray below), inventory still falls short of where we were back then. And that’s exactly why prices are climbing, albeit moderately, in the vast majority of states.
But you’re probably more interested in where prices are falling a bit, since that’s what is making headlines. So, let’s prove out how much inventory affects prices in those spots.
According to Realtor.com, 15 states and Washington, D.C. are now back above pre-pandemic inventory levels, and some by a wide margin (see the orange in the map below):
 Now, let’s look at the latest Federal Housing Finance Agency (FHFA) data to see what’s happened to home prices in those same states over the past year (again, you’ll want to focus on the orange in the next map).
See how those line up pretty closely with the areas seeing more homes for sale today?
The overlap isn’t a coincidence. It’s cause and effect.
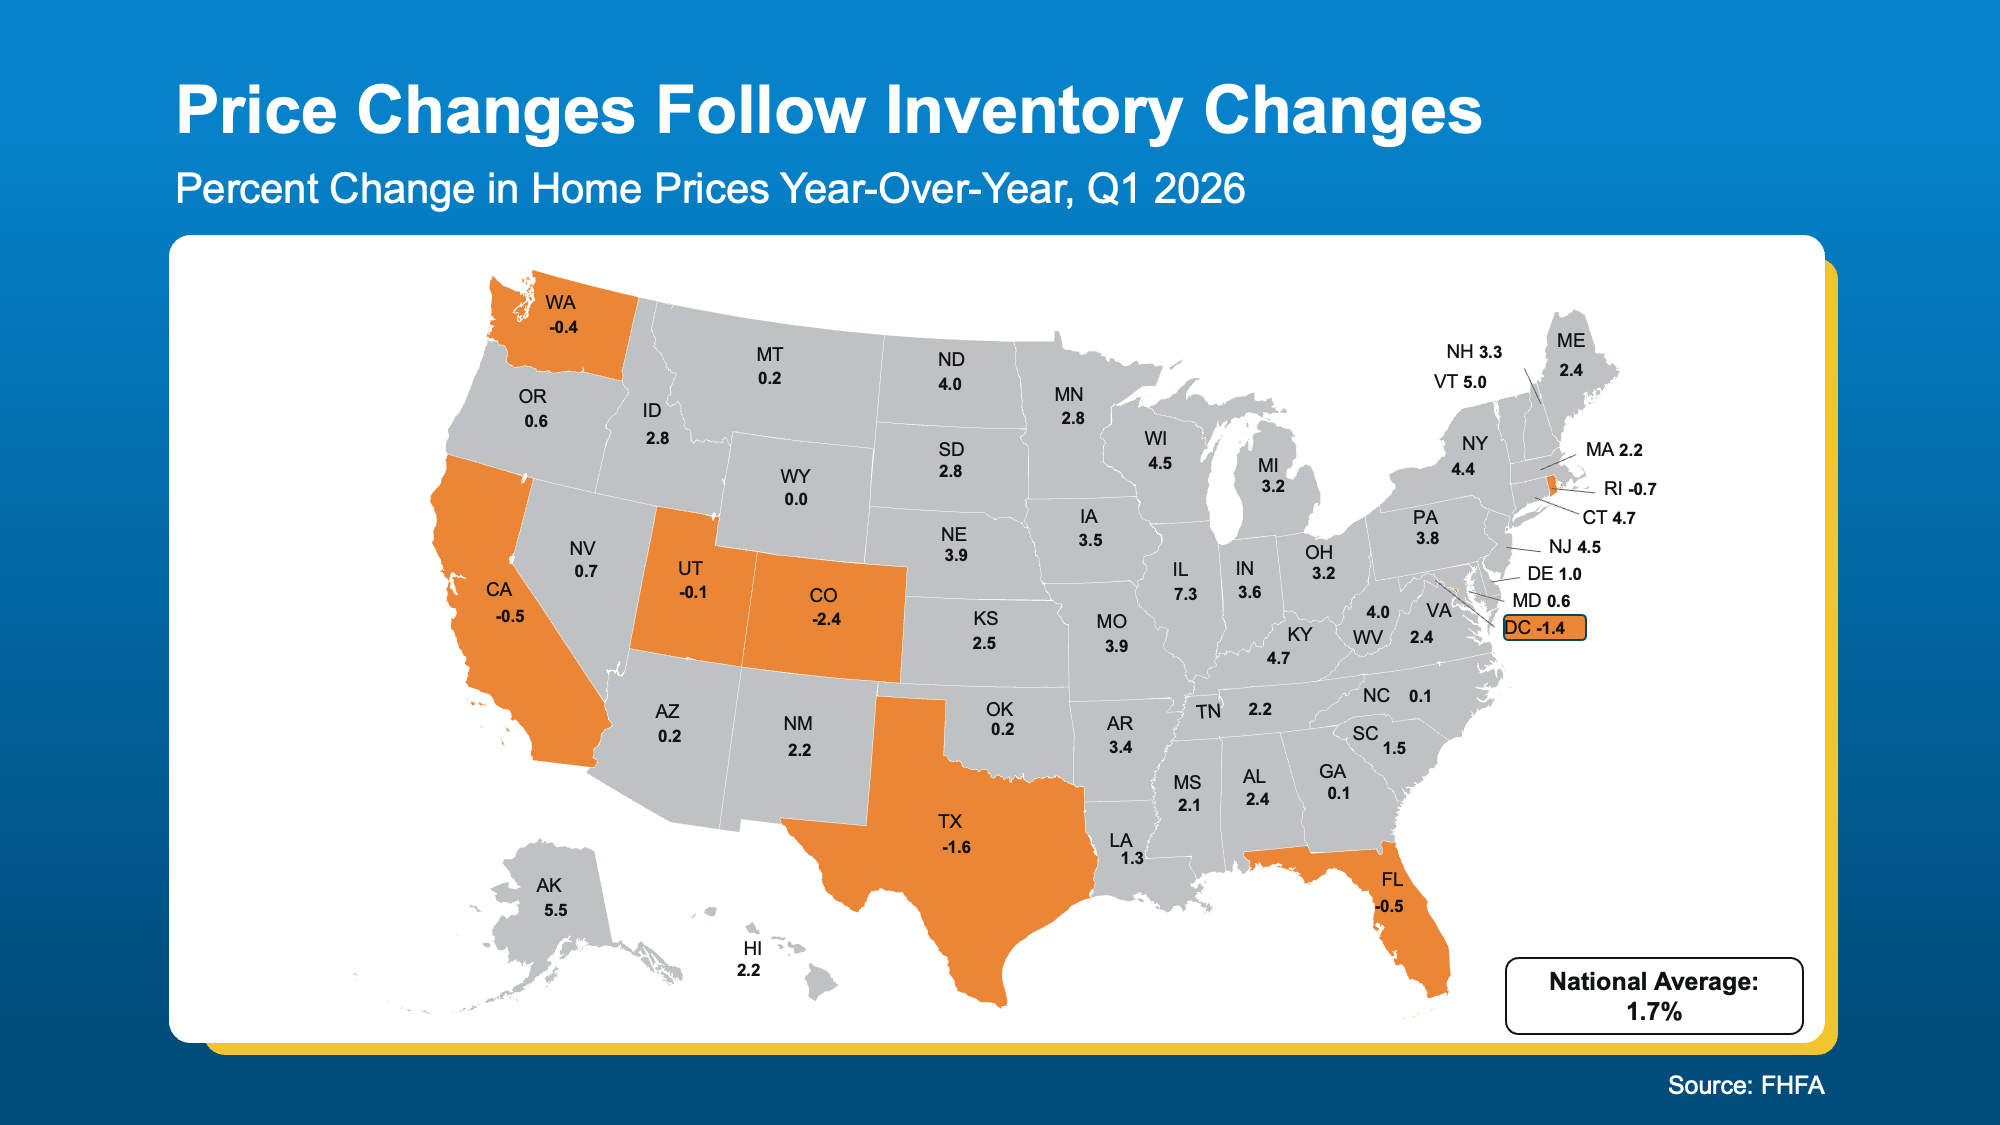
The national average of 1.7% price growth is accurate, but it’s an average of two very different stories happening at the same time – the few areas experiencing mild declines and the overwhelming majority that are still seeing prices rise.
What This Means If You’re Buying or Selling
If you’re a buyer, the market you’re shopping in matters a lot right now. In places like Texas, Colorado, or Florida, you may have real negotiating power – more choices, less competition, and sellers who are more motivated to make a deal. In tighter markets like much of the Northeast, you’re still likely facing a lot of competition.
If you’re a seller, pricing strategy is everything. In markets where inventory has risen, overpricing is one of the fastest ways to linger on the market and eventually sell for less than you would have with the right price from day one. In markets where inventory is still low, you’re in a strong spot, but getting your price right still matters if you want to attract serious buyers quickly. Either way, that’s where a local real estate agent earns their keep.
Bottom Line
When it comes to prices, where you are matters more than ever right now, and a local real estate agent is the best person to help you make sense of it.
Reach out to a local real estate agent today and work together to build a plan that fits your market.

Down Payments Are Smaller Than They’ve Been Since 2021

The Housing Market Is Stronger Than You Think

The 1 Factor That Explains Everything Happening with Home Prices Right Now


-

 Buying Tips4 weeks ago
Two Big Reasons To Move This Summer
-

 Affordability4 weeks ago
Could Moving a Bit Further Out Change Everything About Your Budget?
-
 Affordability4 weeks ago
Lower Asking Prices Are a Win for Today’s Buyers
-

 For Sellers3 weeks ago
Should You Pay for Your Buyer’s Closing Costs? What Sellers Need To Know.
-

 For Buyers3 weeks ago
Think Home Prices Will Crash? Here’s What the Experts Actually Expect.
-
 Affordability2 weeks ago
That House That’s Been Sitting Could Be Your Best Shot at a Deal
-

 Economy2 weeks ago
More Sellers Are Taking Their Homes off the Market. Here’s What You Need To Know.
-

 Agent Value3 weeks ago
Is It Still a Seller’s Market? Here’s What the Data Says.
You must be logged in to post a comment Login